 Open Access Article
〈11![[2 with combining macron]](https://www.rsc.org/images/entities/h2_char_0032_0304.gif) 0〉-orientation-dependent crack initiation in a titanium alloy under dwell fatigue
0〉-orientation-dependent crack initiation in a titanium alloy under dwell fatigue
Zhichun
Zhou†
ab,
Chao
Fang†
bc,
Binbin
Jiang
*ab,
Jianke
Qiu
bc,
Linglei
Zhang
ab,
Jiafeng
Lei
bc,
Rui
Yang
bc and
Kui
Du
 *ab
*ab
aShenyang National Laboratory for Materials Science, Institute of Metal Research, Chinese Academy of Sciences, Shenyang 110016, China. E-mail: kuidu@imr.ac.cn; bbjiang12s@imr.ac.cn
bSchool of Materials Science and Engineering, University of Science and Technology of China, Shenyang 110016, China
cShi-Changxu Innovation Center for Advanced Materials, Institute of Metal Research, Chinese Academy of Sciences, Shenyang 110016, China
First published on 3rd May 2024
Abstract
The crystal orientation of titanium alloys significantly influences the nucleation of dwell fatigue cracks, which deteriorate the service life of aero-engine components. Although soft/hard orientation combinations, depending on the orientation relationship between c-axes and loading directions, are widely recognized as favored crack nucleation sites, the effect of 〈11![[2 with combining macron]](https://www.rsc.org/images/entities/char_0032_0304.gif) 0〉 orientations of soft grains on the cracking of adjacent hard grains is also crucial, and experimental investigation is desired. Here, we report that soft grains with a “rotation angle”, corresponding to the 〈11
0〉 orientations of soft grains on the cracking of adjacent hard grains is also crucial, and experimental investigation is desired. Here, we report that soft grains with a “rotation angle”, corresponding to the 〈11![[2 with combining macron]](https://www.rsc.org/images/entities/char_0032_0304.gif) 0〉 orientation, between 15° and 30° are more prone to induce cracking in hard grains, for the reason that prismatic dislocation slips in these soft grains exert a higher stress normal to the basal plane of adjacent hard grains. In contrast, soft grains with a “rotation angle” between 0° and 15° rarely cause cracking in hard grains. A stress component parameter is proposed according to the “rotation angle”, which can accurately predict the nucleation of fatigue cracks in titanium alloys. The findings shed light on the quantitative analysis of crack nucleation and the prediction of fatigue performance.
0〉 orientation, between 15° and 30° are more prone to induce cracking in hard grains, for the reason that prismatic dislocation slips in these soft grains exert a higher stress normal to the basal plane of adjacent hard grains. In contrast, soft grains with a “rotation angle” between 0° and 15° rarely cause cracking in hard grains. A stress component parameter is proposed according to the “rotation angle”, which can accurately predict the nucleation of fatigue cracks in titanium alloys. The findings shed light on the quantitative analysis of crack nucleation and the prediction of fatigue performance.
1. Introduction
Titanium alloys have been widely employed in aero-engine components, such as compressor discs and fan discs, owing to a combination of high specific strength, excellent corrosion resistance, and good damage resistance.1–4 During service, these components are inevitably subjected to dwell cyclic loading, in which the cyclic loads are held at relatively high mean stress levels for a certain period of time, known as dwell fatigue.5 Dwell fatigue has been proven to significantly deteriorate the service life of titanium alloy components and easily threaten the safe operation of aero-engines.5–7 Dwell fatigue is one of the critical properties of titanium alloys, and so it is of great significance to investigate the mechanism of dwell fatigue damage for their engineering applications.In the past few decades, the dwell fatigue of titanium alloys has attracted extensive research efforts to overcome the challenge associated with its damage mechanisms.5,8–12 The dwell fatigue behavior of titanium alloys is closely related to their microstructure,9,12–15 such as the crystallographic orientation and the size and volume fraction of primary α grains. In addition, the inevitable presence of soft/hard grain pairs in titanium alloys with equiaxed microstructure and bimodal microstructure is considered one of the critical factors in reducing the dwell fatigue life,16,17 and it has been widely demonstrated that soft/hard grain pairs can accelerate the crack initiation.5,9,16,17 Moreover, the angle between the c-axis of soft grains and the applied stress strongly influences the crack nucleation of adjacent hard grains under dwell fatigue.18–21 Here, the soft grain is favorably oriented for slips of prismatic 〈a〉 type dislocations,18,22 while the hard grain has its c-axis nearly parallel to the applied stress and is poorly oriented for slips.18,22,23 In recent years, some studies have suggested that the grain conducive to basal slips is also considered soft.19,24 So far, the definition of soft and hard grains is still unclear.
Based on the characteristics of crack nucleation, the Stroh model for planar slips was proposed to explain the mechanism of dwell fatigue cracking.5,25,26 The Stroh model suggests that extensive dislocations pile up at the soft/hard grain boundary (GB) in soft grains, inducing shear stress and the formation of slip bands in hard grains.5,25 Besides, the Stroh model shows that pile-up stresses at the GB cause additional normal stress on the basal plane of the adjacent hard grain,5,25,26 which, combined with applied stress, ultimately leads to cracking.5,25 Subsequently, numerous experimental investigations and computational simulations verified the Stroh model.16–18,22 The results also showed that the stress concentration caused by prismatic 〈a〉 dislocation ({10![[1 with combining macron]](https://www.rsc.org/images/entities/char_0031_0304.gif) 0}〈11
0}〈11![[2 with combining macron]](https://www.rsc.org/images/entities/char_0032_0304.gif) 0〉) pile up of soft grains at the GB is high, activating a large amount of 〈a〉 and 〈c + a〉 dislocations in hard grains with unfavorable deformation orientation.16,17,22 The above finding shows that 〈a〉 dislocation pile up of soft grains with favorable deformation orientation can easily lead to the cracking of adjacent hard grains. However, the effect of 〈11
0〉) pile up of soft grains at the GB is high, activating a large amount of 〈a〉 and 〈c + a〉 dislocations in hard grains with unfavorable deformation orientation.16,17,22 The above finding shows that 〈a〉 dislocation pile up of soft grains with favorable deformation orientation can easily lead to the cracking of adjacent hard grains. However, the effect of 〈11![[2 with combining macron]](https://www.rsc.org/images/entities/char_0032_0304.gif) 0〉 orientation of soft grains on the cracking of adjacent hard grains has yet to be investigated, which is crucial to the research of fatigue damage mechanisms of titanium alloys.
0〉 orientation of soft grains on the cracking of adjacent hard grains has yet to be investigated, which is crucial to the research of fatigue damage mechanisms of titanium alloys.
In this work, the quantitative effect of soft grains with different 〈11![[2 with combining macron]](https://www.rsc.org/images/entities/char_0032_0304.gif) 0〉 orientations on the cracking of adjacent hard grains in an equiaxed Ti–6.5Al–3.5Mo–1.5Zr–0.3Si alloy under dwell fatigue was investigated using electron backscatter diffraction (EBSD) and transmission electron microscopy (TEM). A stress component parameter was proposed to predict the fatigue crack initiation of hard grains.
0〉 orientations on the cracking of adjacent hard grains in an equiaxed Ti–6.5Al–3.5Mo–1.5Zr–0.3Si alloy under dwell fatigue was investigated using electron backscatter diffraction (EBSD) and transmission electron microscopy (TEM). A stress component parameter was proposed to predict the fatigue crack initiation of hard grains.
2. Materials and methods
The Ti–6.5Al–3.5Mo–1.5Zr–0.3Si (wt%) alloy bar was prepared through vacuum arc remelting and forging. The forged alloy was subjected to a two-step heat treatment consisting of holding at 960 °C for 1.5 hours followed by furnace cooling and 6 hours aging at 530 °C. Dwell fatigue specimens with a gauge diameter of 6 mm and a gauge length of 16 mm were cut from the alloy bar. Dwell fatigue tests were conducted on specimens by using servo-hydraulic testing machines at ambient temperature. The tests were carried out until specimen failure. A trapezoidal waveform with a loading/unloading time of 1 s, a 120 s hold at a maximum stress of 0.91σ0.2 (σ0.2 = 918 MPa), a 1 s hold at minimum stress and an R ratio (σmin/σmax) of 0 were applied.The fracture surface of a dwell fatigued specimen was observed using a KEYENCE VHX-1000C stereo-optical microscope and an FEI Apreo field emission scanning electron microscope. All samples for scanning electron microscopy (SEM) and TEM characterizations were taken from near the fracture surface, and the observation direction of these samples was perpendicular to the loading direction. SEM samples were prepared by mechanical grinding and polishing and then etched in a Kroll reagent (2 ml of HF, 6 ml of HNO3, and 92 ml of H2O). EBSD samples were prepared by grinding and then electropolished in a solution of 30 ml of perchloric acid, 175 ml of n-butanol, and 300 ml of methanol at −50 °C to −30 °C. The alloy's initial microstructure and internal cracks were characterized under an FEI Apreo field emission scanning electron microscope. Crystallographic orientations of cracked α grains (denoted as G1 grains) and adjacent α grains that may cause cracking (denoted as G2 grains) after dwell fatigue were determined using an EBSD detector equipped on the scanning electron microscope. The mean geometrically necessary dislocation (GND) density with 〈a〉 type Burgers vectors in hard grains near soft/hard GBs was calculated from EBSD data with the same step size of 200 nm, and so the comparison of the GND density under the same conditions was statistically significant. The use of mean GND density27 within the measurement region can substantially reduce the effect of extreme GND density values28 and well reflect the trend of GND density variation. The GND density is obtained by determining the dislocation density tensor based on the relationship established by Nye,29 and the primary calculation approach is provided by the work of Pantleon.30 Dislocation analysis in soft/hard grain pairs was conducted using a transmission Kikuchi diffraction (TKD) technique and a JEOL JEM-2100Plus transmission electron microscope. TEM samples were ground to a thickness of 50 μm and then electropolished using a conventional twin jet with the same solution as EBSD samples at −30 °C to −20 °C.
3. Results and discussion
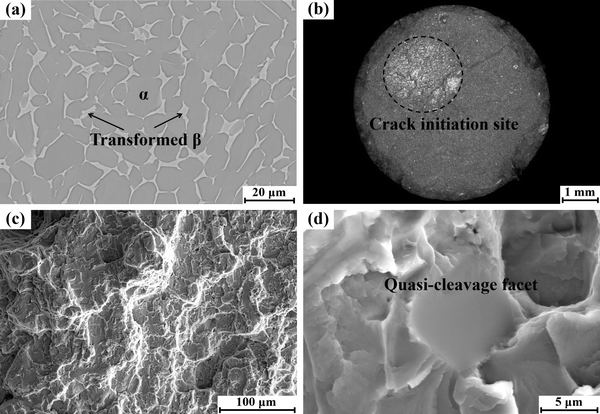
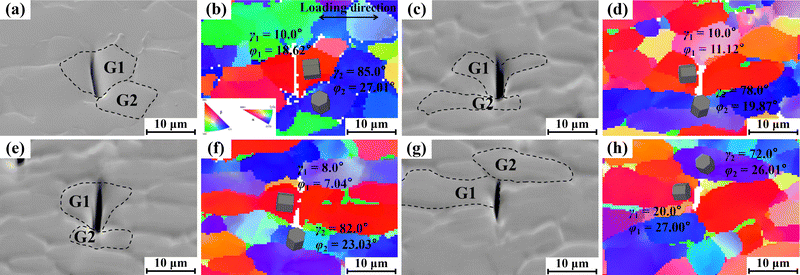
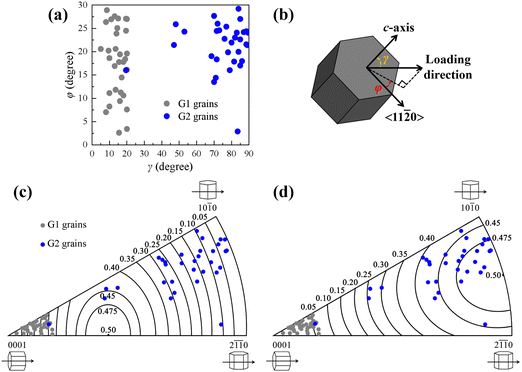
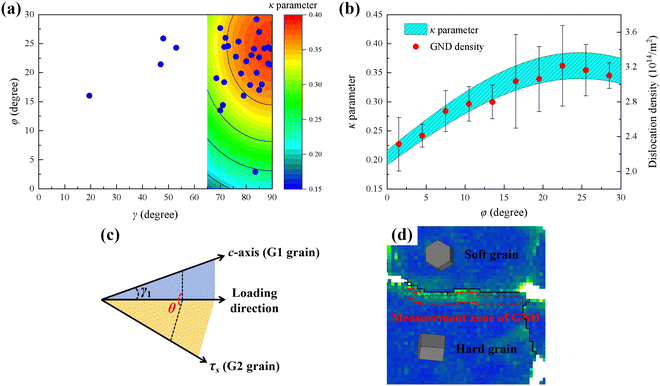
The Ti–6.5Al–3.5Mo–1.5Zr–0.3Si alloy before dwell fatigue shows an equiaxed microstructure consisting of equiaxed α grains (∼85 vol%) and transformed β regions (∼15 vol%), as shown in Fig. 1(a). Transformed β regions are principally distributed at equiaxed α GBs and triple junctions. Fig. 1(b)–(d) show the fracture surface of a dwell fatigued specimen. The fracture surface appears relatively flat overall, with multiple bright regions indicating quasi-cleavage facets (Fig. 1(b)), suggesting that the fracture initiated inside the specimen and exhibited the characteristics of multiple initiation mode. Notably, the quasi-cleavage facet is approximately perpendicular to the loading direction, as shown in Fig. 1(d).To investigate the effect of crystallographic orientations on crack nucleation, crystallographic orientations of G1 grains with cracks approximately perpendicular to the loading direction and corresponding G2 grains were analyzed, as shown in Fig. 2 and 3. There is an adjacent α grain at each end of the crack, and the α grain adjacent to the end with a larger crack opening is considered as the G2 grain,11 as shown in Fig. 2. In this work, a total of 32 G1 and G2 grain pairs were measured. The crystallographic orientation of the α grain was characterized using γ and φ angles, as defined in Fig. 3(b). Here, γ is the angle between the c-axis and the loading direction, and φ is the minimum angle between the projection of the loading direction on the basal plane and the 〈11![[2 with combining macron]](https://www.rsc.org/images/entities/char_0032_0304.gif) 0〉 crystal direction (0 ≤ φ ≤ 30°), which corresponds to the “rotation angle”. The statistical results in Fig. 3(a) indicate that γ angles of these G2 grains predominantly fall within the range of 65° to 90°, and φ angles mainly range from 15° to 30°. Furthermore, Fig. 4 shows the comparison of γ and φ angle distributions of G2 grains and that of α grains adjacent to uncracked hard grains, and it is evident that γ angles of α grains adjacent to uncracked hard grains are more distributed between 20° and 70°, while the φ angle distribution is relatively uniform between 0 and 30° when 65° ≤ γ ≤ 90°. Since these cracked grain pairs for EBSD characterization were randomly selected from samples, the results obtained by characterizing these grain pairs are sufficiently representative. Therefore, there is an actual correlation between angles (γ and φ angles) and the distribution of G2 grains. In addition, Schmid factor analysis in Fig. 3(d) indicates that G2 grains are mostly well-oriented for the prismatic slip with a Schmid factor higher than 0.4. For G1 grains, c-axes of these G1 grains are approximately parallel to the loading direction, with a declination angle of 0°–20°, as shown in Fig. 3(a). Fig. 3(c) shows that basal Schmid factors of G1 grains are lower than 0.32, which are relatively poorly oriented for the basal slip. Besides, the crack surface is along the basal plane of the G1 grain, as shown in Fig. 2. Moreover, there is a blue dot in the grey one group in Fig. 3(a), which may be due to other factors (such as other α grains nearby) affecting the cracking of the grain pair.20,23 In the actual measurements, there may be some incidental deviations due to sampling influences. However, statistical methods were used to investigate and obtain the distribution pattern of G2 grains’ orientation (γ and φ angles) based on the majority of the data points (>96%). Therefore, the blue dot in the grey one group has little effect on the results and discussions of the paper. To sum up, in addition to the γ angle, the φ angle of the adjacent grain plays an essential role in the crack nucleation of the G1 grain.
0〉 crystal direction (0 ≤ φ ≤ 30°), which corresponds to the “rotation angle”. The statistical results in Fig. 3(a) indicate that γ angles of these G2 grains predominantly fall within the range of 65° to 90°, and φ angles mainly range from 15° to 30°. Furthermore, Fig. 4 shows the comparison of γ and φ angle distributions of G2 grains and that of α grains adjacent to uncracked hard grains, and it is evident that γ angles of α grains adjacent to uncracked hard grains are more distributed between 20° and 70°, while the φ angle distribution is relatively uniform between 0 and 30° when 65° ≤ γ ≤ 90°. Since these cracked grain pairs for EBSD characterization were randomly selected from samples, the results obtained by characterizing these grain pairs are sufficiently representative. Therefore, there is an actual correlation between angles (γ and φ angles) and the distribution of G2 grains. In addition, Schmid factor analysis in Fig. 3(d) indicates that G2 grains are mostly well-oriented for the prismatic slip with a Schmid factor higher than 0.4. For G1 grains, c-axes of these G1 grains are approximately parallel to the loading direction, with a declination angle of 0°–20°, as shown in Fig. 3(a). Fig. 3(c) shows that basal Schmid factors of G1 grains are lower than 0.32, which are relatively poorly oriented for the basal slip. Besides, the crack surface is along the basal plane of the G1 grain, as shown in Fig. 2. Moreover, there is a blue dot in the grey one group in Fig. 3(a), which may be due to other factors (such as other α grains nearby) affecting the cracking of the grain pair.20,23 In the actual measurements, there may be some incidental deviations due to sampling influences. However, statistical methods were used to investigate and obtain the distribution pattern of G2 grains’ orientation (γ and φ angles) based on the majority of the data points (>96%). Therefore, the blue dot in the grey one group has little effect on the results and discussions of the paper. To sum up, in addition to the γ angle, the φ angle of the adjacent grain plays an essential role in the crack nucleation of the G1 grain.
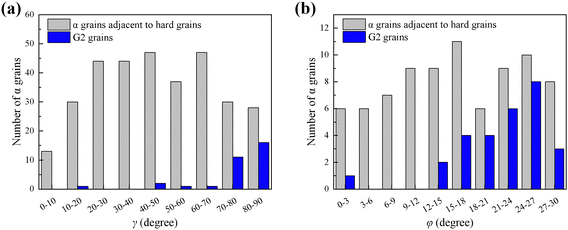 | ||
| Fig. 4 (a) γ angle distribution of G2 grains and α grains adjacent to uncracked hard grains. (b) φ angle distribution of G2 grains and α grains adjacent to uncracked hard grains when 65° ≤ γ ≤ 90°. | ||
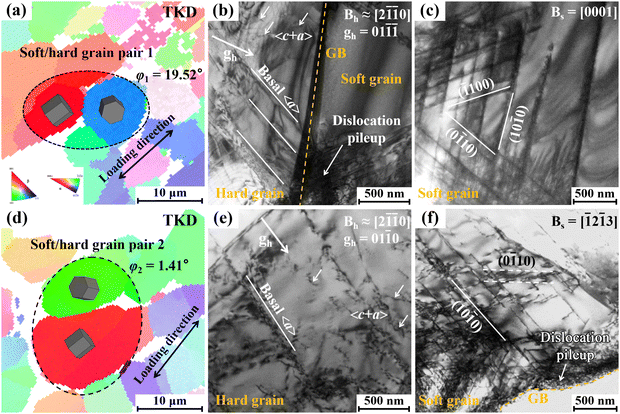
Dislocation activities in soft/hard grain pairs with different φ angles of soft grains were observed, as shown in Fig. 5. Crystallographic orientations of soft/hard grain pairs were determined by the TKD technique. The results show that, in both types of grain pairs (φ1 = 19.52° and φ2 = 1.41°), there are a large number of prismatic slip bands in soft grains (Fig. 5(c) and (f)), and extensive dislocations pile up against soft/hard GBs in these grains, as shown in Fig. 5(b) and (f). Meanwhile, in adjacent hard grains, a large number of 〈a〉 and 〈c〉 + 〈a〉 dislocations, especially the formation of basal slip bands, are observed, as shown in Fig. 5(b) and (e). The bright field TEM image in Fig. 5(b) shows that basal slip bands in the hard grain are emitted from the GB where prismatic 〈a〉 dislocations of the soft grain pile up, indicating that the basal slip is induced by the dislocation pile up of the soft grain. By comparing dislocation activities in Fig. 5, it can be seen that the dislocation types in soft/hard grain pairs with different φ angles of soft grains are the same. Furthermore, the mean GND density in hard grains near soft/hard GBs was measured, where γ angles of soft grains are between 70° and 90°, as shown in Fig. 6(b). Here, the mean standard error is used as the error bar. The result shows that the GND density within the hard grain rises with increasing φ angle of the soft grain when the φ angle is between 0 and 22.5°, while the GND density drops slightly within the φ angle between 22.5° and 30°.
According to the above experimental results, it is found that the cracking of G1 grains is related to φ and γ angles of G2 grains. Thus, a stress component parameter κ is proposed to characterize the possibility of cracking. The κ parameter is derived from the stress component, which is the projection of the G2 grain's maximum prismatic shear stress along the normal direction of the hard grain's basal plane. Based on the relationship between the G2 grain orientation and the loading direction, a prismatic Schmid factor is derived:
m(φ,γ) = cos![[thin space (1/6-em)]](https://www.rsc.org/images/entities/char_2009.gif) φ·sin φ·sin![[thin space (1/6-em)]](https://www.rsc.org/images/entities/char_2009.gif) φ·sin2 φ·sin2![[thin space (1/6-em)]](https://www.rsc.org/images/entities/char_2009.gif) γ = τs(φ,γ)/σ γ = τs(φ,γ)/σ | (1) |
σ′ = τs·[cos![[thin space (1/6-em)]](https://www.rsc.org/images/entities/char_2009.gif) γ1·cos(60 − φ)·sin γ1·cos(60 − φ)·sin![[thin space (1/6-em)]](https://www.rsc.org/images/entities/char_2009.gif) γ + cos γ + cos![[thin space (1/6-em)]](https://www.rsc.org/images/entities/char_2009.gif) θ·sin θ·sin![[thin space (1/6-em)]](https://www.rsc.org/images/entities/char_2009.gif) γ1·(1 − cos2(60 − φ)·sin2 γ1·(1 − cos2(60 − φ)·sin2![[thin space (1/6-em)]](https://www.rsc.org/images/entities/char_2009.gif) γ)1/2] γ)1/2] | (2) |
σ′ = 0.95·τs·cos(60 − φ) = 0.95·σ·cos2(60 − φ)·sin (60 − φ)·sin2![[thin space (1/6-em)]](https://www.rsc.org/images/entities/char_2009.gif) γ γ | (3) |
Finally, the κ parameter is obtained using the following formula:
κ = cos2 (60 − φ)·sin (60 − φ)·sin2![[thin space (1/6-em)]](https://www.rsc.org/images/entities/char_2009.gif) γ γ | (4) |
Accordingly, it can be considered that the normal stress on the G1 grain's basal plane induced by the prismatic dislocation pile up of the G2 grain at the GB corresponds to the value of the κ parameter. That is, the normal stress is positively correlated with the κ value.
Fig. 6(a) shows the contour plot of the κ parameter related to γ and φ angles, and different colors represent the magnitude of κ values. Considering that eqn (4) has been simplified, the contour plot with γ angles between 65° and 90° is meaningful. γ and φ angle distributions of all G2 grains (blue solid circle) obtained from the experiment are also plotted in Fig. 6(a). It is found that 87.5% of G2 grains have γ angles between 65° and 90°, demonstrating that the simplification of eqn (2) is reasonable. A comparison of experimental and calculated results reveals that 89.3% of G2 grains with γ angles between 65° and 90° have κ values larger than 0.32. Furthermore, Fig. 6(a) shows that the region with a large κ value has a high distribution density of G2 grains, indicating that soft grains with higher κ values preferentially lead to the cracking of adjacent hard grains. In this work, dwell fatigue tests were conducted at ambient temperature, and so orientations of α grains change little before and after dwell fatigue deformation. The results of quasi in situ EBSD reported by Sun et al.31 and Hémery and Villechaise32 also show that α grains in titanium alloys did not rotate significantly during room-temperature deformation.
Moreover, Fig. 6(b) shows that the variation trend of the κ value with φ angles is similar to that of the GND density value in hard grains near GBs with φ angles. The GND density value in hard grains near GBs can reflect the magnitude of stress concentration there. The higher stress concentration caused by the dislocations pile up of soft grains can activate more dislocations in hard grains near soft/hard GBs.16,17 In particular, the κ value is maximal for γ = 90° and φ = 25°, suggesting that there is the highest stress normal to the basal plane of adjacent hard grains. Fig. 6(a) also shows that the distribution density of G2 grains is high near the region where γ = 90° and φ = 25°. In addition, when the φ angle of soft grains is around 25°, the GND density in hard grains is higher, as shown in Fig. 6(b). Accordingly, the “worst” combination causing cracking is considered as that in which a hard grain is adjacent to an α grain with the c-axis normal to the load direction and a φ angle of 25°. In addition, two types of dislocations are formed in crystals during deformation, namely GND and statistically stored dislocation.33,34 The hard grain is poorly oriented for slips (low basal and prismatic slip Schmid factors), resulting in little plastic deformation35–37 and thus low statistically stored dislocation density during dwell fatigue. Therefore, the GND density has been mainly determined and discussed in this paper.
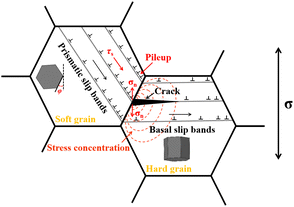
Herein a schematic diagram of the crack initiation mechanism is shown in Fig. 7. During dwell fatigue, extensive prismatic 〈a〉 dislocations are readily activated in the soft grain and accumulate at the soft/hard GB, which will cause the stress redistribution (namely load shedding) from soft grains to hard grains, resulting in a local stress concentration at the soft/hard GB.17,22,38,39 Furthermore, the stress concentration at the GB can induce basal slips in the hard grain,5,25,40 which the measured GND density in the work can reflect. The stress component along the hard grain's basal plane can be released by basal slips, while the stress component normal to the hard grain's basal plane still exists. Therefore, it is considered that the GND density of hard grains near soft/hard GBs can be directly proportional to the magnitude of stress normal to hard grains’ basal planes caused by dislocation pile up of soft grains. Moreover, the formed basal slip band may become a preferential crack nucleation site.5,16,25 When the φ angle of the soft grain is between 15° and 30°, the normal stress is relatively high. Besides, the high normal stress combined with the applied stress is sufficient to overcome the cohesive strength of α grains, which assists the cracking of the adjacent hard grain along the basal plane with “quasi-cleavage”, as shown in Fig. 7. When the φ angle is between 0° and 15°, the normal stress is relatively low. Therefore, it is difficult to form cracks in the hard grain.
Moreover, the time-dependent deformation of α grains also affects the initiation of dwell fatigue cracks.37,41–45 Numerous investigations show that the time-dependent deformation behavior (or strain rate sensitivity) of α grains is closely relevant to their crystallographic orientation.37,43,44 The strain rate sensitivity of α grains varies with the declination angle (γ angle) between their c-axis and the applied stress, with a larger γ angle associated with stronger strain rate sensitivity.44 Meanwhile, a strong strain rate sensitivity can increase the stress redistribution from soft grains to hard grains caused by the load shedding, thereby increasing the local stress of hard grains and promoting the cracking of hard grains.37,45 The above results37,44,45 considering time-dependent deformation show that the soft grain with a large γ angle is more likely to cause the cracking of the adjacent hard grain, which is consistent with the results we obtained based on the calculated stress component. Furthermore, the time-dependent deformation behavior is related to the φ angle in addition to the γ angle. The crystallographic orientation favorable for slips (i.e. large macroscopic Schmid factor associated with γ and φ angles) can intensify the magnitude of stress drop, resulting in a large stress oscillation.43 Although the time-dependent deformation cannot be effectively characterized by our current research methods, the issue is indeed worthy of further research.
4. Conclusion
In this study, the quantitative effect of soft grains with different 〈11![[2 with combining macron]](https://www.rsc.org/images/entities/char_0032_0304.gif) 0〉 orientations on the cracking of hard grains was investigated in the equiaxed titanium alloy after dwell fatigue testing, showing that, in addition to the angle between the c-axis and the loading direction, the “rotation angle”, corresponding to the 〈11
0〉 orientations on the cracking of hard grains was investigated in the equiaxed titanium alloy after dwell fatigue testing, showing that, in addition to the angle between the c-axis and the loading direction, the “rotation angle”, corresponding to the 〈11![[2 with combining macron]](https://www.rsc.org/images/entities/char_0032_0304.gif) 0〉 orientation, of adjacent grains plays a vital role in the crack nucleation of hard grains. The change in the “rotation angle” affects the normal stress on the basal plane of hard grains, leading to the difference in the crack nucleation probability of hard grains. Soft grains with a “rotation angle” of 15°–30° are prone to cause cracking of adjacent hard grains. A stress component parameter κ was proposed to predict the crack nucleation. The hard grains preferentially initiate cracks when the κ value is larger than 0.32.
0〉 orientation, of adjacent grains plays a vital role in the crack nucleation of hard grains. The change in the “rotation angle” affects the normal stress on the basal plane of hard grains, leading to the difference in the crack nucleation probability of hard grains. Soft grains with a “rotation angle” of 15°–30° are prone to cause cracking of adjacent hard grains. A stress component parameter κ was proposed to predict the crack nucleation. The hard grains preferentially initiate cracks when the κ value is larger than 0.32.
Author contributions
Zhichun Zhou and Chao Fang conducted the experiments, analyzed the data and prepared the manuscript. Kui Du and Binbin Jiang revised the paper and directed the entire research. The project was supervised by Kui Du and Jianke Qiu. All authors contributed to the discussion.Conflicts of interest
There are no conflicts to declare.Acknowledgements
This work was supported by the National Natural Science Foundation of China (grant no. 91960202, 52171020, 51901229 and 51701219), CAS Project for Young Scientists in Basic Research (grant no. YSBR-025), Youth Innovation Promotion Association CAS (grant no. 2022188), and National Key R & D Program of China (grant no. 2021YFC2800503 and 2022YFB3708300).References
- R. R. Boyer, An overview on the use of titanium in the aerospace industry, Mater. Sci. Eng., A, 1996, 213, 103–114 CrossRef
.
-
C. Leyens and M. Peters, Titanium and Titanium Alloys-Fundamentals and Applications, Wiley-VCH Verlag GmbH & Co. KGaA, Weinheim, 2003 Search PubMed
.
- J. C. Williams and E. A. Starke, Progress in structural materials for aerospace systems, Acta Mater., 2003, 51, 5775–5799 CrossRef CAS
.
- J. C. Williams and R. R. Boyer, Opportunities and issues in the application of titanium alloys for aerospace components, Metals, 2020, 10, 705 CrossRef
.
- M. R. Bache, A review of dwell sensitive fatigue in titanium alloys: the role of microstructure, texture and operating conditions, Int. J. Fatigue, 2003, 25, 1079–1087 CrossRef CAS
.
- W. J. Evans and C. R. Gostelow, The effect of hold time on the fatigue properties of a β-processed titanium alloy, Metall. Trans. A, 1979, 10, 1837–1846 CrossRef
.
- D. Eylon and J. A. Hall, Fatigue behavior of beta processed titanium alloy IMI 685, Metall. Trans. A, 1977, 8, 981–990 CrossRef
.
- T. Goswami, Low cycle fatigue-dwell effects and damage mechanisms, Int. J. Fatigue, 1999, 21, 55–76 CrossRef CAS
.
- J. K. Qiu, Y. J. Ma, J. F. Lei, Y. Y. Liu, A. J. Huang, D. Rugg and R. Yang, A comparative study on dwell fatigue of Ti–6Al–2Sn–4Zr–xMo (x = 2 to 6) alloys on a microstructure-normalized basis, Metall. Mater. Trans. A, 2014, 45, 6075–6087 CrossRef CAS
.
- Z. C. Zhou, B. B. Jiang, J. K. Qiu, L. L. Zhang, J. F. Lei, R. Yang and K. Du, Phase interface-induced dwell fatigue cracks in titanium alloy with lamellar microstructure, Sci. China Mater., 2023, 66, 4267–4274 CrossRef CAS
.
- L. L. Zhang, B. B. Jiang, J. K. Qiu, X. M. Cao, J. F. Lei, R. Yang and K. Du, The interface effect on crack nucleation under dwell fatigue loading in dual-phase Ti alloy, Int. J. Plast., 2023, 171, 103816 CrossRef CAS
.
- S. Hémery, D. Bertheau and F. Hamon, Microtexture effects on fatigue and dwell-fatigue lifetimes of Ti–6Al–4V, Int. J. Fatigue, 2024, 179, 108068 CrossRef
.
- M. E. Kassner, Y. Kosaka and J. A. Hall, Low-cycle dwell-time fatigue in Ti-6242, Metall. Mater. Trans. A, 1999, 30, 2383–2389 CrossRef
.
- F. McBagonluri, E. Akpan, C. Mercer, W. Shen and W. O. Soboyejo, An investigation of the effects of microstructure on dwell fatigue crack growth in Ti-6242, Mater. Sci. Eng., A, 2005, 405, 111–134 CrossRef
.
- V. Sinha, J. E. Spowart, M. J. Mills and J. C. Williams, Observations on the faceted initiation site in the dwell-fatigue tested Ti-6242 alloy: Crystallographic orientation and size effects, Metall. Mater. Trans. A, 2006, 37, 1507–1518 CrossRef
.
- Y. L. Xu, S. Joseph, P. Karamched, K. Fox, D. Rugg, F. P. E. Dunne and D. Dye, Predicting dwell fatigue life in titanium alloys using modelling and experiment, Nat. Commun., 2020, 11, 5868 CrossRef CAS PubMed
.
- Z. B. Zheng, D. S. Balint and F. P. E. Dunne, Discrete dislocation and crystal plasticity analyses of load shedding in polycrystalline titanium alloys, Int. J. Plast., 2016, 87, 15–31 CrossRef CAS
.
- F. P. E. Dunne, A. Walker and D. Rugg, A systematic study of hcp crystal orientation and morphology effects in polycrystal deformation and fatigue, Proc. R. Soc. A, 2007, 463, 1467–1489 CrossRef CAS
.
- K. U. Yazar, S. Bahl, S. Mishra, V. K. Sahu, A. Bhattacharjee, D. Banerjee and S. Suwas, Microcrack formation under normal and dwell fatigue of IMI 834, Int. J. Fatigue, 2023, 175, 107724 CrossRef CAS
.
- S. Ghosh and P. Chakraborty, Microstructure and load sensitive fatigue crack nucleation in Ti-6242 using accelerated crystal plasticity FEM simulations, Int. J. Fatigue, 2013, 48, 231–246 CrossRef CAS
.
- L. N. Yang, J. R. Liu, J. Tan, Z. Y. Chen, Q. J. Wang and R. Yang, Dwell and normal cyclic fatigue behaviours of Ti60 alloy, J. Mater. Sci. Technol., 2014, 30, 706–709 CrossRef CAS
.
- S. Joseph, K. Joseph, T. C. Lindley and D. Dye, The role of dwell hold on the dislocation mechanisms of fatigue in a near alpha titanium alloy, Int. J. Plast., 2020, 131, 102743 CrossRef CAS
.
- K. Kirane and S. Ghosh, A cold dwell fatigue crack nucleation criterion for polycrystalline Ti-6242 using grain-level crystal plasticity FE Model, Int. J. Fatigue, 2008, 30, 2127–2139 CrossRef CAS
.
- C. P. Przybyla and D. L. McDowell, Simulated microstructure-sensitive extreme value probabilities for high cycle fatigue of duplex Ti–6Al–4V, Int. J. Plast., 2011, 27, 1871–1895 CrossRef CAS
.
- W. J. Evans and M. R. Bache, Dwell-sensitive fatigue under biaxial loads in the near-alpha titanium alloy IMI685, Int. J. Fatigue, 1994, 16, 443–452 CrossRef CAS
.
- A. N. Stroh, The formation of cracks as a result of plastic flow, Proc. R. Soc. London, Ser. A, 1954, 223, 404–414 Search PubMed
.
- P. K. Zhao, C. Wei, X. D. Xiao, Q. L. Chu, J. P. Niu, M. L. Guo, C. C. Zhang, S. J. Li and M. Zhang, Thermal deformation mechanism of TC11/TC17 linear friction welded joint during isothermal compression, Mater. Charact., 2021, 178, 111319 CrossRef CAS
.
- Y. L. Xu, A non-local methodology for geometrically necessary dislocations and application to crack tips, Int. J. Plast., 2021, 140, 102970 CrossRef
.
- J. F. Nye, Some geometrical relations in dislocated crystals, Acta Metall., 1953, 1, 153–162 CrossRef CAS
.
- W. Pantleon, Resolving the geometrically necessary dislocation content by conventional electron backscattering diffraction, Scr. Mater., 2008, 58, 994–997 CrossRef CAS
.
- C. Q. Sun, J. Sun, W. Q. Chi, J. X. Wang and W. J. Wang, A method of quasi in-situ EBSD observation for microstructure and damage evolution in fatigue and dwell fatigue of Ti alloys, Int. J. Fatigue, 2023, 176, 107897 CrossRef CAS
.
- S. Hémery and P. Villechaise, In situ EBSD investigation of deformation processes and strain partitioning in bi-modal Ti–6Al–4V using lattice rotations, Acta Mater., 2019, 171, 261–274 CrossRef
.
- M. F. Ashby, The deformation of plastically non-homogeneous materials, Philos. Mag., 1970, 21, 399–424 CrossRef CAS
.
- Y. L. Xu, W. F. Wan and F. P. E. Dunne, Microstructural fracture mechanics: Stored energy density at fatigue cracks, J. Mech. Phys. Solids, 2021, 146, 104209 CrossRef
.
- Y. Guilhem, S. Basseville, F. Curtit, J.-M. Stéphan and G. Cailletaud, Numerical investigations of the free surface effect in three-dimensional polycrystalline aggregates, Comput. Mater. Sci., 2013, 70, 150–162 CrossRef CAS
.
- P. V. Trusov and A. I. Shveykin, Multilevel crystal plasticity models of single- and polycrystals. Statistical models, Phys. Mesomech., 2013, 16, 23–33 CrossRef
.
- L. R. Zeng, L. Y. Wang, P. T. Hua, Z. P. He and G. P. Zhang, In-situ investigation of dwell fatigue damage mechanism of pure Ti using digital image correlation technique, Mater. Charact., 2021, 181, 111466 CrossRef CAS
.
- S. Joseph, I. Bantounas, T. C. Lindley and D. Dye, Slip transfer and deformation structures resulting from the low cycle fatigue of near-alpha titanium alloy Ti–6242Si, Int. J. Plast., 2018, 100, 90–103 CrossRef CAS
.
- Z. B. Zheng, D. S. Balint and F. P. E. Dunne, Investigation of slip transfer across HCP grain boundaries with application to cold dwell facet fatigue, Acta Mater., 2017, 127, 43–53 CrossRef CAS
.
- F. P. E. Dunne, D. Rugg and A. Walker, Lengthscale-dependent, elastically anisotropic, physically-based hcp crystal plasticity: Application to cold-dwell fatigue in Ti alloys, Int. J. Plast., 2007, 23, 1061–1083 CrossRef CAS
.
- A. J. Beaudoin, P. A. Shade, J. C. Schuren, T. J. Turner, C. Woodward, J. V. Bernier, S. F. Li, D. M. Dimiduk, P. Kenesei and J.-S. Park, Bright x-rays reveal shifting deformation states and effects of the microstructure on the plastic deformation of crystalline materials, Phys. Rev. B, 2017, 96, 174116 CrossRef
.
- F. F. Worsnop, R. E. Lim, J. V. Bernier, D. C. Pagan, Y. L. Xu, T. P. McAuliffe, D. Rugg and D. Dye, The influence of alloying on slip intermittency and the implications for dwell fatigue in titanium, Nat. Commun., 2022, 13, 5949 CrossRef PubMed
.
- Y. L. Xu, F. F. Worsnop, D. Dye and F. P. E. Dunne, Slip intermittency and dwell fatigue in titanium alloys: a discrete dislocation plasticity analysis, J. Mech. Phys. Solids, 2023, 179, 105384 CrossRef CAS
.
- M. S. Lee, Y. T. Hyun and T. S. Jun, Global and local strain rate sensitivity of commercially pure titanium, J. Alloys Compd., 2019, 803, 711–720 CrossRef CAS
.
- V. Hasija, S. Ghosh, M. J. Mills and D. S. Joseph, Deformation and creep modeling in polycrystalline Ti–6Al alloys, Acta Mater., 2003, 51, 4533–4549 CrossRef CAS
.
Footnote |
| † These authors contributed equally to this work. |
| This journal is © The Royal Society of Chemistry 2024 |

