Doping effect on a two-electron silver nanocluster†
Wei-Jung
Yen
a,
Jian-Hong
Liao
a,
Tzu-Hao
Chiu
a,
Jie-Ying
Chen
b,
Yuan Jang
Chen
b,
Samia
Kahlal
c,
Jean-Yves
Saillard
 *c and
C. W.
Liu
 *a
*a
aDepartment of Chemistry, National Dong Hwa University, Hualien 97401, Taiwan, Republic of China. E-mail: chenwei@gms.ndhu.edu.tw; Web: https://faculty.ndhu.edu.tw/~cwl/index.htm
bDepartment of Chemistry, Fu-Jen Catholic University, New Taipei City 24205, Taiwan, Republic of China
cUniv Rennes, CNRS, ISCR-UMR 6226, F-35000 Rennes, France. E-mail: jean-yves.saillard@univ-rennes.fr
First published on 5th March 2024
Abstract
This study investigates the effects of metal addition and doping of a 2-electron silver superatom, [Ag10{S2P(OiPr)2}8] (Ag10). When Ag+ is added to Ag10 in THF solution, [Ag11{S2P(OiPr)2}8(OTf)] (Ag11) is rapidly formed almost quantitatively. When the same method is used with Cu+, a mixture of alloys, [CuxAg11−x{S2P(OiPr)2}8]+ (x = 1–3, CuxAg11−x), is obtained. In contrast, introducing Au+ to Ag10 leads to decomposition. The structural and compositional analysis of Ag11 was characterized by single-crystal X-ray diffraction (SCXRD), ESI-MS, NMR spectroscopy, and DFT calculations. While no crystal structure was obtained for CuxAg11−x, DFT calculations provide insights into potential sites for copper location. The absorption spectrum exhibits a notable blue shift in the low-energy band after copper doping, contrasting with that of the slight shift observed in 8-electron Cu-doped Ag nanoclusters. Ag11 and CuxAg11−x are strongly emissive at room temperature, and solvatochromism across different organic solvents is highlighted. This study underscores the profound influence of metal addition and doping on the structural and optical properties of silver nanoclusters, providing important contributions to understanding the nanoclusters and their photophysical behaviors.
Introduction
Noble metal nanoclusters (NCs), predominantly composed of gold, silver, and copper, represent a novel and promising class of functional materials exhibiting numerous unique characteristics.1–19 These atomically precise NCs stand apart from nanoparticles, showcasing significant differences in various properties including electronic and absorption properties,1,2,5–8 photoluminescence,1,2,6–9 magnetism,10,11 catalytic activity,12–14 and biomedical applications.15,16 Recent studies have established that the intrinsic properties of a homometallic NC can be altered through the incorporation of heterometals, leading to improved properties.1,2,6,8,17–22 Contemporary research is now largely devoted to designing and tailoring the properties of NCs to suit particular applications in a predictable and manageable manner. Specifically, the stability and catalytic activity of Au NCs can be significantly enhanced by doping with Pt, Pd, Ag, Cu, or other foreign metal atoms.23–26 Furthermore, Au/Ag bimetallic NCs have been observed to display greater photoluminescence quantum yield (PLQY) when compared to homometallic Ag NCs.22,27 It is important to note that the field of NC chemistry still holds a plethora of uncharted potential properties that is yet to be explored and understood.Copper, as well as the other group 11 metals, possesses multiple coordination versatility and has attracted significant interest due to its outstanding efficacy in CO2 reduction.28,29 However, when incorporated as a dopant into NCs, Cu exhibits distinct influences on the structure and characteristics of the NCs, in contrast to the effects observed with Au or Ag atoms. In the case of Cu alloying, the Cu atoms tend to position themselves in the shell layer of the core–shell NCs.30–35 Zhu et al. reported bimetallic NCs, Au36−xCux(m-MBT)24 (x = 1–3),30 Au38−xCux(2,4-DMBT)24 (x = 0–6, DMBT = 2,4-dimethylbenzenethiolate),31 and [Ag62−xCuxS12(SBut)32]4+ (x = 10–21).32 Liu et al. reported bimetallic CuxAg20−x{S2P(OR)2}12 (x = 3, 4; R = iPr,19nPr33). These studies consistently demonstrated a marked tendency for Cu atoms to favor surface positions, displaying disordered arrangements across multiple sites instead of situating themselves within the core. This behavior can be attributed to the lower reduction potential of Cu+ (0.52 and 0.80 V for CuI/Cu0 and AgI/Ag0, respectively, vs. SHE, T = 25 °C, 1 atm), which hampers the anti-galvanic reaction (AGR) with the kernel Ag/Au atoms, making it challenging to proceed.36 Consequently, a metal exchange occurring at the surface M(I) atoms emerges as a more favorable process. To the best of our knowledge, the chemistry of 2-electron Ag/Cu superatomic alloys has never been explored. Kappes et al. reacted the 8-electron cluster [Ag29(BDT)12(PPh3)4]3− (BDT = 1,3 benzenedithiolate) with Cu12S6(DPPPT)4 (DPPPT = bis-(diphenylphosphino)pentane), yielding the alloys [Ag29−xCux(BDT)12]3− (x = 0–13).37 Although they could not obtain any crystal structures, they performed DFT calculations to determine the Cu locations in the alloy shells and found a preference for the outermost positions. Conversely, in the case of the 46-electron [Cu30Ag61(SAdm)38S3]+, the Cu atoms are found to be located within the interior of the NCs.38 This compound presents an onion-type structure, conceptualized as [Ag13@Cu30@Ag48(SAdm)38S3]+. Here, the Cu atoms are situated in the second inner shell, sandwiched between the Ag13 icosahedral core and the outermost Ag48(SAdm)38S3 shell. This distinct arrangement highlights the unique distribution of Cu atoms participating in the NC's architecture.
Following our previous research on the doping effect on 8-electron superatoms,16,33 we chose the 2-electron Ag NC [Ag10(dtp)8] (dtp = S2P(OiPr)2) (Ag10 for short)39 as the starting template. The subsequent addition of Ag(I) and Cu(I) ions yield [Ag11(dtp)8(SO3CF3)] (Ag11 for short) and [CuxAg11−x(dtp)8]+ (x = 0–3) (CuxAg11−x for short), respectively.
Results and discussion
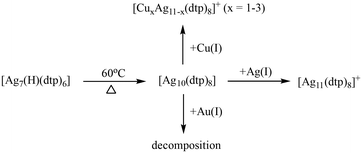
In the course of the synthesis (Scheme 1), Ag(OTf) was introduced into a THF solution of Ag10 with a 1![[thin space (1/6-em)]](https://www.rsc.org/images/entities/char_2009.gif) :
:![[thin space (1/6-em)]](https://www.rsc.org/images/entities/char_2009.gif) 1 molar ratio at ambient temperature. The reaction could be concluded within only one minute, resulting in the production of Ag11 with an impressive yield of up to 97%. This success attests to the viability of adding extra Ag(I) ions to Ag NCs, a strategy corroborated by previous research involving the transformation of [Ag7(H)L6] into [Ag8(H)L6]+ (L = dithiophosphate or diselenophosphate)40 and [Ag20{S2P(OiPr)2}12] into [Ag21{S2P(OiPr)2}12]+.41 Following the same reaction conditions as those for Ag11, the introduction of one equivalent of [Cu(CH3CN)4](OTf) facilitated the formation of CuxAg11−x. In contrast, the addition of Au(PPh3)Cl into Ag10 led to decomposition. Notably, Au-doped NCs, such as [Au1Ag22(S-Adm)12]3+ (8e),42 AuxAg50−x(Dppm)6(SR)30 (20e),43 and [Ag46Au24(SR)32]2+ (36e),44 exhibit enhanced thermal stability. Au atoms on the surface typically form an S–Au–S linear coordination with ligands.45 When the gold atom is located in the kernel, Au is singly bonded to the S atom,46 constraining the doping positions available. The challenge becomes pronounced in the Ag10 structure, where each Ag atom is bonded to two or three sulfur atoms. Au doping may alter the original coordination environment, resulting in an inability to maintain the structural framework.
1 molar ratio at ambient temperature. The reaction could be concluded within only one minute, resulting in the production of Ag11 with an impressive yield of up to 97%. This success attests to the viability of adding extra Ag(I) ions to Ag NCs, a strategy corroborated by previous research involving the transformation of [Ag7(H)L6] into [Ag8(H)L6]+ (L = dithiophosphate or diselenophosphate)40 and [Ag20{S2P(OiPr)2}12] into [Ag21{S2P(OiPr)2}12]+.41 Following the same reaction conditions as those for Ag11, the introduction of one equivalent of [Cu(CH3CN)4](OTf) facilitated the formation of CuxAg11−x. In contrast, the addition of Au(PPh3)Cl into Ag10 led to decomposition. Notably, Au-doped NCs, such as [Au1Ag22(S-Adm)12]3+ (8e),42 AuxAg50−x(Dppm)6(SR)30 (20e),43 and [Ag46Au24(SR)32]2+ (36e),44 exhibit enhanced thermal stability. Au atoms on the surface typically form an S–Au–S linear coordination with ligands.45 When the gold atom is located in the kernel, Au is singly bonded to the S atom,46 constraining the doping positions available. The challenge becomes pronounced in the Ag10 structure, where each Ag atom is bonded to two or three sulfur atoms. Au doping may alter the original coordination environment, resulting in an inability to maintain the structural framework.
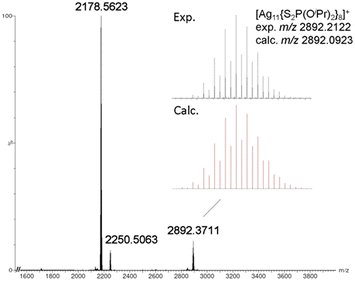
The positive-ion ESI-MS of Ag11 (Fig. 1) reveals a molecular ion peak at m/z 2892.2122 Da, aligning with its cationic counterpart [Ag11(dtp)8]+ (calc. 2892.0923 Da). The experimental isotopic distribution showcases a good agreement with the simulated pattern. A fragmentation peak at 2250.5063 Da was observed, which corresponds to [Ag9(dtp)6]+ (calc. 2250.2461 Da). A peak at 2178.5623 Da can be assigned to [Ag8(Cl)(dtp)6]+ (calc. 2178.3088 Da). It is postulated that such species could be formed during sample preparation in CH2Cl2 solution, prior to the mass spectrometry measurement. The ESI-MS of CuxAg11−x (Fig. 2a) reveals a distribution of [CuxAg11−x(dtp)8]+ (x = 0–3) with the Cu1Ag10 (x = 1) species assigned to the most intense band. Such a distribution was also observed in other Cu-doped Ag NCs, such as [CuxAg20−x(dtp)12] (R = iPr, x = 1–7; R = nPr, x = 0–5),19,33 [Ag29−xCux(BDT)12]3− (x = 0–13),37 and [Ag62−xCuxS12(SBut)32]+ (x = 10–21).32
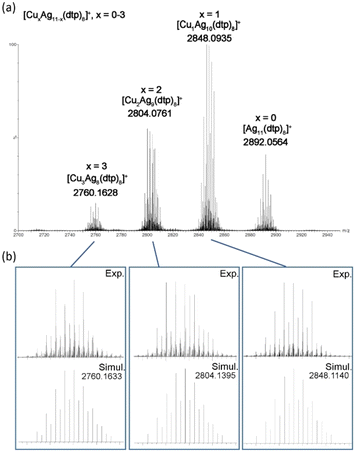 | ||
| Fig. 2 (a) The positive-ion ESI-MS of CuxAg11−x. (b) The experimental and simulated isotopic distribution patterns of CuxAg11−x (x = 1–3). | ||
The 31P{1H} NMR spectrum of Ag11 (Fig. S2†) shows two chemical shifts at 100.8 and 103.2 ppm, with an integration ratio of approximately 6![[thin space (1/6-em)]](https://www.rsc.org/images/entities/char_2009.gif) :
:![[thin space (1/6-em)]](https://www.rsc.org/images/entities/char_2009.gif) 2, which corresponds to the two coordination environments of the dtp ligands. These resonances are shifted to 104.5 and 105.4 ppm in Ag10. The 31P{1H} NMR spectrum (Fig. S4†) of CuxAg11−x shows multiple resonances spanning a broad range from 94 to 105 ppm, suggesting that the copper substitution within the Ag11 framework may occur at various positions, leading to a diversity of chemical environments.
2, which corresponds to the two coordination environments of the dtp ligands. These resonances are shifted to 104.5 and 105.4 ppm in Ag10. The 31P{1H} NMR spectrum (Fig. S4†) of CuxAg11−x shows multiple resonances spanning a broad range from 94 to 105 ppm, suggesting that the copper substitution within the Ag11 framework may occur at various positions, leading to a diversity of chemical environments.
In the molecular architecture of Ag10, a conspicuous vacant site can be identified within the shell (Fig. 3a), presenting itself as an ideal location for hosting an additional metal anion and creating locally an MS3 motif. The additional Ag+ ion is indeed attached to this precise location, in the crystal structure of Ag11. The metal skeleton in Ag11 is composed of a trigonal bipyramid with four capping (Agcap) and two external (Agext) atoms (Fig. 3b). With the addition of an extra silver atom, the metal framework attains higher symmetry, transitioning from C1 in Ag10 to C2v in Ag11. The average Ag⋯Ag distances within the yellow (2.8339(7) Å), green (2.8386(7) Å), and cyan (2.9778(7) Å) tetrahedra in Ag11 are similar to those in Ag10 (yellow: 2.8562(13) Å; green: 2.8553(13) Å, and cyan: 2.9495(13) Å). However, in Ag11, the two magenta tetrahedra exhibit substantially elongated Ag⋯Ag distances, averaged at 3.2191(8) Å and 3.3555(9) Å, which are notably longer than the 3.150(1) Å observed in Ag10. A weak interaction between the OTf anion and the Ag11 atom (O18–Ag11: 2.61(1) Å) results in a significant elongation between Agext and the triangular base it caps (Ag11 − Δ: 2.619 Å, Ag10 − Δ: 2.375 Å, see Fig. 3c). These bond lengths are summarized in Table S1.† The coordination modes of the eight dtp ligands in Ag11 vary: P6 and P8 exhibit an η3 (μ1, μ2) coordination pattern, while the other six ligands demonstrate η4 (μ2, μ2) pattern. This differentiation is reflected in the ambient-temperature 31P{1H} NMR spectrum, where two chemical shifts are observed. Consequently, these coordination differences contribute to the overall [Ag11(dtp)8]+ molecule possessing approximate C2 symmetry.
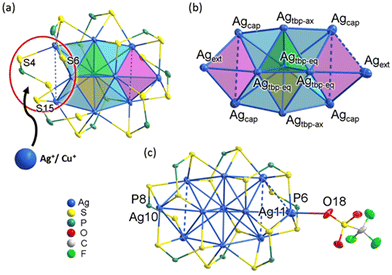 | ||
| Fig. 3 (a) The structure of Ag10. (b) The metal skeleton in Ag11. (c) The total structure of Ag11. The isopropoxy groups were omitted for clarity. | ||
Despite our inability to determine the crystal structures of CuxAg11−x directly, ESI-MS data indicate that the species with the highest intensity is Cu1Ag10. This observation leads us to hypothesize that the doping copper atom predominantly occupies the NC's outermost fringe (i.e. Agext, see Fig. 3a), and the geometry of Cu1Ag10 closely resembles the core skeleton of [CuxAg10−x(Se)(dsep)8] (x = 3–4, dsep = Se2P(OiPr)2, see Fig. S6†).47 Moreover, in scenarios where additional copper substitution would occur, it is likely that these copper atoms would prefer being situated at the other Agext or Agcap positions (Fig. S7†). To substantiate this hypothesis, we employed DFT calculations, wherein 1, 2 and 3 Cu atoms were systematically substituted in the original Ag11 structure (vide infra).
The absorption spectrum of Ag11 exhibits two prominent bands at 390 and 528 nm (Fig. 4a). The high-energy band at approximately 366 nm is barely seen, embedded in the shoulder. This pattern shows similarity to that of the previously reported Ag10, which exhibits bands at 348, 392, and 520 nm.39 In the case of the copper-doped CuxAg11−x NC, a noticeable blue shift of the low-energy band, moving to 506 nm, while the high-energy band at 392 nm remains relatively unchanged. This behavior contrasts with that of the previously investigated 8-electron NCs,19,33 where Cu doping did not markedly alter the three primary absorption bands. Notably, the low-energy band around 480 nm remains consistent between the [Cu4Ag17(dtp)12]+ and [Ag21(dtp)12]+ structures.19 This could be attributed to the larger core structure of the NC, which likely positions the surface-integrated copper atoms at a greater distance from the core, thereby minimizing their influence on the absorption characteristics.
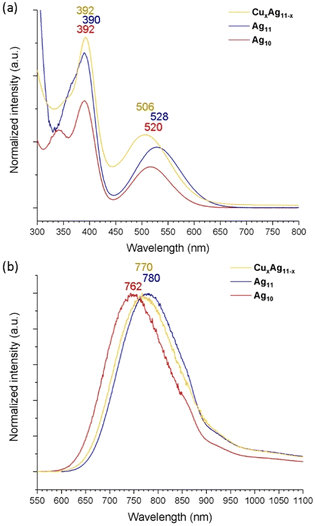 | ||
| Fig. 4 (a) The ambient-temperature UV-vis absorption spectra and (b) emission spectra of Ag10, Ag11 and CuxAg11−x. | ||
The time-dependent-DFT (TD-DFT) simulated UV-vis spectra of Ag11 and of the most stable isomer of CuxAg11−x (x = 1–3) (see the Computational details section) are shown in Fig. S8.† They exhibit the same shape as their experimental counterparts (vide supra). For all the compounds, the band of lowest energy can be identified as the HOMO (1S) → LUMO (1Px) transition, whereas the high-energy band is of mixed HOMO (1S) → LUMO+1 (1Pz) and ligand → LUMO (1Px) character (see the 1S2 1P0 electronic structure DFT analysis), with little Cu participation in these two bands in the case of the CuxAg11−x alloys. In the case of Ag11, the two simulated peaks appear at 559 and 384 nm, values which compare relatively well with their experimental counterparts, 528 and 390 nm, respectively. In the case of the CuxAg11−x alloys, the high-energy band is barely perturbed, while the low-energy band is more blue-shifted as the number of copper atoms increases. This trend matches well with the experimental spectra (vide supra). The blue shift of the low-energy band is related to the increase of the 1S → 1Px gap (mainly a LUMO destabilization) with the increase in the number of Cu atoms in the NC. On the other hand, the 1S → 1Pz transition participates to a lesser extent in the high-energy band and, having less Cu character, it is also less sensitive to the Cu content, explaining the inertness of this band to Cu alloying.
The room-temperature emission spectrum (Fig. 4b) exhibits a red shift in peak wavelength from 762 nm for Ag10 to 780 nm for Ag11, marking a transition to the near-infrared (NIR) region upon metal addition, while copper doping to form CuxAg11−x results in the emission maxima shifting from 762 nm to 770 nm, a slight blue shift compared with Ag11, which correlates well to the observed blue shift in the low-energy absorption band. This movement toward NIR emission in these NCs is advantageous for bioimaging applications due to deeper tissue penetration capabilities and minimized photodamage.15,16,48 On the other hand, Ag11 exhibits an enhanced QY of 14.6%, a significant increase from the 6.0% observed in Ag10. The enhancement can be caused by the increased nuclearity in Ag11, which effectively stabilizes the surface ligand, thereby reinforcing its rigidity in solution. However, the QY decreases to 7.8% in CuxAg11−x compared to Ag11. This reduction may be due to intercluster reactions occurring within the solution, where copper atoms are exchanged between NCs. This phenomenon is akin to the observed intercluster reactions in Ag7(H)(dtp)6 and Cu7(H)(dtp)6, leading to a similar exchange of copper atoms.49 Furthermore, the PLQY experiences a notable enhancement in the film state, reaching 37.2% for Ag11 and 16.1% for CuxAg11−x (Table S3†). The lifetimes of Ag11 and CuxAg11−x are in the nanosecond range, with 5.37 and 6.33 ns at RT (Fig. S11 and S13†), and 15.43 and 13.69 ns at 77K (Fig. S12 and S14†). The photophysical data are summarized in Table 1. Overall, the result suggests the resilience of superatomic electronic properties, which demonstrates the fine-tuning property following its metal addition or the Cu doping in the ultrasmall NCs.
| Comp. | State | Absorbance λabs (nm), ε (M−1 cm−1) | Excitation λex (nm) | Emission λem (nm) | Lifetime τ (ns) | Quantum yield, Φa (%) |
k
r![[thin space (1/6-em)]](https://www.rsc.org/images/entities/char_2009.gif) (s−1)
(s−1) |
k
nr![[thin space (1/6-em)]](https://www.rsc.org/images/entities/char_2009.gif) (s−1)
(s−1) |
|---|---|---|---|---|---|---|---|---|
| a Radiative rate constant, kr = Φa × (1/τ). b Nonradiative rate constant, knr = (1/τ) − kr. | ||||||||
| Ag10 | 2-MeTHF, 298 K | 348 (15![[thin space (1/6-em)]](https://www.rsc.org/images/entities/char_2009.gif) 500), 392 (21 500), 392 (21![[thin space (1/6-em)]](https://www.rsc.org/images/entities/char_2009.gif) 300), 520 (8100) 300), 520 (8100) |
338, 395, 517 | 762 | 1.95 | 6.0 | 3.08 × 10⁷ | 4.82 × 10⁸ |
| 2-MeTHF, 77 K | 335, 388, 515 | 687 | 15.37 | |||||
| Ag11 | 2-MeTHF, 298 K | 390 (20![[thin space (1/6-em)]](https://www.rsc.org/images/entities/char_2009.gif) 600), 528 (9000) 600), 528 (9000) |
391, 530 | 780 | 5.37 | 14.6 | 2.72 × 10⁷ | 1.84 × 10⁸ |
| 2-MeTHF, 77 K | 396, 509 | 699 | 15.43 | |||||
| CuxAg11−-x | 2-MeTHF, 298 K | 392(20![[thin space (1/6-em)]](https://www.rsc.org/images/entities/char_2009.gif) 100), 506(8800) 100), 506(8800) |
391, 527 | 770 | 6.33 | 7.8 | 1.23 × 10⁷ | 1.46 × 10⁸ |
| 2-MeTHF, 77 K | 393, 507 | 687 | 13.69 | |||||
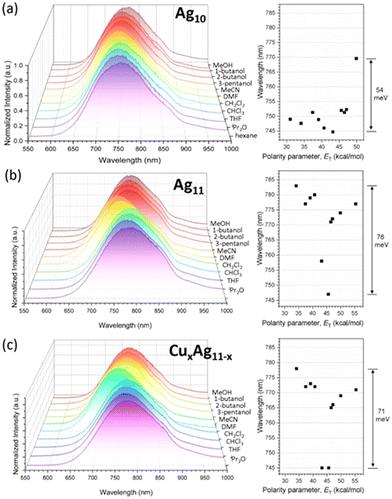
Structural insights reveal that in Ag11, the OTf anion exhibits a weak interaction with the Agext site, and the AgextS3 motif is nearly coplanar, suggesting that Agext could readily interact with solvent molecules. The solvatochromic behavior of Ag10, Ag11, and CuxAg11−x shows a more pronounced shift upon solvent polarity for Ag11 (76 meV) and CuxAg11−x (71 meV) compared to Ag10 (54 meV) (Fig. 5). The emission shifts from negative to positive solvatochromism with increasing solvent polarity. The polarity of solvents is quantified using the polarity parameter (ET), which is defined by the molar transition energy (measured in kcal mol−1).50 This heightened sensitivity in Ag11, and CuxAg11−x may be attributed to their structural configuration, which features a higher number of accessible Agext/Cuext sites. These sites are proximal to the superatomic core, where the emission is primarily due to the 1Px → 1S transition. Thus, solvent molecules have a significant impact on these NCs by affecting the proximity of Agext/Cuext sites to the superatomic core, leading to the observed substantial solvatochromic effect in Ag11, and CuxAg11−x.
DFT calculations (see the Computational details section) were first performed on the homometallic Ag11 cluster, whose optimized geometry (Table 2) is in good agreement with its SCXRD structure (Table S1†). Whereas the metal framework in this optimized geometry approaches C2v symmetry, that of the whole NC (ligand considered) is very close to C2, with the pseudo-C2 axis collinear with the (Agtbp-aq)3 diagonal that is perpendicular to the plane of Fig. 3b. Accordingly, there are two (slightly) different couples of Agcap atoms, namely Agacap and Agbcap.
| Distance (Å) | WBI | NAO charges | ||
|---|---|---|---|---|
| Agtbp-eq–Agtbp-eq | 2.868 | 0.185 | Agtbp-eq | 0.27 |
| Agtbp-ax–Agtbp-eq | 2.923 | 0.093 | Agtbp-ax | 0.61 |
| Aga,bcap–Agtbp-ax | 2.951 | 0.050 | Agacap | 0.69 |
| Aga,bcap–Agtbp-eq | 3.006 | 0.063 | Agbcap | 0.68 |
| Agext–Aga,bcap | 3.175 | 0.028 | Agext | 0.75 |
| Agext–Agtbp-eq | 2.867 | 0.045 |
The electronic structure of Ag11 is strongly related to that of its Ag10 precursor. Its Kohn–Sham orbital diagram is shown in Fig. 6. The HOMO can be identified as the 1S superatomic orbital, with some ligand admixture. Its principal metal contribution is from the central trigonal bipyramid, with major participation of the equatorial triangle (Agtbp-eq)3. Both NAO atomic charges and Wiberg bond indices (Table 2) indicate clearly that the Agcap and Agext atoms do not share any significant part of the two superatomic electrons and can be considered as being in their +I oxidation state. The two LUMOs can be identified as the superatomic 1Px and 1Pz orbitals, with some ligand admixture.
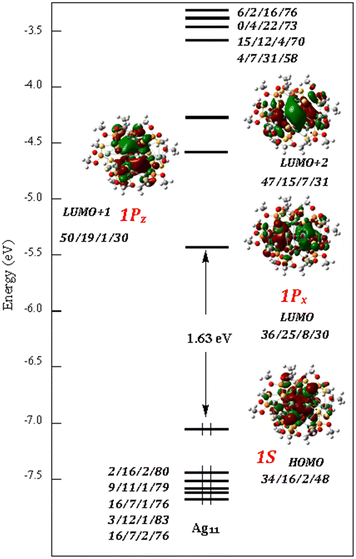 | ||
| Fig. 6 The Kohn–Sham orbital diagram of Ag11. The orbital contribution (in %) is given in the order: (Agtbp-)5/(Aga,bcap)4/(Agext)2/(dtp)8. | ||
In the second step, we investigated the preferred sites of substitution of Ag by Cu in Ag11. The main results are summarized in Fig. 7. Based on the computed relative free energies at 298 K, the doping by one Cu atom is almost equally preferred on the Mext and Macap positions, which corresponds to those with the more positive charges in Ag11 (Table 2). Those with the less positive charges in Ag11, namely the Mtbp-eq positions, are the less favored positions. This site preference is maintained when doping with two and three Cu atoms, as shown in the middle and bottom of Fig. 7, which shows the positional isomers of lowest energy for the Cu2Ag9 and Cu3Ag8 compositions, respectively. A mixture of three isomers is expected in the case of Cu2Ag9, whereas only one is expected to be obtained (or at least as a largely dominant species) in the case of the trisubstituted Cu3Ag8.
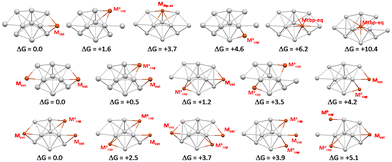 | ||
| Fig. 7 The six positional isomers of CuAg10 (top) and the lowest energy positional isomers of Cu2Ag9 (middle) and Cu3Ag8 (bottom). The relative free energies at 298 K are given in kcal mol−1. | ||
Conclusions
In summary, this investigation delves into the intricacies of metal addition and doping effects, utilizing a 2-electron Ag10 NC as a foundational template. The surficial traits of Ag10 uncover an open vacancy that facilitates the attachment of additional Ag+/Cu+ ions, resulting in the formation of Ag11 and CuxAg11−x. Significantly, the solvent-dependent emission spectra shed light on the intricate interplay between the structural characteristics and the potent impact of solvent polarity, offering a window into the solvatochromic behaviors of these materials. Furthermore, the emission of these NCs extends into the near-infrared (NIR) region, which opens up potential applications in areas such as bioimaging and photothermal therapy. These insights underscore the robust nature of superatomic electronic properties, demonstrating their capacity for fine-tuning properties through controlled metal addition and doping, further expanding the functional versatility of metal NCs.Experimental section
Materials and instrumentation
All chemicals used as received were purchased from commercial sources. Solvents were purified following standard protocols.51 All reactions were performed in oven-dried Schlenk glassware using standard inert atmosphere techniques. All reactions were carried out under an N2 atmosphere by using standard Schlenk techniques. Ag10(dtp)8![[thin space (1/6-em)]](https://www.rsc.org/images/entities/char_2009.gif) 39 and Au(PPh3)Cl52 were prepared by procedures reported earlier in the literature. The 1H and 31P{1H} NMR spectra were recorded on a Bruker Avance II 400 MHz NMR spectrometer, operating at 400.13 MHz for 1H, and 161.98 MHz for 31P. The chemical shifts (δ) and coupling constants (J) are reported in ppm and Hz, respectively. The ESI mass spectrum was recorded on a QSTAR® XL (AB SCIEX, Warrington, Cheshire, U.K.). X-ray photoelectron spectroscopy (XPS) spectra were recorded by using a PHI 5000 VersaProbe-Scanning ESCA Microprobe. UV-visible absorption spectra were recorded on an Agilent Cary 60 spectrophotometer using quartz cells with path length of 1 cm. The emission and QY spectra were recorded on a Horiba FluoroMax+ fluorescence spectrometer equipped with a 150 W ozone free xenon lamp as the excited source, a detector with R13456P PMT, and NIR InGaAs. The lifetime was recorded on an Edinburgh FLS920 fluorescence spectrometer using the TCPSC technique, using an H2 pulse lamp as the excited source and R928P as the detector. The QY was determined by a comparative method,53,54 and the detailed results of the target complexes are shown in Table S3.† Absolute values are calculated by using [Ru(bpy)3]2+ as the standard sample.55,56
39 and Au(PPh3)Cl52 were prepared by procedures reported earlier in the literature. The 1H and 31P{1H} NMR spectra were recorded on a Bruker Avance II 400 MHz NMR spectrometer, operating at 400.13 MHz for 1H, and 161.98 MHz for 31P. The chemical shifts (δ) and coupling constants (J) are reported in ppm and Hz, respectively. The ESI mass spectrum was recorded on a QSTAR® XL (AB SCIEX, Warrington, Cheshire, U.K.). X-ray photoelectron spectroscopy (XPS) spectra were recorded by using a PHI 5000 VersaProbe-Scanning ESCA Microprobe. UV-visible absorption spectra were recorded on an Agilent Cary 60 spectrophotometer using quartz cells with path length of 1 cm. The emission and QY spectra were recorded on a Horiba FluoroMax+ fluorescence spectrometer equipped with a 150 W ozone free xenon lamp as the excited source, a detector with R13456P PMT, and NIR InGaAs. The lifetime was recorded on an Edinburgh FLS920 fluorescence spectrometer using the TCPSC technique, using an H2 pulse lamp as the excited source and R928P as the detector. The QY was determined by a comparative method,53,54 and the detailed results of the target complexes are shown in Table S3.† Absolute values are calculated by using [Ru(bpy)3]2+ as the standard sample.55,56
Synthesis
![[thin space (1/6-em)]](https://www.rsc.org/images/entities/char_2009.gif) 600), 527 (9900).
600), 527 (9900).
![[thin space (1/6-em)]](https://www.rsc.org/images/entities/char_2009.gif) 100), 506 (8800).
100), 506 (8800).
X-ray crystallography
Single crystals suitable for X-ray diffraction analysis of Ag11 were obtained by the slow evaporation of CH2Cl2 solution at ambient temperature. Single crystals were mounted on the tip of a glass fiber with Paratone oil. Data were collected on a Bruker APEX II CCD diffractometer using graphite monochromated Mo Kα radiation (λ = 0.71073 A) at 100 K. Absorption corrections for the area detector were performed with SADABS,57 and the integration of the raw data frame was performed with SAINT.58 The structures were solved by direct methods and refined by least-squares against F2 using the SHELXL-2018/3 package,59 incorporated in SHELXTL/PC V6.14.60 All non-hydrogen atoms were refined anisotropically. CCDC no. 2287343† (Ag11) contains the supplementary crystallographic data in this article.Computational details
For the sake of reducing computational effort, all calculations were made on simplified models in which the S2P(OiPr)2 ligands were replaced by the smaller S2P(OMe)2 ones. Geometry optimizations were performed by density functional theory (DFT) calculations with the Gaussian 16 package,61 using the BP86 functional62 together with Grimme's empirical DFT-D3(BJ) corrections63 and the Def2-TZVP basis set from EMSL Basis Set Exchange Library.64 All the optimized geometries were characterized as true minima by vibrational analysis. The NAO charges and Wiberg bond indices were computed with the NBO 6.0 program.65 The UV-visible transitions were calculated by means of time-dependent DFT (TD-DFT) calculations, using the B3LYP66 functional and the Def2-TZVP basis set. The UV-visible spectra were simulated from the computed TD-DFT transitions and their oscillator strengths by using the SWizard program,67 with each transition being associated with a Gaussian function of half-height width equal to 2000 cm−1. The compositions of the molecular orbitals were calculated using the AOMix program.68Conflicts of interest
There are no conflicts to declare.Acknowledgements
This work was supported by the National Science and Technology Council of Taiwan (112-2123-M-259-001) and the GENCI Computing Resource (grant A0090807367). The authors gratefully acknowledge the Instrumentation Center of National Taiwan Normal University (NSTC 111-2731-M-003-001) for its support.References
- A. V. Artem'ev and C. W. Liu, Chem. Commun., 2023, 59, 7182–7195 RSC.
- Y. Li and R. Jin, Nanoscale Horiz., 2023, 8, 991–1013 RSC.
- M. F. Matus and H. Häkkinen, Nat. Rev. Mater., 2023, 8, 372–389 CrossRef CAS.
- J. Wei, D. M. Carey, J.-F. Halet, S. Kahlal, J.-Y. Saillard and A. Muñoz-Castro, Inorg. Chem., 2023, 62, 3047–3055 CrossRef CAS PubMed.
- R. Antoine, M. Broyer and P. Dugourd, Sci. Technol. Adv. Mater., 2023, 24, 2222546 CrossRef PubMed.
- I. Chakraborty and T. Pradeep, Chem. Rev., 2017, 117, 8208–8271 CrossRef CAS PubMed.
- T. Chen, H. Lin, Y. Cao, Q. Yao and J. Xie, Adv. Mater., 2022, 34, 2103918 CrossRef CAS PubMed.
- X. Kang and M. Zhu, Chem. Soc. Rev., 2019, 48, 2422–2457 RSC.
- H. Li, X. Kang and M. Zhu, ChemPhysChem, 2022, 23, e202200484 CrossRef CAS PubMed.
- K. S. Krishna, P. Tarakeshwar, V. Mujica and C. S. S. R. Kumar, Small, 2014, 10, 907–911 CrossRef CAS PubMed.
- M. Zhu, C. M. Aikens, M. P. Hendrich, R. Gupta, H. Qian, G. C. Schatz and R. Jin, J. Am. Chem. Soc., 2009, 131, 2490–2492 CrossRef CAS PubMed.
- S. Biswas, S. Das and Y. Negishi, Nanoscale Horiz., 2023, 8, 1509–1522 RSC.
- Y.-M. Li, J. Hu and M. Zhu, Coord. Chem. Rev., 2023, 495, 215364 CrossRef CAS.
- Y. Du, H. Sheng, D. Astruc and M. Zhu, Chem. Rev., 2020, 120, 526–622 CrossRef CAS PubMed.
- G. Yang, Z. Wang, F. Du, F. Jiang, X. Yuan and J. Y. Ying, J. Am. Chem. Soc., 2023, 145, 11879–11898 CrossRef CAS PubMed.
- Y. Su, T. Xue, Y. Liu, J. Qi, R. Jin and Z. Lin, Nano Res., 2019, 12, 1251–1265 CrossRef CAS.
- Y. Li, M. J. Cowan, M. Zhou, M. G. Taylor, H. Wang, Y. Song, G. Mpourmpakis and R. Jin, ACS Nano, 2020, 14, 6599–6606 CrossRef CAS PubMed.
- M. S. Bootharaju, C. W. Lee, G. Deng, H. Kim, K. Lee, S. Lee, H. Chang, S. Lee, Y.-E. Sung, J. S. Yoo, N. Zheng and T. Hyeon, Adv. Mater., 2023, 35, 2207765 CrossRef CAS PubMed.
- Y.-J. Zhong, J.-H. Liao, T.-H. Chiu, F. Gam, S. Kahlal, J.-Y. Saillard and C. W. Liu, J. Chem. Phys., 2021, 155, 034304 CrossRef CAS PubMed.
- S. Lee, M. S. Bootharaju, G. Deng, S. Malola, H. Häkkinen, N. Zheng and T. Hyeon, J. Am. Chem. Soc., 2021, 143, 12100–12107 CrossRef CAS PubMed.
- R. P. B. Silalahi, K. K. Chakrahari, J.-H. Liao, S. Kahlal, Y.-C. Liu, M.-H. Chiang, J.-Y. Saillard and C. W. Liu, Chem. – Asian J., 2018, 13, 500–504 CrossRef CAS PubMed.
- G. Soldan, M. A. Aljuhani, M. S. Bootharaju, L. G. AbdulHalim, M. R. Parida, A.-H. Emwas, O. F. Mohammed and O. M. Bakr, Angew. Chem., Int. Ed., 2016, 55, 5749–5753 CrossRef CAS PubMed.
- X. Liu, E. Wang, M. Zhou, Y. Wan, Y. Zhang, H. Liu, Y. Zhao, J. Li, Y. Gao and Y. Zhu, Angew. Chem., Int. Ed., 2022, 61, e202207685 CrossRef CAS PubMed.
- Y. Niihori, W. Kurashige, M. Matsuzaki and Y. Negishi, Nanoscale, 2013, 5, 508–512 RSC.
- S. Yang, J. Chai, Y. Song, J. Fan, T. Chen, S. Wang, H. Yu, X. Li and M. Zhu, J. Am. Chem. Soc., 2017, 139, 5668–5671 CrossRef CAS PubMed.
- F. Fetzer, C. Schrenk, N. Pollard, A. Adeagbo, A. Z. Clayborne and A. Schnepf, Chem. Commun., 2021, 57, 3551–3554 RSC.
- Y.-R. Lin, P. V. V. N. Kishore, J.-H. Liao, S. Kahlal, Y.-C. Liu, M.-H. Chiang, J.-Y. Saillard and C. W. Liu, Nanoscale, 2018, 10, 6855–6860 RSC.
- Q. Tang, Y. Lee, D.-Y. Li, W. Choi, C. W. Liu, D. Lee and D.-e. Jiang, J. Am. Chem. Soc., 2017, 139, 9728–9736 CrossRef CAS PubMed.
- W. Rong, H. Zou, W. Zang, S. Xi, S. Wei, B. Long, J. Hu, Y. Ji and L. Duan, Angew. Chem., Int. Ed., 2021, 60, 466–472 CrossRef CAS PubMed.
- B. Rao, T. Zhao, S. Yang, J. Chai, Y. Pan, S. Weng, H. Yu, X. Li and M. Zhu, Dalton Trans., 2018, 47, 475–480 RSC.
- J. Chai, Y. Lv, S. Yang, Y. Song, X. Zan, Q. Li, H. Yu, M. Wu and M. Zhu, J. Phys. Chem. C, 2017, 121, 21665–21669 CrossRef CAS.
- J. Zhou, S. Yang, Y. Tan, H. Cheng, J. Chai and M. Zhu, Chem. – Asian J., 2021, 16, 2973–2977 CrossRef CAS PubMed.
- W.-J. Yen, J.-H. Liao, T.-H. Chiu, Y.-S. Wen and C. W. Liu, Inorg. Chem., 2022, 61, 6695–6700 CrossRef CAS PubMed.
- L. Tang, Q. Han, B. Wang, Z. Yang, C. Song, G. Feng and S. Wang, Phys. Chem. Chem. Phys., 2024, 26, 62–66 RSC.
- F. Gam, I. Chantrenne, S. Kahlal, T.-H. Chiu, J.-H. Liao, C. W. Liu and J.-Y. Saillard, Nanoscale, 2022, 14, 196–203 RSC.
- Z. Gan, N. Xia and Z. Wu, Acc. Chem. Res., 2018, 51, 2774–2783 CrossRef CAS PubMed.
- A. Baksi, E. K. Schneider, P. Weis, I. Chakraborty, O. Fuhr, S. Lebedkin, W. J. Parak and M. M. Kappes, ACS Nano, 2020, 14, 15064–15070 CrossRef CAS PubMed.
- X. Zou, Y. Li, S. Jin, X. Kang, X. Wei, S. Wang, X. Meng and M. Zhu, J. Phys. Chem. Lett., 2020, 11, 2272–2276 CrossRef CAS PubMed.
- Y.-J. Zhong, J.-H. Liao, T.-H. Chiu, S. Kahlal, C.-J. Lin, J.-Y. Saillard and C. W. Liu, Angew. Chem., Int. Ed., 2021, 60, 12712–12716 CrossRef CAS PubMed.
- C. W. Liu, Y.-R. Lin and C.-S. Fang, Inorg. Chem., 2013, 52, 2070–2077 CrossRef CAS PubMed.
- R. S. Dhayal, Y.-R. Lin, J.-H. Liao, Y.-J. Chen, Y.-C. Liu, M.-H. Chiang, S. Kahlal, J.-Y. Saillard and C. W. Liu, Chem. – Eur. J., 2016, 22, 9943–9947 CrossRef CAS PubMed.
- S. Chen, W. Du, C. Qin, D. Liu, L. Tang, Y. Liu, S. Wang and M. Zhu, Angew. Chem., Int. Ed., 2020, 59, 7542–7547 CrossRef CAS PubMed.
- W. Du, S. Jin, L. Xiong, M. Chen, J. Zhang, X. Zou, Y. Pei, S. Wang and M. Zhu, J. Am. Chem. Soc., 2016, 139, 1618–1624 CrossRef PubMed.
- S. Wang, S. Jin, S. Yang, S. Chen, Y. Song, J. Zhang and M. Zhu, Sci. Adv., 2015, 1, e1500441 CrossRef PubMed.
- M. Zhu, C. M. Aikens, F. J. Hollander, G. C. Schartz and R. Jin, J. Am. Chem. Soc., 2008, 130, 5883–5885 CrossRef CAS PubMed.
- W.-T. Chang, S. Sharma, J.-H. Liao, S. Kahlal, Y.-C. Liu, M.-H. Chiang, J.-Y. Saillard and C. W. Liu, Chem. – Eur. J., 2018, 24, 14352–14357 CrossRef CAS PubMed.
- Y.-J. Zhong, J.-H. Liao, T.-H. Chiu, Y.-S. Wen and C. W. Liu, Molecules, 2021, 26, 5391 CrossRef CAS PubMed.
- P. Reineck and B. C. Gibson, Adv. Opt. Mater., 2017, 5, 1600446 CrossRef.
- Y.-J. Zhong, J.-H. Liao, T.-H. Chiu, Y.-Y. Wu, S. Kahlal, M. J. McGlinchy, J.-Y. Saillard and C. W. Liu, Dalton Trans., 2021, 50, 4727–4734 RSC.
- C. Reichardt, Chem. Rev., 1994, 94, 2319–2358 CrossRef CAS.
- D. D. Perrin and W. L. F. Armarego, Purification of laboratory chemicals, 3rd ed., Pergamon Press, Oxford, 1988 Search PubMed.
- M. I. Bruce, B. K. Nicholson, O. B. Shawkataly, J. R. Shapley and T. Henly, Inorg. Synth., 1989, 26, 324–328 CrossRef CAS.
- J. N. Demas and G. A. Crosby, J. Am. Chem. Soc., 1970, 92, 7262–7270 CrossRef.
- J. N. Demas and G. A. Crosby, J. Am. Chem. Soc., 1971, 93, 2841–2847 CrossRef.
- M. J. Cook, A. P. Lewis, G. S. G. McAuliffe, V. Skarda, A. J. Thomson, J. L. Glasper and D. J. Robbins, J. Chem. Soc., Perkin Trans. 2, 1984, 1293–1301 RSC.
- K. Suzuki, A. Kobayashi, S. Kaneko, K. Takehira, T. Yoshihara, H. Ishida, Y. Shiina, S. Oishi and S. Tobita, Phys. Chem. Chem. Phys., 2009, 11, 9850–9860 RSC.
- SADABS version 2014–11.0, Bruker Area Detector Absorption Corrections, Bruker AXS, Inc., Madison, WI, 2014 Search PubMed.
- SAINT V8.30A, Software for the CCD Detector System, Bruker Analytical, Madison, WI, 2012 Search PubMed.
- G. M. Sheldrick, Acta Crystallogr., Sect. A: Found. Crystallogr., 2008, 64, 112 CrossRef CAS PubMed.
- SHELXTL Version 6.14, Bruker AXS, Inc., Madison, WI, 2003 Search PubMed.
- M. J. Frisch, G. W. Trucks, H. B. Schlegel, G. E. Scuseria, M. A. Robb, J. R. Cheeseman, G. Scalmani, V. Barone, G. A. Petersson, H. Nakatsuji, X. Li, M. Caricato, A. V. Marenich, J. Bloino, B. G. Janesko, R. Gomperts, B. Mennucci, H. P. Hratchian, J. V. Ortiz, A. F. Izmaylov, J. L. Sonnenberg, D. Williams-Young, F. Ding, F. Lipparini, F. Egidi, J. Goings, B. Peng, A. Petrone, T. Henderson, D. Ranasinghe, V. G. Zakrzewski, J. Gao, N. Rega, G. Zheng, W. Liang, M. Hada, M. Ehara, K. Toyota, R. Fukuda, J. Hasegawa, M. Ishida, T. Nakajima, Y. Honda, O. Kitao, H. Nakai, T. Vreven, K. Throssell, J. A. Montgomery, Jr., J. E. Peralta, F. Ogliaro, M. J. Bearpark, J. J. Heyd, E. N. Brothers, K. N. Kudin, V. N. Staroverov, T. A. Keith, R. Kobayashi, J. Normand, K. Raghavachari, A. P. Rendell, J. C. Burant, S. S. Iyengar, J. Tomasi, M. Cossi, J. M. Millam, M. Klene, C. Adamo, R. Cammi, J. W. Ochterski, R. L. Martin, K. Morokuma, O. Farkas, J. B. Foresman and D. J. Fox, Gaussian 16, Revision B.01, Gaussian, Inc., Wallingford CT, 2016 Search PubMed.
- (a) A. D. Becke, Phys. Rev. A: At., Mol., Opt. Phys., 1988, 38, 3098–3100 CrossRef CAS PubMed; (b) J. P. Perdew, Phys. Rev. B: Condens. Matter Mater. Phys., 1986, 33, 8822–8824 CrossRef PubMed.
- S. J. Gimme, Comput. Chem., 2006, 27, 1787–1799 CrossRef PubMed.
- (a) A. Schaefer, H. Horn and R. Ahlrichs, J. Chem. Phys., 1992, 97, 2571–2577 CrossRef CAS; (b) A. Schaefer, C. Huber and R. Ahlrichs, J. Chem. Phys., 1994, 100, 5829–5835 CrossRef CAS.
- (a) E. D. Glendening, C. R. Landis and F. Weinhold, NBO 6.0: Natural bond orbital analysis program, J. Comput. Chem., 2013, 34, 1429–1437 CrossRef CAS PubMed; (b) E. D. Glendening, J. K. Badenhoop, A. E. Reed, J. E. Carpenter, J. A. Bohmann, C. M. Morales, C. R. Landis and F. Weinhold, NBO 6.0, Theoretical Chemistry Institute, University of Wisconsin, Madison, WI, 2013, https://nbo6.chem.wisc.edu Search PubMed.
- (a) A. D. Becke, J. Chem. Phys., 1993, 98, 5648–5652 CrossRef CAS; (b) C. Lee, W. Yang and R. G. Parr, Phys. Rev. B: Condens. Matter Mater. Phys., 1988, 37, 785–789 CrossRef CAS PubMed; (c) P. J. Stephens, F. J. Devlin, C. F. Chabalowski and M. J. Frisch, J. Phys. Chem., 1994, 98, 11623–11627 CrossRef CAS.
- S. I. Gorelsky, SWizard program, revision 4.5, https://www.sg-chem.net Search PubMed.
- S. I. Gorelsky, AOMix program, https://www.sg-chem.net Search PubMed.
Footnote |
| † Electronic supplementary information (ESI) available: NMR spectrum, TD-DFT spectrum, XPS, photophysical data. CCDC 2287343. For ESI and crystallographic data in CIF or other electronic format see DOI: https://doi.org/10.1039/d4nr00326h |
| This journal is © The Royal Society of Chemistry 2024 |

