An insight, at the atomic level, into the structure and catalytic properties of the isomers of the Cu22 cluster†
Huimin
Zhou‡
a,
Tao
Yang‡
a,
Huijuan
Deng‡
a,
Yapei
Yun
a,
Shan
Jin
 *a,
Lin
Xiong
*b and
Manzhou
Zhu
 *a
*a
aKey Laboratory of Structure and Functional Regulation of Hybrid Materials, Anhui University, Ministry of Education, Institutes of Physical Science and Information Technology, Anhui University, Department of Chemistry and Center for Atomic Engineering of Advanced Materials, Anhui University, Hefei, Anhui 230601, P. R. China. E-mail: zmz@ahu.edu.cn; jinshan@ahu.edu.cn
bSchool of Food and Chemical Engineering, Shaoyang University, Shaoyang 422000, PR China. E-mail: xionglin0823@gmail.com
First published on 30th April 2024
Abstract
The study of structural isomerism in copper nanoclusters has been relatively limited compared to that in gold and silver nanoclusters. In this work, we present the controlled synthesis and structures of two isomeric copper nanoclusters, denoted as Cu22-1 and Cu22-2, whose compositions were determined to be Cu22(SePh)10(Se)6(P(Ph-4F)3)8 through single-crystal X-ray diffraction (SCXRD). The structural isomerism of Cu22-1 and Cu22-2 arises from the different arrangements of a few Cu(SeR)(PR3) motifs on the surface structure. These subtle changes in the surface structure also influence the distortion of the core and the spatial arrangement of the clusters, and affect the electronic structure. Furthermore, due to their distinct structures, Cu22-1 and Cu22-2 exhibit different catalytic properties in the copper-catalyzed [3 + 2] azide–alkyne cycloaddition (CuAAC). Notably, Cu22-1 demonstrates efficient catalytic activity for photoinduced AAC, achieving a yield of 90% within 1 hour. This research contributes to the understanding of structural isomerism in copper nanoclusters and offers insights into the structure–function relationship in these systems.
Introduction
Ligand-protected nanoclusters have attracted significant attention due to their promising applications in catalysis, optical waveguides, fluorescence, and more.1–9 The increasing number of structurally-determined clusters has led to the discovery of various types of nanocluster isomerism, including chiral isomerism and structural isomerism, which serve as valuable models for investigating structure–property relationships.10–17 Chiral isomerism is often observed in the crystal lattice, while structural isomerism can be achieved through ligand engineering or controlled synthesis methods. However, compared to chiral isomerism, the existence of “literal” nanocluster structural isomers, composed of identical constituent metals and ligands, is rarely reported. To date, only seven pairs of such isomers have been fully structurally determined, namely Au4Cu4,18 Au9,19 Au23,10 Au28,20 Au36,21 Au38,22 and Au42.23 The discovery of structural isomerism has greatly contributed to our understanding of the correlation between cluster structures and their properties. For instance, the Au36(SR)24 cluster, with a two-dimensional (2D) arrangement of Au4 tetrahedral units, has been found to exhibit higher efficiency in the intramolecular hydroamination of alkynes compared to the Au36(SR)24 cluster with a one-dimensional (1D) arrangement of Au4 tetrahedral units.24 Similarly, two isomeric Au38(PET)24 (PET = 2-phenylethanethiol) clusters have demonstrated distinctly different catalytic properties, while two isomeric Au42(TBBT)26 (TBBT = 4-tert-butylbenzenethiol) clusters have exhibited diverse luminescence behaviors.22,23 Efforts have been made to discover more pairs of nanocluster structural isomers.25–39 The majority of research on structural isomerism in nanoclusters has focused on gold and silver nanoclusters, with limited exploration of copper nanocluster structural isomerism.31,40,41 Quasi-structural isomerism has been identified in copper clusters based on the Cu20H11(S2P(OiPr)2)9 and Cu20H11{Se2P(OiPr)2}9 templates.40 Then the Sun group synthesized two quasi-structurally isomeric copper nanoclusters, [Cu13Na2(CZ-PrA)6(TC4A)2Cl(CH3OH)2] and [Cu13Na(CZ-PrA)6(TC4A)2(CH3OH)]·CH3OH·CH2Cl2·CH3COCH3, with nearly identical Cu13 cores but different ligand arrangements. This difference results in varied catalytic selectivity for the 1O2 involved selective oxidation of sulfides.41 Unlike the quasi-structural isomerism observed in copper nanoclusters, reports of copper cluster isomers sharing the same molecular formula yet exhibiting different structures are exceedingly rare. Therefore, further investigations are necessary to explore the isomerism of copper nanoclusters.In this study, we present the synthesis of two isomeric copper nanoclusters, namely Cu22-1 and Cu22-2, through the reduction of a copper salt (Cu(CH3CN)4·BF4) in the presence of PhSeH and P(Ph-4F)3 ligands. The compositions of Cu22-1 and Cu22-2 were determined to be Cu22(SePh)10(Se)6(P(Ph-4F)3)8. The Se2− in the clusters may be generated in situ by the decomposition of the PhSe− ligands, whose C–Se bonds are broken under the reducing atmosphere.42,43 Interestingly, during the crystal culture process, Cu22-1 and Cu22-2 formed crystals with different crystal forms (Fig. S1†), enabling easy separation and subsequent analysis using single-crystal X-ray diffraction. Although Cu22-1 and Cu22-2 exhibit slight structural differences, they display distinct packing modes and demonstrate unique catalytic properties. This discovery of copper isomerism protected by PhSe− and P(Ph-4F)3 ligands contributes to the advancement of structural isomerism in this field.
Results and discussion
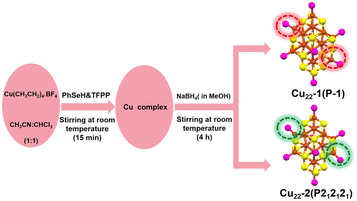
The synthesis of the two isomeric Cu22(SePh)10(Se)6(P(Ph-4F)3)8 clusters was achieved using a one-pot method, followed by a crystal culture process to separate them (Scheme 1). In this procedure, Cu(CH3CN)4·BF4 was added to a mixed solution of CH3CN and CHCl3. After 10 minutes, tris(4-fluorophenyl)phosphine (P(Ph-4F)3) and phenylselenol (PhSeH) were introduced. After an additional 15 minutes, a NaBH4 solution was added. The resulting mixture was stirred for 4 hours, and then the solution was removed using a rotary evaporator. The obtained precipitate was washed multiple times with CH2Cl2 and n-hexane. The Cu22(SePh)10(Se)6(P(Ph-4F)3)8 isomers were crystallized in a mixture of CH2Cl2 and n-hexane at room temperature for 2 weeks. Black block and yellow flake crystals were observed, which were identified as Cu22-1 and Cu22-2, respectively. The yield of the nanoclusters was about 10% and 15% for black block Cu22-1 and yellow flake Cu22-2, respectively.Single-crystal structural analysis revealed both copper nanoclusters have identical compositions. Each consisted of 22 copper atoms, 10 PhSe− ligands, 8 P(Ph-4F)3 and 6 Se atoms, but they had different surface structures. The total structures of Cu22-1 and Cu22-2 are shown in Fig. 1. The overall structures of Cu22-1 and Cu22-2 are very similar, and the structural isomerism of Cu22-1 and Cu22-2 mainly resulted from different arrangements of a few Cu(SeR)(PR3) motifs which was highlighted by the red and green circles. It is worth noting that the structure of Cu22-1 was similar to the structures of [Cu22Se6(SePh)10(PPh2C6H4SMe)8]44 and [Cu22Se6(S-C6H4-Br)10(PPh3)8]/[Cu22Se6(S-C6H4-OSiMe3)10(PPh3)8] reported by the Fuhr group,45,46 while Cu22-2 had not been observed.
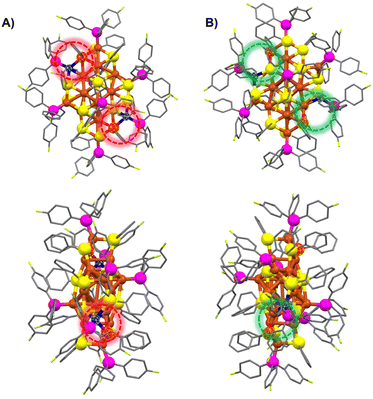 | ||
| Fig. 1 The total structures of (A) Cu22-1 and (B) Cu22-2 from different views. Color labels: Cu = brown/blue, Se = yellow/red, P = purple, F = chartreuse, C = gray. For clarity, H atoms are omitted. | ||
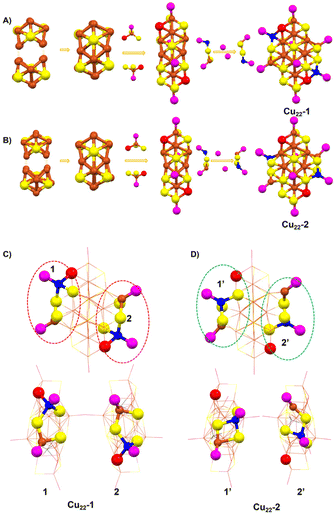
The structures of Cu22-1 and Cu22-2 were analysed and are presented in Fig. 2. Both clusters had similar Cu16Se6 units, which were formed by the fusion of two distorted Ino decahedra Cu10Se3 through the sharing of four Cu atoms (Fig. S2† and Fig. 2A and B). As shown in Fig. S3,† the arrangement of the Cu16Se6 units in Cu22-2 was more orderly than that in Cu22-1. The Cu16Se6 framework was then surrounded by two Cu(SeR)3(PR3) motifs. The isomeric structures of Cu22-1 and Cu22-2 were achieved when the surface Cu2(SeR)2(PR3)2 motifs capped the Cu16Se6@Cu2(SeR)6(PR3)2 framework. As shown in Fig. 2C and D, the difference in the bonding environment of the Cu2(SeR)2(PR3)2 motifs with the Cu16Se6@Cu2(SeR)6(PR3)2 framework can be observed, especially for the copper atoms (blue). The copper atoms in blue shift from the position near Cu(SeR)3(PR3) to the position of the nucleus, accompanied by the bond distance of Cublue–Sered varying from 2.587 Å to 4.604 Å, and the bond distance of Cublue–Seyellow varying from 4.446 Å to 2.553 Å (Fig. S4†). Therefore, the different arrangements of the surface motifs account for the isomerism of Cu22-1 and Cu22-2 clusters, which is similar to the case of Au23(C![[triple bond, length as m-dash]](https://www.rsc.org/images/entities/char_e002.gif) CBut)15 and different from the case of Au38(PET)24, where completely different metal cores were observed in the two isomers. The Cu–Cu distances gave an average of 2.647 Å for Cu22-1 and 2.672 Å for Cu22-2, while the Cu–Se distances gave an average of 2.530 Å for Cu22-1 and 2.519 Å for Cu22-2, and the Cu–P distances gave an average of 2.223 Å for Cu22-1 and 2.228 Å for Cu22-2 (Fig. S5 and 6†). Furthermore, the differences in bonding modes between the two surface Cu–P ligands and the overall framework were found to be the main cause of isomerism of the Cu22-1 and Cu22-2 clusters, as illustrated in Fig. S7.†
CBut)15 and different from the case of Au38(PET)24, where completely different metal cores were observed in the two isomers. The Cu–Cu distances gave an average of 2.647 Å for Cu22-1 and 2.672 Å for Cu22-2, while the Cu–Se distances gave an average of 2.530 Å for Cu22-1 and 2.519 Å for Cu22-2, and the Cu–P distances gave an average of 2.223 Å for Cu22-1 and 2.228 Å for Cu22-2 (Fig. S5 and 6†). Furthermore, the differences in bonding modes between the two surface Cu–P ligands and the overall framework were found to be the main cause of isomerism of the Cu22-1 and Cu22-2 clusters, as illustrated in Fig. S7.†
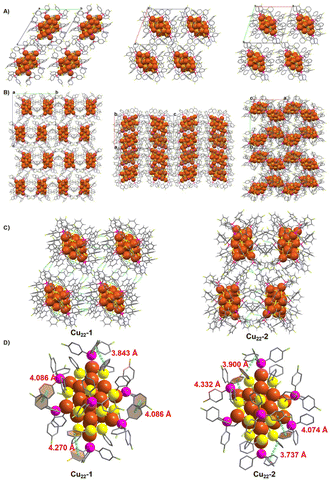
Regarding the crystal system, the two isomeric Cu22-1 and Cu22-2 clusters exhibit different space groups despite sharing the same crystal condition (CH2Cl2 and n-hexane). Cu22-1 crystallized in the triclinic P![[1 with combining macron]](https://www.rsc.org/images/entities/char_0031_0304.gif) space group, while Cu22-2 crystallized in the orthorhombic P212121 space group (Tables S1 and S2†). In the crystal unit cell of Cu22-1 (Fig. 3A), only one nanocluster is observed, and these nanoclusters are arranged in the same direction in the packing model. On the other hand, Cu22-2 nanoclusters in the crystal unit cell are arranged in an alternating pattern (Fig. 3B, and Fig. S8†). This indicates that structural isomerism can effectively alter the stacking pattern of clusters. In the stacking pattern of Cu22-1 and Cu22-2, intermolecular forces such as C–F⋯H–C interactions are observed (Fig. 3C), with a higher occurrence in the stacking pattern of Cu22-1. Furthermore, it is noteworthy that intramolecular π⋯π interactions have been identified within both isomeric forms of Cu22-1 and Cu22-2 (Fig. 3D). These interactions, crucial for the stabilization of molecular structures, exhibit variations that can be attributed to the differing arrangements of surface ligands across the isomers. This observation underscores the significant role that ligand positioning plays in influencing the molecular interactions and, consequently, the overall behavior of these nanoclusters. These intramolecular and intermolecular forces contribute to the efficient stability of the two isomeric Cu22-1 and Cu22-2 clusters.
space group, while Cu22-2 crystallized in the orthorhombic P212121 space group (Tables S1 and S2†). In the crystal unit cell of Cu22-1 (Fig. 3A), only one nanocluster is observed, and these nanoclusters are arranged in the same direction in the packing model. On the other hand, Cu22-2 nanoclusters in the crystal unit cell are arranged in an alternating pattern (Fig. 3B, and Fig. S8†). This indicates that structural isomerism can effectively alter the stacking pattern of clusters. In the stacking pattern of Cu22-1 and Cu22-2, intermolecular forces such as C–F⋯H–C interactions are observed (Fig. 3C), with a higher occurrence in the stacking pattern of Cu22-1. Furthermore, it is noteworthy that intramolecular π⋯π interactions have been identified within both isomeric forms of Cu22-1 and Cu22-2 (Fig. 3D). These interactions, crucial for the stabilization of molecular structures, exhibit variations that can be attributed to the differing arrangements of surface ligands across the isomers. This observation underscores the significant role that ligand positioning plays in influencing the molecular interactions and, consequently, the overall behavior of these nanoclusters. These intramolecular and intermolecular forces contribute to the efficient stability of the two isomeric Cu22-1 and Cu22-2 clusters.
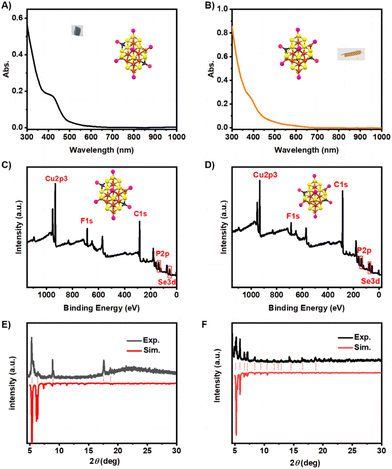
As determined by single-crystal X-ray diffraction (SCXRD), the two isomeric Cu22-1 and Cu22-2 clusters were found to have the formula Cu22(SePh)10(Se)6(P(Ph-4F)3)8, with a total of 22 copper atoms, 10 SePh− ligands, 6 Se ligands, and 8 P(Ph-4F)3 ligands. Both isomeric nanoclusters were found to possess 0 free electrons, calculated as 22 (Cu) − 10 (SePh) − 6 (Se) × 2 − 0 (charge) = 0 e. To further validate the neutral state of the cluster, as indicated by X-ray single-crystal analysis, electrospray ionization time-of-flight mass spectrometry was conducted in both positive and negative modes. No mass signal for the cluster was detected in either the positive or negative ion mode. The solubility of the Cu22 clusters was tested in solvents such as toluene, CH2Cl2, CHCl3, CH3OH, CH3CH2OH and CH3CN. Cu22 was found to be practically insoluble in CH3OH, CH3CH2OH and CH3CN, while showing limited solubility in toluene, CH2Cl2 and CHCl3. As Cu22 exhibits stability for several hours in CH2Cl2 solution, CH2Cl2 was selected as the solvent for the UV-vis spectral analysis. The UV-vis spectra of Cu22-1 and Cu22-2 in CH2Cl2 are shown in Fig. 4A and B, respectively. Cu22-1 exhibited a shoulder band at 420 nm, with the optical energy gap being 2.60 eV, while Cu22-2 showed a very weak shoulder band at 382 nm, with the optical energy gap being 2.73 eV (Fig. S9†). These distinct UV-vis spectra indicated that the two isomeric Cu22-1 and Cu22-2 clusters possess different electronic structures, which could potentially impact their catalytic performance. X-ray photoelectron spectroscopy (XPS) was performed to confirm the formula. XPS analysis demonstrated the Cu/Se/P atomic ratio of 22/11.8/8.3 and 22/12.3/8.2 for Cu22-1 and Cu22-2, respectively, close to the ratio of 22/12/8 obtained from the crystal analysis results. The peak signals of Cu, Se, and P are shown in Fig. 4C and D. This result illustrated that the valence state of Cu in the Cu22 nanocluster was close to +1 (Fig. S10†). Elemental analysis (EA) measurement (Table S3†) was performed and the ratio of elements agrees well with that from the X-ray crystallographic analysis. In addition, powder X-ray diffraction (PXRD) was used to assess the purity of the nanoclusters (Fig. 4E and F). The results show that the experimental data is in good agreement with theoretical data, which confirmed their high phase purity. Fluorescence spectroscopy was conducted on the two isomers Cu22-1 and Cu22-2 at low temperatures. As illustrated in Fig. S11,† it was observed that both isomers exhibited no fluorescence, whether in solution or in the solid state. Consequently, these findings categorized the two isomers of Cu22-1 and Cu22-2 as non-fluorescent clusters.
Furthermore, the electronic structures of isomeric Cu22-1 and Cu22-2 were predicted by DFT calculation.47–51 As depicted in Fig. 5, comparing the partial density-of-states (PDOS) diagrams of Cu22-1 and Cu22-2 provides a clearer insight into the atomic distribution within these two cluster structures and their respective contributions to orbitals across different energy levels. This comparative analysis helps to uncover both similarities and distinctions in the electronic structure of the two clusters. From Fig. 5, it is evident that in the low-energy occupied orbital regions of both clusters, the pink and orange curves are relatively prominent, indicating a significant role played by the Cu and Se atoms’ orbitals in forming these occupied orbitals in Cu22-1 and Cu22-2. Conversely, the unoccupied orbitals in the higher energy range of the clusters were predominantly composed of C atom orbitals (as shown by the red curve in the PDOS). Furthermore, the DOS diagram reveals that the disparity in the HOMO–LUMO energy gaps between Cu22-1 and Cu22-2 is minimal (2.86 eV and 2.73 eV, respectively), suggesting a similarity in their electronic structures. The HOMO–LUMO energy gaps agreed with the optical energy gap well. Nonetheless, there are subtle discrepancies in the DOS curves of the two clusters. Specifically, the TDOS curves (depicted in black) of Cu22-1 and Cu22-2 exhibit noticeable distinctions in the vicinity of the −5.0 eV energy level. More precisely, within this energy range, the two orbitals of Cu22-1 form a distinct higher peak. Conversely, due to a significant energy gap disparity between the two orbitals in Cu22-2, under the same broadening function and full width at half maximum (FWHM), the TDOS displays two shorter peaks. This implies that the orbital density in the −5.0 eV to −4.6 eV range differs between the two clusters. Furthermore, with a relative energy difference of 0.39 eV (Cu22-1 exhibiting lower energy than Cu22-2), it is evident that slight variances exist in the electronic structures of Cu22-1 and Cu22-2.
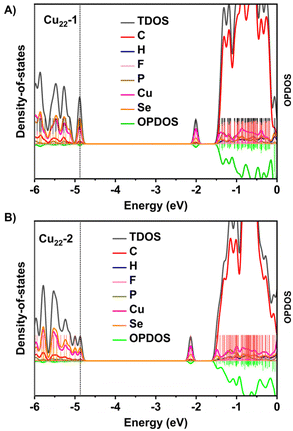 | ||
| Fig. 5 Calculated PDOS for (A) Cu22-1 and (B) Cu22-2. Here the orbital energy range is set from −6 eV to 0 eV. | ||
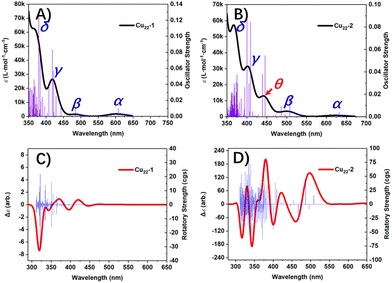
On the other hand, UV-visible absorption spectroscopy (UV-Vis) is a powerful tool to provide structural and electronic structure information, hence the UV-Vis spectra of Cu22-1 and Cu22-2 simulated by the TDDFT method provide an effective way to reveal the differences in the structure and electronic structure of the two clusters. Fig. 6A and B show the simulated UV-Vis spectra of Cu22-1 and Cu22-2. It can be seen that the spectral curves of these two clusters have similarities but also show obvious differences. Briefly, both Cu22 isomers have four similar absorption peaks, namely peak α, peak β, peak γ and peak δ. For Cu22-1, the four absorption peaks of α, β, γ and δ are located at 605 nm, 485 nm, 418 nm and 366 nm, respectively. The corresponding four absorption peaks in Cu22-2 are located at 623 nm, 499 nm, 402 nm and 367 nm, respectively. Therefore, the electronic structures of the two Cu22 are similar to a large extent. The transition modes shown in Tables S4 and 5† reveal the attributions of these absorption peaks. Obviously, the peak α in the two Cu22 clusters’ spectra has the same attribution, and both are obtained by broadening the first excited state and the second excited state. As shown in Table S4,† for Cu22-1, the first excited state is characterized by H → L contributing 66.6%, followed by H−1 → L contributing 31.2%. The second excited state is characterized by an H−1 → L contribution of 66.2%, followed by an H → L contribution of 31.0%. This is very similar to the assignment of the absorption peak α in the Cu22-2 spectrum (Table S5†). However, Tables S5 and S6† show that there are obvious differences in the assignments of the absorption peaks β, γ and δ in the spectra of the two Cu22 clusters. Interestingly, as shown in Fig. 6B, due to the difference in geometric structure, Cu22-2 has an additional absorption peak θ compared to Cu22-1 (see Table S6† for its assignment). This shows that there are significant differences in the spectral characteristics of the two Cu22 clusters, revealing the differences in their electronic structures. Furthermore, based on the rotatory strength from the ground state to each excited state calculated by TDDFT, we also plotted the electronic circular dichroism (ECD) spectra of the two Cu22 clusters, which are shown in Fig. 6C and D. It can be clearly found that the ECD spectra of the two Cu22 clusters are significantly different. The reason is that the ECD is extremely sensitive to conformation. Therefore, even if Cu22-1 and Cu22-2 only have a small difference in the shell structure, the difference can still be clearly reflected in the ECD.
The variations in surface shell ordering cause structural isomerism, altering the electronic structure, which then will influence the catalytic activity. To explore this, the copper-catalyzed [3 + 2] azide–alkyne cycloaddition (CuAAC) reaction was used as an example reaction, and the activity of Cu22-1 and Cu22-2 was evaluated (Table 1 and Table S6†). The reaction was conducted in acetonitrile, using 0.06 mol% of Cu22-1 and Cu22-2 crystals as catalysts suspended in the solvent.52–56 After 24 hours at 50 °C, Cu22-1 achieved a product yield of 92%, while Cu22-2 yielded only 36% (Table S6†). A time-dependent kinetic study of the CuAAC reaction was also performed. Cu22-1 exhibited a catalytic efficiency of 64% at approximately 12 hours, whereas Cu22-2 had a catalytic efficiency of 32%. With an extended reaction time, Cu22-1 achieved a catalytic efficiency of 80% at approximately 18 hours and 92% at approximately 24 hours (Table S6†). On the other hand, Cu22-2 reached a catalytic efficiency of 35% at around 18 hours and 36% at around 24 hours. Additionally, due to the absorption peaks near 400 nm in both isomers, a photoinduced catalytic reaction was attempted using 405 nm blue LED irradiation. As shown in Table 1, Cu22-1 achieved a product yield of 90% after only 1.0 hour of irradiation, while Cu22-2 yielded only 10%. These differences in catalytic efficiency between Cu22-1 and Cu22-2 highlight how the structural isomerism, caused by the arrangement of the outer ligands, can effectively regulate the clusters’ catalytic performance. TDDFT calculations indicated that the oscillator strength between the first excited state and the ground state of Cu22-1 is 0.01004, while in Cu22-2, this oscillator strength is only 0.00405, as evidenced by the height of the vertical line representing the lowest excited state in the spectral graph. Typically, an oscillator strength below 0.01 suggests a transition is forbidden, leading us to consider the lowest excited state of Cu22-2 as a dark state. Therefore, even though the lowest excitation energy of Cu22-1 is slightly higher than that of Cu22-2, the significant oscillator strength of Cu22-1 facilitates the easy absorption of light at the corresponding frequency to form electron–hole pairs. This attribute makes Cu22-1 exhibit markedly better photocatalytic activity compared to Cu22-2. And as depicted in Fig. S12,† the UV-vis and P-XRD spectra demonstrate significant consistency before and after the photoinduced catalytic reaction, indicating the clusters maintain their integrity during the reaction process.
Conclusions
In summary, we have successfully synthesized and characterized two isomeric copper nanoclusters, Cu22(SePh)10(Se)6(P(Ph-4F)3)8-1 (Cu22-1, P![[1 with combining macron]](https://www.rsc.org/images/entities/char_0031_0304.gif) ) and Cu22(SePh)10(Se)6(P(Ph-4F)3)8-2 (Cu22-2, P212121), using SCXC. Cu22(SePh)10(Se)6(P(Ph-4F)3)8 contains a Cu16Se6 core formed by the fusion of two distorted Ino decahedron Cu10Se3 clusters through the sharing of four Cu atoms. This Cu16Se6 core is further capped by two Cu(SeR)3(PR3) motifs, two Cu(SeR)2(PR3)2 motifs and two PR3 phosphine ligands. The isomerism of Cu22-1 and Cu22-2 is due to the different arrangements of the surface motifs, which result in differences in electronic structure (as manifested by different UV absorption spectra, and DFT calculation) and catalytic efficiency in the copper-catalyzed [3 + 2] azide–alkyne cycloaddition (CuAAC). The clusters are highly stable due to π⋯π intramolecular interactions and C–F⋯H–C intermolecular forces, making them difficult to dissolve. These two isomeric copper nanoclusters enrich the development of structural isomerism in copper nanoclusters and provide an opportunity to investigate the structure–function relationship.
) and Cu22(SePh)10(Se)6(P(Ph-4F)3)8-2 (Cu22-2, P212121), using SCXC. Cu22(SePh)10(Se)6(P(Ph-4F)3)8 contains a Cu16Se6 core formed by the fusion of two distorted Ino decahedron Cu10Se3 clusters through the sharing of four Cu atoms. This Cu16Se6 core is further capped by two Cu(SeR)3(PR3) motifs, two Cu(SeR)2(PR3)2 motifs and two PR3 phosphine ligands. The isomerism of Cu22-1 and Cu22-2 is due to the different arrangements of the surface motifs, which result in differences in electronic structure (as manifested by different UV absorption spectra, and DFT calculation) and catalytic efficiency in the copper-catalyzed [3 + 2] azide–alkyne cycloaddition (CuAAC). The clusters are highly stable due to π⋯π intramolecular interactions and C–F⋯H–C intermolecular forces, making them difficult to dissolve. These two isomeric copper nanoclusters enrich the development of structural isomerism in copper nanoclusters and provide an opportunity to investigate the structure–function relationship.
Conflicts of interest
There are no conflicts to declare.Acknowledgements
S. J., Y. Y., M. Z. acknowledge financial support provided by the National Natural Science Foundation of China (21901001, 21631001, 22305002), Anhui Provincial Natural Science Foundation (no. 1908085QB54) and the Scientific Research Program of Anhui Province (2022AH040018). L. X. acknowledges the financial support provided by the National Natural Science Foundation of China (22203053) and the Hunan Provincial Natural Science Foundation (2023JJ40606).References
- X. Wang, B. Yin, L. Jiang, C. Yang, G. Zou, S. Chen and M. Zhu, Science, 2023, 381, 784–790 CrossRef CAS PubMed.
- W. Gao, Q. Li, W. Zhong, X. Zhou, Y. Ge, Q. Yan and L. Shang, Chem. Eng. J., 2023, 456, 140982 CrossRef CAS.
- X. Ma, J. Li, P. Luo, J. Hu, Z. Han, X. Dong, G. Xie and S. Zang, Nat. Commun., 2023, 14, 4121 CrossRef CAS PubMed.
- X. Hu, H. Cao, W. Dong and J. Tang, Talanta, 2021, 233, 122480 CrossRef CAS PubMed.
- M. Wang, J. Zhang, X. Zhou, H. Sun and X. Su, Sens. Actuators, B, 2022, 358, 131488 CrossRef CAS.
- Q. Xue, Z. Wang, S. Han, Y. Liu, X. Dou, Y. Li, H. Zhu and X. Yuan, J. Mater. Chem. A, 2022, 10, 8371–8377 RSC.
- Q. Wu, D. Si, P. Sun, Y. Dong, S. Zheng, Q. Chen, S. Ye, D. Sun, R. Cao and Y. Huang, Angew. Chem., Int. Ed., 2023, 62, e2023068 Search PubMed.
- S. Zhuang, D. Chen, W. Fan, J. Yuan, L. Liao, Y. Zhao, J. Li, H. Deng, J. Yang, J. Yang and Z. Wu, Nano Lett., 2022, 22, 7144–7150 CrossRef CAS PubMed.
- L. Liu, Z. Wang, Z. Wang, R. Wang, S. Zang and T. C. W. Mak, Angew. Chem., Int. Ed., 2022, 61, e2022056 Search PubMed.
- Z. Guan, F. Hu, J. Li, Z. Wen, Y. Lin and Q. Wang, J. Am. Chem. Soc., 2020, 142, 2995–3001 CrossRef CAS PubMed.
- H. Yi, K. M. Osten, T. I. Levchenko, A. J. Veinot, Y. Aramaki, T. Ooi, M. N. Nambo and C. M. Crudden, Chem. Sci., 2021, 12, 10436–10440 RSC.
- Y. Chen, C. Liu, Q. Tang, C. Zeng, T. Higaki, A. Das, D. Jiang, N. L. Rosi and R. Jin, J. Am. Chem. Soc., 2016, 138, 1482–1485 CrossRef CAS PubMed.
- S. Horiuchi, S. Moon, A. Lto, J. Tessarolo, E. S. Y. Arikawa, G. H. Clever and K. Umakoshi, Angew. Chem., Int. Ed., 2021, 60, 10654–10660 CrossRef CAS PubMed.
- S. Zhuang, L. Liao, M. Li, C. Yao, Y. Zhao, H. Dong, J. Li, H. Deng, L. Lie and Z. Wu, Nanoscale, 2017, 9, 14809–14813 RSC.
- Y. T. Cao, S. Malola, M. F. Matus, T. K. Chen, Q. F. Yao, R. Shi, H. Häkkinen and J. P. Xie, Chem, 2021, 7, 2227–2244 CAS.
- Y. Li, X. Luo, P. Luo, Q. Zang, Z. Wang and S. Zang, ACS Nano, 2023, 17, 5834–5841 CrossRef CAS PubMed.
- S. Knoppe and T. Bürgi, Acc. Chem. Res., 2014, 47, 1318–1326 CrossRef CAS PubMed.
- W. Yu, D. Hu, L. Xiong, Y. Li, X. Kang, S. Chen, S. Wang, Y. Pei and M. Zhu, Part. Part. Syst. Charact., 2019, 36, 1800494 CrossRef.
- S. Yamazoe, S. Matsuo, S. Muramatsu, S. Takano, K. Nitta and T. Tsukuda, Inorg. Chem., 2017, 56, 8319–8325 CrossRef CAS PubMed.
- N. Xia, J. Yuan, L. Liao, W. Zhang, J. Li, H. Deng, J. Yang and Z. Wu, J. Am. Chem. Soc., 2020, 142, 12140–12145 CrossRef CAS PubMed.
- X. Liu, W. Xu, X. Huang, E. Wang, X. Cai, Y. Zhao, J. Li, M. Xiao, C. Zhang, Y. Gao, W. Ding and Y. Zhu, Nat. Commun., 2020, 11, 3349 CrossRef CAS PubMed.
- S. Tian, Y. Li, M. Li, J. Yuan, J. Yang, Z. Wu and R. Jin, Nat. Commun., 2015, 6, 8667 CrossRef CAS PubMed.
- S. Zhuang, L. Liao, J. Yuan, N. Xia, Y. Zhao, C. Wang, Z. Gan, N. Yan, L. He, J. Li, H. Deng, Z. Guan, J. Yang and Z. Wu, Angew. Chem., Int. Ed., 2019, 58, 4510–4514 CrossRef CAS.
- Y. Zhang, A. Tang, X. Cai, J. Xu, G. Li, W. Hu, X. Liu, M. Chen and Y. Zhu, Nano Res., 2023, 16, 3641–3648 CrossRef CAS.
- S. Chen, L. Xiong, S. Wang, Z. Ma, S. Jin, H. Sheng, Y. Pei and M. Zhu, J. Am. Chem. Soc., 2016, 138, 10754–10757 CrossRef CAS PubMed.
- S. Yang, J. Chai, Y. Song, J. Fan, T. Chen, S. Wang, H. Yu, X. Li and M. Zhu, J. Am. Chem. Soc., 2017, 139, 5668–5671 CrossRef CAS PubMed.
- Y. Song, S. Wang, J. Zhang, X. Kang, S. Chen, P. Li, H. Sheng and M. Zhu, J. Am. Chem. Soc., 2014, 136, 2963–2965 CrossRef CAS PubMed.
- A. Das, T. Li, G. Li, K. Nobusada, C. Zeng, N. L. Rosi and R. Jin, Nanoscale, 2014, 6, 6458–6462 RSC.
- S. Jin, F. Xu, W. Du, X. Kang, S. Chen, J. Zhang, X. Li, D. Hu, S. Wang and M. Zhu, Inorg. Chem., 2018, 57, 5114–5119 CrossRef CAS PubMed.
- C. Zeng, T. Li, A. Das, N. L. Rosi and R. Jin, J. Am. Chem. Soc., 2013, 135, 10011–10013 CrossRef CAS PubMed.
- Y. Bao, X. Wu, B. Yin, X. Kang, Z. Lin, H. Deng, H. Yu, S. Jin, S. Chen and M. Zhu, Chem. Sci., 2022, 13, 14357–14365 RSC.
- A. Dass, T. Jones, M. Rambukwella, D. Crasto, K. J. Gagnon, L. Sementa, M. D. Vetta, O. Baseggio, E. Aprà, M. Stener and A. Fortunelli, J. Phys. Chem. C, 2016, 120, 6256–6261 CrossRef CAS.
- T. Higaki, C. Liu, C. Zeng, R. Jin, Y. Chen, N. L. Rosi and R. Jin, Angew. Chem., Int. Ed., 2016, 55, 6694–6697 CrossRef CAS PubMed.
- R. S. Dhayal, Y. Lin, J.-H. Liao, Y.-J. Chen, Y.-C. Liu, M.-H. Chiang, S. Kahlal, J. Y. Saillard and C. Liu, Chem. – Eur. J., 2016, 22, 9943–9947 CrossRef CAS PubMed.
- M. W. Heaven, A. Dass, P. S. White, K. M. Holt and R. W. Murray, J. Am. Chem. Soc., 2008, 130, 3754–3755 CrossRef CAS PubMed.
- M. Zhu, C. M. Aikens, F. J. Hollander, G. C. Schatz and R. Jin, J. Am. Chem. Soc., 2008, 130, 5883–5885 CrossRef CAS PubMed.
- J. Li, Z. Guan, Z. Lei, F. Hu and Q. Wang, Angew. Chem., Int. Ed., 2019, 58, 1083–1087 CrossRef CAS PubMed.
- N. Yan, N. Xia, L. Liao, M. Zhu, F. Jin, R. Jin and Z. Wu, Sci. Adv., 2018, 4, eaat7259 CrossRef CAS PubMed.
- Z. Lei, J. Li, X.-K. Wan, W.-H. Zhang and Q.-M. Wang, Angew. Chem., Int. Ed., 2018, 57, 8639–8643 CrossRef CAS PubMed.
- R. S. Dhayal, J.-H. Liao, X. Wang, Y.-C. Liu, M.-H. Chiang, S. Kahlal, J.-Y. Saillard and C. W. Liu, Angew. Chem., Int. Ed., 2015, 54, 13604–13608 CrossRef CAS PubMed.
- C. K. Zhang, Z. Wang, W.-D. Si, L. Y. Wang, J.-M. Dou, Z.-Y. Gao, C.-H. Tung and D. Sun, ACS Nano, 2022, 16, 9598–9607 CrossRef CAS PubMed.
- T. Higaki, C. Liu, M. Zhou, T. Luo, N. L. Rosi and R. Jin, J. Am. Chem. Soc., 2017, 139, 9994–10001 CrossRef CAS PubMed.
- B. Yan, X. You, X. Tang, J. Sun, Q. Xu, L. Wang, Z.-J. Guan, F. Li and H. Shen, Chem. Mater., 2024, 36, 1004–1012 CrossRef CAS.
- O. Fuhr, A. Meredith and D. Fenske, J. Chem. Soc., Dalton Trans., 2002, 4091–4094 RSC.
- R. Langer, L. Wünsche, D. Fenske and O. Fuhr, Z. Anorg. Allg. Chem., 2009, 635, 2488–2494 CrossRef CAS.
- R. Langer, W. Yu, L. Wünsche, G. Buth, O. Fuhr and D. Fenske, Z. Anorg. Allg. Chem., 2011, 637, 1834–1840 CrossRef CAS.
- H. Li, P. Wang, C. Zhu, W. Zhang, M. Zhou, S. Zhang, C. Zhang, Y. Yun, X. Kang, Y. Pei and M. Zhu, J. Am. Chem. Soc., 2022, 144, 23205–23213 CrossRef CAS PubMed.
- M. Cui, Y. Shi, X. Ma, Q. Li, L. Chen, L. Zhang, J. Wu, H. Yu and M. Zhu, ACS Nano, 2024, 18, 6591–6599 CrossRef CAS PubMed.
- G. Luo, Z. Pan, B. Han, G. Dong, C. Deng, M. Azam, Y. Tao, J. He, C. Sun and D. Sun, Angew. Chem., Int. Ed., 2023, 62, e2023068 Search PubMed.
- Z. Wang, Y. Zhu, O. Ahlstedt, K. Konstantinou, J. Akola, C. Tung, F. Alkan and D. Sun, Angew. Chem., Int. Ed., 2024, 63, e20231451 Search PubMed.
- T. Jia, Z. Guan, C. Zhang, X. Zhu, Y. Chen, Q. Zhang, Y. Yang and D. Sun, J. Am. Chem. Soc., 2023, 145, 10355–10363 CrossRef CAS PubMed.
- D. Campeau, A. Pommainville, M. Gorodnichy and F. Gagosz, J. Am. Chem. Soc., 2023, 145, 19018–19029 CrossRef CAS PubMed.
- W. D. G. Brittain, B. R. Buckley and J. S. Fossey, ACS Catal., 2016, 6, 3629–3636 CrossRef CAS.
- J. M. Holub and K. Kirshenbaum, Chem. Soc. Rev., 2010, 39, 1325–1337 RSC.
- C. Dong, R. Huang, A. Sagadevan, P. Yuan, L. G. Arzaluz, A. Ghosh, S. Nematulloev, B. Alamer, O. M. Mohammed, I. Hussain, M. Rueping and O. M. Bakr, Angew. Chem., Int. Ed., 2023, 62, e20230714 Search PubMed.
- Y. Fang, K. Bao, P. Zhang, H. Sheng, Y. Yun, S. Hu, D. Astruc and M. Zhu, J. Am. Chem. Soc., 2021, 143, 1768–1772 CrossRef CAS PubMed.
Footnotes |
| † Electronic supplementary information (ESI) available: Synthesis process, characterization, X-ray analysis, and Fig. S1, S12 and Tables S1–S6 offering more details on the nanoclusters Cu22-1 and Cu22-2. CCDC 2289673 for Cu22-1 and 2289674 for Cu22-2. For ESI and crystallographic data in CIF or other electronic format see DOI: https://doi.org/10.1039/d4nr00973h |
| ‡ These authors contributed equally. |
| This journal is © The Royal Society of Chemistry 2024 |

