 Open Access Article
Creative Commons Attribution 3.0 Unported Licence
Mechanical reinforcement from two-dimensional nanofillers: model, bulk and hybrid polymer nanocomposites
Ming
Dong
 a,
Yiwei
Sun
 a,
David J.
Dunstan
 b,
Robert J.
Young
 *c and
Dimitrios G.
Papageorgiou
 *a
*a
aSchool of Engineering and Materials Science, Queen Mary University of London, London E1 4NS, UK. E-mail: d.papageorgiou@qmul.ac.uk
bSchool of Physics and Chemical Sciences, Queen Mary University of London, London E1 4NS, UK
cNational Graphene Institute, Department of Materials, School of Natural Sciences, The University of Manchester, Manchester M13 9PL, UK. E-mail: robert.young@manchester.ac.uk
First published on 19th June 2024
Abstract
Thanks to their intrinsic properties, multifunctionality and unique geometrical features, two-dimensional nanomaterials have been used widely as reinforcements in polymer nanocomposites. The effective mechanical reinforcement of polymers is, however, a multifaceted problem as it depends not only on the intrinsic properties of the fillers and the matrix, but also upon a number of other important parameters. These parameters include the processing method, the interfacial properties, the aspect ratio, defects, orientation, agglomeration and volume fraction of the fillers. In this review, we summarize recent advances in the mechanical reinforcement of polymer nanocomposites from two-dimensional nanofillers with an emphasis on the mechanisms of reinforcement. Model, bulk and hybrid polymer nanocomposites are reviewed comprehensively. The use of Raman and photoluminescence spectroscopies is examined in light of the distinctive information they can yield upon stress transfer at interfaces. It is shown that the very diverse family of 2D nanofillers includes a number of materials that can attribute distrinctive features to a polymeric matrix, and we focus on the mechanical properties of both graphene and some of the most important 2D materials beyond graphene, including boron nitride, molybdenum disulphide, other transition metal dichalcogenides, MXenes and black phosphorous. In the first part of the review we evaluate the mechanical properties of 2D nanoplatelets in “model” nanocomposites. Next we examine how the performance of these materials can be optimised in bulk nanocomposites. Finally, combinations of these 2D nanofillers with other 2D nanomaterials or with nanofillers of other dimensions are assessed thoroughly, as such combinations can lead to additive or even synergistic mechanical effects. Existing unsolved problems and future perspectives are discussed.
1. Introduction
Since its isolation in 2004 in Manchester,1 graphene, the first two-dimensional (2D) material, has been studied extensively and utilised in different fields, including electronics, photonics and composites, as a result of its impressive intrinsic properties.2 The very interesting research on graphene-related materials has motivated researchers to explore further the large family of 2D materials, such as hexagonal boron nitride (h-BN),3 transition metal dichalcogenides (TMDCs) of the type MX2,4 transition metal carbides, nitrides, or carbonitrides (MXenes, where M = transition metal and X = C or N5) and black phosphorus (BP),6 as shown in Fig. 1. The majority of these 2D materials display impressive and sometimes unusual mechanical, electrical and optical properties in comparison to their three-dimensional (3D) counterparts as a result of their atomic thinness, high specific surface area and electron confinement in 2D sheets.7 For example, graphene with hexagonal sp2 hybridized carbon atoms in its structure, alongside its zero band gap, shows excellent electron mobility of 250![[thin space (1/6-em)]](https://www.rsc.org/images/entities/char_2009.gif) 000 cm2 V−1 s−1 along with a very high thermal conductivity of around 5000 W mK−1.8,9 On the other hand, monolayer MoS2 and BP are semiconductors while h-BN is an electrical insulator.
000 cm2 V−1 s−1 along with a very high thermal conductivity of around 5000 W mK−1.8,9 On the other hand, monolayer MoS2 and BP are semiconductors while h-BN is an electrical insulator.
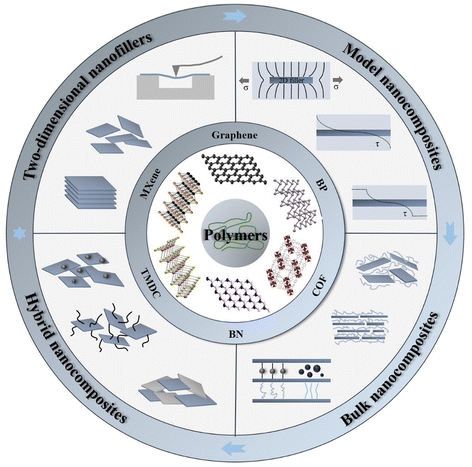 | ||
| Fig. 1 Illustration of mechanical reinforcement in a polymer matrix from two-dimensional nanofillers, including graphene, BN, TMD, MXene, BP and COF (covalent organic frameworks). | ||
Amongst the long list of exceptional properties and numerous applications of 2D materials, their mechanical properties and the corresponding reinforcement in the field of polymer nanocomposites are very appealing to both academia and industry, as in many cases they can be readily incorporated into polymers using established manufacturing processes.10–12 The majority of 2D materials possess high in-plane stiffness and strength resulting from their strong covalent bonds.13,14 For example, graphene has in-plane stiffness of the order of 1 TPa resulting from its sp2 hybrid bonds.15,16 Similarly, h-BN displays good mechanical properties with a stiffness up to 90% of graphene,17 while the stiffness of MoS2 is about 300 GPa.18 The direct transfer of these properties into nanocomposites, however, presents challenges. The first is the importance of the lateral size and aspect ratio of 2D nanofillers. To achieve high levels of mechanical reinforcement in polymer nanocomposites by 2D materials, flakes with large lateral sizes (>30 μm) are favoured, given that in order to obtain good reinforcement, the flake length should be ∼10× the critical length, according to the shear lag theory developed initially for fibres.19,20 Large flakes, however, have a high probability of containing a large number of defects and these defects will unavoidably degrade the mechanical properties of the 2D nanosheets. It is also very challenging to prepare nanosheets of consistently large lateral dimensions via bulk-scale production methods. A number of top-down exfoliation and bottom-up synthesis methods have been proposed to produce high quality 2D materials while also achieving a high production yield.21 Additional challenges include obtaining a homogeneous distribution of the flakes, the unavoidable damage of the flakes during melt processing and the increase of melt viscosity at higher filler content. Nevertheless, the incorporation of 2D nanosheets can not only lead to considerable improvements in the mechanical properties, but also attribute good thermal, electrical and optical properties. It is highly desirable, therefore, to make a comparison between different fabrication strategies, different nanofiller combinations and their reinforcement mechanisms in polymer nanocomposites in order to understand how to the maximise the level of reinforcement and hence target a wide number of applications.
Due to the increasing interest in graphene and graphene-based nanocomposites, a large number of reviews have been published on the mechanical properties of graphene-based nanocomposites.16,22,23 There are other reviews upon the mechanical properties of 2D materials,13,14,24 and perspective articles about the emerging trends and challenges of polymer nanocomposites with 2D materials.10,11 Here, we go beyond the scope of these earlier reviews and examine the mechanisms of mechanical reinforcement of polymers by 2D nanomaterials with a particular focus upon the range of 2D materials beyond graphene. We focus on the study of model composites in order to understand the mechanical characteristics of 2D monolayers and evaluate their combination with nanomaterials of different dimensions in hybrid nanocomposites, as illustrated in Fig. 1. In section 1, a brief introduction is given of 2D nanomaterials and polymer nanocomposites. In section 2, the various preparation methods (including top-down and bottom-up) of a number of 2D materials are discussed along with their intrinsic mechanical properties. In section 3, a series of model nanocomposites based on 2D materials are reviewed. The use of Raman spectroscopy and photoluminescence (PL) spectroscopy is examined in detail as both techniques can offer invaluable information in the characterization of the mechanical properties and of the nanoscale reinforcement. The mechanical properties of bulk nanocomposites based on different 2D nanosheets are reviewed in detail in section 4, with an emphasis on graphene, h-BN, TMDCs and MXenes nanocomposites. Hybrid nanocomposites based on 2D nanosheets (including 2D–2D, 2D–1D and 2D–0D composites) are thoroughly discussed in section 5. Finally, future perspectives for the field of mechanical reinforcement of polymer nanocomposites reinforced with 2D materials are discussed in section 6.
2. Two-dimensional materials: preparation and mechanical properties
2.1. Preparation
During the past decades, various methods have been used to prepare 2D materials in order to explore their fundamental mechanical, electrical and optical properties, and to promote their use in numerous applications. These approaches can be divided into two categories: top-down and bottom-up. Here we summarize recent advances in the preparation of 2D materials with a highlight on their applications in polymer nanocomposites.Liquid-phase exfoliation is one of the most promising methods for the high-yield production of 2D materials.21,27,28 2D materials with layered bulk crystals can be exfoliated in an appropriate liquid phase. Mass production can be achieved by the liquid exfoliation method in an inexpensive and relatively simple way. Exfoliated 2D materials can be processed directly by solution blending for applications in polymer nanocomposites. The method follows three successive steps: dispersion, exfoliation and purification. Liquid exfoliation processes can be classified into three distinct types: mechanical-, intercalation-, and oxidation-assisted methods (Fig. 2). Mechanically-assisted methods include sonication, shear mixing, and ball milling. Sonication was first employed in the exfoliation of graphite flakes29 and leads to the rupture of large flakes and the formation of kink band striations on the surfaces of the flakes. Cracks form along these striations and together with intercalation of solvent, lead to the unzipping and peeling off of thin graphite strips that are exfoliated into graphene.28 The key point for efficient exfoliation is matching the surface energy between the layered materials and the solvents. Low boiling-point or volatile solvents are preferred to facilitate post-processing. Solvents also play an important role in the stabilization of exfoliated 2D sheets to prevent their agglomeration. This method has been applied widely to various layered materials beyond graphene such as h-BN and TMDCs.30 Liquid-phase exfoliation also presents some drawbacks such as the low yield of monolayer flakes and their small lateral sizes (nanometres or no more than a few microns).
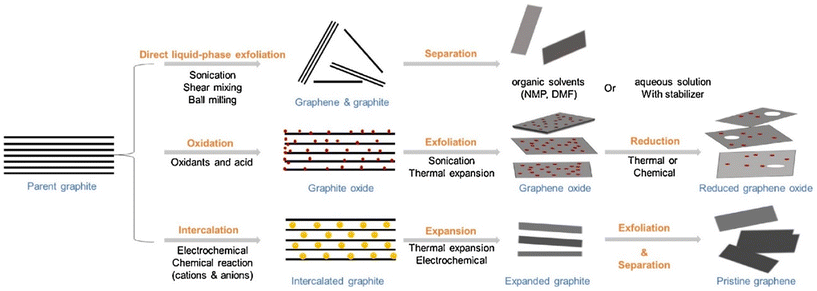 | ||
| Fig. 2 Liquid exfoliation methods for the preparation of graphene and related 2D nanosheets, including mechanical force-assisted, oxidation-assisted and intercalation-assisted exfoliation. Reproduced with permission from ref. 11. Copyright 2018 Elsevier. | ||
Shear-force-assisted liquid exfoliation was developed to improve the productivity of the method.31 Typically, shear is generated by a rotor-stator mixer or even a kitchen blender.32 This method is highly promising for the production of 2D materials on an industrial scale. Alternatively, mechanical forces can be generated by ball milling.33 This method suffers seriously, however, from the production of flakes with very small lateral size (in the order of nanometres) and a key restriction on the applicability of these methods is the achievable flake size.
For the production of large flakes, ion intercalation-assisted liquid exfoliation has been proposed.34 This method relies on the intercalation of cations into the interlayer space of layered structures to enlarge the interlayer distance and weaken the interlayer forces. Reactions between the cations and the solvents can produce hydrogen gas to further facilitate the exfoliation. This method has been successfully applied to exfoliate graphene and TMDCs with large lateral sizes of tens of micrometres.34,35 One disadvantage of this method is the poor control of the ion intercalation process. This results in the insufficient or excessive intercalation of ions, and more post-processing is then required. Furthermore, it is more time-consuming compared to mechanical force-assisted liquid exfoliation as ion intercalation takes place over longer periods.7
In oxidation-assisted liquid exfoliation for graphene oxide (GO)36 and selective etching-assisted liquid exfoliation for MXenes,7 the oxidation or etching stages are a pre-treatment of the bulk crystals. Oxidation generates functional groups on the surfaces of graphene. These functional groups can enlarge the interlayer spacing of the graphite and weaken the van der Waals (vdW) interactions. Exfoliation is then obtained by sonication so that monolayer or multilayer GO can be produced. This method is effective for the preparation of GO, but it is not applicable to other materials. Selective etching-assisted liquid exfoliation has been used for the exfoliation of MXenes. In contrast to most layered structures connected by weak vdW bonds, the Mn+1Xn (n = 1, 2, or 3) layers in MAX phases are connected by the A layers (elements of group IIIA or IVA). The covalent bonds mean that stronger forces are required to exfoliate MXenes from their bulk crystals. Gogotsi et al.37 were the first to exfoliate MXenes from their MAX phases successfully. They fabricated 2D nanosheets composed of Ti3C2 layers by exfoliating TiAlC2 in a hydrofluoric acid (HF) solution without causing damage to the remaining structure. The lateral size of nanosheets from this method is a few hundred nanometres, small enough to limit the reinforcement efficiency of individual nanosheets in polymer nanocomposites, especially at low filler contents.
2.2. Mechanical properties
The mechanical properties of 2D materials constitute one of the main reasons for their immense interest from academia and industry. The mechanical properties of 2D materials have already been reviewed in terms of elastic properties, interfacial behaviour, failure mechanisms, characterization methods and coupling properties (including electromechanical, optomechanical, and thermomechanical properties).13,14,24 In this section, we will summarize the intrinsic stiffness, strength and toughness of a range of 2D materials. | (1) |
 | (2) |
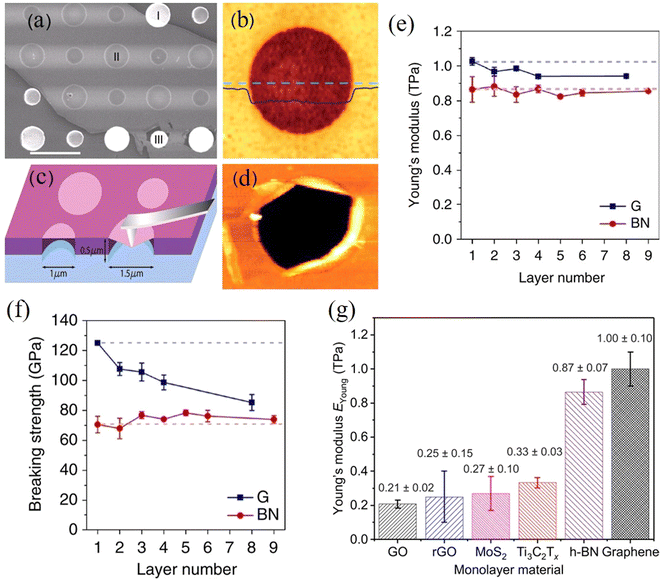 | ||
| Fig. 3 (a–d) AFM indentation method for the measurement of stiffness and strength of graphene. Reproduced with permission from ref. 15. Copyright 2008 AAAS. (e and f) Variations of Young's modulus and breaking strength with layer number of graphene (G) and BN. Reproduced with permission from ref. 17 Copyright 2017 Nature Publishing Group. (g) Young's modulus of various 2D materials. Reproduced with permission from ref. 47. Copyright 2018 AAAS. | ||
More recently, in situ tensile tests have been applied to measure the elastic properties of 2D materials.48–50 To conduct an in situ tensile test, monolayer 2D materials are prepared and transferred onto a push-to-pull micromechanical device. The displacement-controlled tensile test is carried out in a scanning electron microscope (SEM) and the mechanical properties can be assessed from the load-displacement curves. Quite importantly, this method can apply a uniform loading to the 2D material plane and the corresponding elastic properties can be directly determined. The Young's modulus, tensile strength and elastic strain of monolayer graphene48 and Ti3C2Tx![[thin space (1/6-em)]](https://www.rsc.org/images/entities/char_2009.gif) 49 have been determined using this method.
49 have been determined using this method.
The buckling method is another highly useful and interesting method that can be used to measure the stiffness of 2D films or nanosheets.51 This technique is based upon the buckling instabilities that form when a stiff material is deposited (or coated) as a thin film under compressive strain onto a soft, thick substrate. Using the well-established mechanics of buckling52,53 and by observing the periodicity and spacing of the wrinkles that are formed, the elastic modulus of a nanosheet (or film) (Efilm) can then be calculated based on the relationship between the ripple period (λ) and the flake thickness (h):
 | (3) |
The Young's modulus (∼1 TPa) and breaking strength (∼130 GPa) of monolayer graphene (assuming a thickness of 0.335 nm) were first reported by Lee et al.15 High-quality monolayer graphene synthesised by CVD was also investigated by AFM indentation and found to have modulus and strength values similar to mechanically-exfoliated material.57 It is generally accepted that the strength of graphene decreases with an increase in number of layers.17,58 The hypothesis for the degradation of the strength of graphene is based on the fact that the interactions between layers influence the load distribution and lead to weakening. The onset of interlayer slippage coincides with the formation of kinks in the graphene. Each slippage step corresponds to a certain part of the interface overcoming energy barriers to go from the initial energy minimum state to the adjacent energy minimum state.58 Once interlayer slippage occurs, the stress distribution between individual layers becomes unequal. The layer under the highest stress fails first, causing premature failure of the multilayer material and lowering the material strength. It should be noted that the stacking between graphene layers plays a major role in controlling the effective strength of the material. As expected, noncommensurate stacked systems show a lower interlayer shear strength which leads to earlier slippage and a greater drop in the effective strength, compared with commensurate stacked systems. From another aspect, if the external load can be applied evenly to each layer, there is no reason that the breaking strength of a multilayer would differ from a monolayer.
Among various graphene-related materials (GRMs), graphene oxide is one of the most popular materials for reinforcement in polymer nanocomposites. GO consists of a hexagonal carbon network having both sp2- and sp3-hybridized carbon atoms. The basal plane is decorated with hydroxyl and epoxide groups, while the edges contain carbonyl and carboxyl groups. The Young's modulus of monolayer graphene oxide (GO) was measured experimentally to be 210 ± 25 GPa.59 The significantly lower stiffness of GO, compared to monolayer graphene, can be attributed to the transformation of the original sp2-bonded carbon atoms of graphene into sp3-bonded atoms via covalent bonding with oxygen.
Similar to graphene, h-BN displays a honeycomb structure consisting of sp2-bonded boron and nitrogen atoms that leads to excellent mechanical properties. Falin et al.17 reported a Young's modulus of 865 ± 73 GPa and a breaking strength of 70.5 ± 5.5 GPa for h-BN, properties that make it an appealing alternative to graphene in polymer nanocomposites. Most importantly, the Young's modulus and tensile strength of h-BN do not deteriorate with an increase of the number of layers due to strong interlayer interactions (Fig. 3e and f). This can be attributed to the difference in the electronic characteristics of graphene and h-BN (semi-metallic and insulating, respectively).
The Young's modulus and breaking strength of mechanically-exfoliated monolayer MoS2 have been measured to be 270 ± 100 GPa and 22 ± 4 GPa, respectively18 and the Young's modulus of mechanically-exfoliated multilayer MoS2 was measured to be 330 ± 70 GPa.60 High-quality, CVD-grown MoS2 was found to have a similar modulus value (264 ± 18 GPa).61 The mechanical properties of other TMDCs including WS2,61 MoSe2,62 WSe2![[thin space (1/6-em)]](https://www.rsc.org/images/entities/char_2009.gif) 63 and MoTe2
63 and MoTe2![[thin space (1/6-em)]](https://www.rsc.org/images/entities/char_2009.gif) 64 have also been measured experimentally (Table 1). The Young's modulus and tensile strength of the TMDC sulfides tend to be similar but both decrease when the S is replaced by Se or Te (Table 1).65
64 have also been measured experimentally (Table 1). The Young's modulus and tensile strength of the TMDC sulfides tend to be similar but both decrease when the S is replaced by Se or Te (Table 1).65
| Material | Layers | Young's modulus (GPa) | Strength (GPa) | Method | Ref. |
|---|---|---|---|---|---|
| F: few-layer; /: armchair/zigzag directions. | |||||
| Graphene | 1 | 1000 ± 100 | 130 ± 10 | Nanoindentation | 15 |
| Graphene (CVD) | 1 | 1000 ± 50 | 103–118 | Nanoindentation | 57 |
| Graphene (CVD) | 1 | 920 | 50–60 | In situ tension | 48 |
| Graphene (Wrinkled) | 1 | 160 | 35 | Nanoindentation | 75 |
| 1 | 60–299 | — | Interferometry | 78 | |
| GO | 1–3 | 207.6 ± 23.4 | — | Nanoindentation | 59 |
| 1 | 150 ± 30 | 4.4 ± 0.6 | Nanoindentation | 79 | |
| h-BN | 1–9 | 865 ± 73 | 70.5 ± 5.5 | Nanoindentation | 17 |
| h-BN (CVD) | 2 | 223 ± 16 | — | Nanoindentation | 73 |
| MoS2 | 1 | 270 ± 100 | 22 ± 4 | Nanoindentation | 18 |
| 1 | 210 ± 50 | 26.8 ± 5.4 | Nanoindentation | 80 | |
| 5–10 | 330 ± 70 | — | Nanoindentation | 60 | |
| 3–11 | 246 ± 35 | — | Buckling method | 54 | |
| MoS2 (CVD) | 1 | 264 ± 18 | — | Nanoindentation | 61 |
| WS2 | 3–8 | 330 ± 70 | — | Buckling method | 54 |
| WS2 (CVD) | 1 | 272 ± 18 | — | Nanoindentation | 61 |
| MoSe2 | 1–2 | 177.2 ± 9.3 | 4.8 ± 2.9 | Tension test | 62 |
| 5–10 | 224 ± 41 | — | Buckling method | 54 | |
| WSe2 | 5–12 | 167.3 ± 6.7 | 12.4 | Nanoindentation | 63 |
| 4–9 | 163 ± 39 | — | Buckling method | 54 | |
| MoTe2 | F | 110 ± 16 | 5.6 ± 1.3 | Nanoindentation | 64 |
| BP | F | 27.2 ± 4.1/58.6 ± 11.7 | 2.31 ± 0.71/4.79 ± 1.43 | Nanoindentation | 68 |
| F | 27.38 ± 2.35/65.16 ± 4.45 | — | Nanoindentation | 69 | |
| F | 35.1 ± 6.3/93.3 ± 21.8 | — | Buckling method | 70 | |
| Ti3C2Tx | 1–2 | 330 ± 30 | 17.3 ± 1.6 | Nanoindentation | 47 |
| Ti3C2Tx | 1 | 484 ± 13 | 15.4 ± 1.92 | In situ tension | 49 |
| Nb4C3Tx | 1 | 386 ± 13 | 26 ± 1.6 | Nanoindentation | 71 |
Lipatov et al.47 measured the Young's modulus and intrinsic strength of monolayer Ti3C2Tx MXene to be 330 ± 30 GPa and 17.3 ± 1.6 GPa via AFM indentation (Fig. 3g). The modulus value is lower than that derived from theoretical calculations (500 to 600 GPa),66 most likely due to the monolayer containing defects as a result of solution processing. Interlayer sliding is suppressed as a result of the hydrogen bonding between Ti3C2Tx layers, leading to any increase in layer number not degrading mechanical properties.47 The mechanical properties of Nb4C3Tx were measured recently with values of Young's modulus of 386 ± 13 GPa and strength of 26 ± 1.6 GPa being reported.67 It should be noted that these values are amongst the highest for solution-processed 2D materials other than graphene, which makes MXenes promising candidates for applications in structural composites.
The mechanical properties of black phosphorus (BP) have been investigated using both nanoindentation and buckling. The Young's modulus and breaking strength of monolayer BP were found by nanoindentation to be 58.6 ± 11.7 and 27.2 ± 4.1 GPa in the zigzag direction, 4.79 ± 1.43 and 2.31 ± 0.71 GPa in the armchair direction.68 Similar results were obtained from the AFM indentation of BP nanoribbons by Chen et al.69 The Young's modulus of few-layer BP was determined using the buckling method to be 93.3 ± 21.8/35.1 ± 6.3 GPa (zigzag/armchair).70
Reduced values of stiffness and strength have been observed resulting from the presence of defects and wrinkles. Structural defects, such as vacancies, grain boundaries and dislocations are ubiquitous in 2D materials and have significant effects on their mechanical properties.71 Zhao et al.72 reported, through the use of in situ Raman mapping, that the intrinsic strength for large, mechanically-exfoliated monolayer graphene flakes can drop to around 10 GPa as a result of the presence of defects. In the AFM indentation tests of h-BN grown by CVD, poorer elastic properties were determined compared to the values for mechanically-exfoliated samples and theoretical calculations. This was attributed to the presence of vacancy defects.73 Out-of-plane deformations of 2D materials, such as ripples, wrinkles and crumples may be produced naturally during the preparation of 2D materials74 and they can modify the mechanical properties of the materials.75 For example, Ruiz-Vargas et al.75 indented wrinkled graphene using AFM and found that the in-plane stiffness was softened significantly by out-of-plane wrinkles.
It should be noted that there are contradictory findings in the literature where the presence of defects and the variation of grain boundary angles has been reported to lead to an increase in the modulus and tensile strength. The work of Lopez-Polin et al.76 showed a higher stiffness for graphene samples that were bombarded with Ar+ ions when the mean distance of such vacancy defects was up to ∼5 nm (a defect density of 0.2%). For higher defect densities, the elastic modulus decreased once again, while according to continuum mechanics the strength of the graphene sheets also decreased with the presence of defects (regardless of the density). The authors explained the increase of stiffness with an increase in defect density on the basis of the thermodynamic theory of crystalline membranes; the defects suppress the flexural modes with longer wavelengths that do not contribute to a decrease of E2D, leading to an effective increase. Grantab et al.77 used molecular dynamics (MD) and density functional theory (DFT) modelling to understand the effect of grain boundaries on the mechanical properties of graphene. According to the authors, and quite counterintuitively, as the grain boundary angle and hence the defect density increases, the stress and strain at failure of monolayer graphene increases. This comes as a result of the decrease of the initial length of the critical bonds toward the sp2 carbon–carbon bond length and the level of pre-existing strain within the critical bonds of the seven-membered rings. As expected, fracture mechanics (Griffith's theory) was unable to account for these observations since continuum theories ignore the presence of atomic bonds. There is no clear consensus on the effect of defects on the strength and stiffness of graphene membranes, even if the majority of experimental studies have reported a decrease in their values as a result of the presence of different types of defects. All these findings are summarized in Table 1.
In situ tensile tests within an SEM chamber were first used to characterize the fracture behaviour of graphene.81 As shown in Fig. 4a, a pre-cracked graphene monolayer was stretched in a tension stage and the stress–strain curve was used to evaluate the fracture behaviour. According to Griffith's theory of brittle fracture,83 the critical stress for the initiation of fracture σc is given as  , where a0 is the initial crack length, γ is the surface energy and E is the stiffness of the material. The critical stress intensity factor KIC
 , and the strain energy release rate GC
 are generally used to characterize the fracture toughness.84 The average values for graphene are KIC ≈ 4 MPa m1/2 and GC ≈ 15.9 J m−2, which implies that graphene is a brittle material since the product
  remains constant around an average value of 2.25 MPa m1/2. Recently, it has been shown that the propagation of cracks in graphene can be monitored by the use of in situ Raman mapping.85 Multilayer graphene exhibits a larger fracture toughness (12.0 ± 3.9 MPa m1/2) than monolayer resulting from different fracture mechanisms.86 The cracks propagate along different directions and form rough edges in multilayer graphene. A higher energy is therefore required for crack propagation. In addition, recoverable interlayer slippage leads to a driving force relaxation and elastic strain energy dissipation. Polycrystalline graphene also shows higher fracture toughness compared with the single-crystal graphene.87,88 The grain boundaries in polycrystalline graphene lead to complex crack propagation paths and higher energy dissipation while the stress is less concentrated at the crack tip due to the larger deformation area.
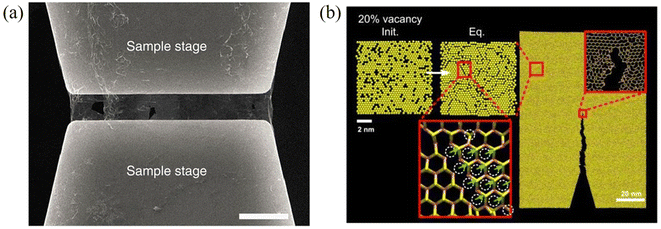 | ||
| Fig. 4 (a) Suspended monolayer graphene over a tension stage for fracture toughness measurement. Scale bar, 5 μm. Reproduced with permission from ref. 81. Copyright 2014 Nature Publishing Group. (b) Crack propagation in monolayer MoS2 with line defects. Reproduced with permission from ref. 82. Copyright 2016 American Chemical Society. | ||
For monolayer h-BN, the value of KIC (8.7 MPa  ) is similar to that of graphene, while the value of GC (86.35 ± 45.22 J m−2) is one order of magnitude higher than both its energy release rate for brittle Griffith fracture and that for graphene.89 This is the result of its asymmetric edge elastic properties, crack deflection and branching occurring repeatedly at the crack tip and edge swapping during crack propagation, that toughens the material and enables stable crack propagation. Wang et al.82 observed the transition from brittle to ductile fracture in MoS2 with an increase in defect density. The tensile strength of moderately-defective MoS2 is larger than that of graphene. This is because line defects in MoS2 influence crack propagation as shown in Fig. 4b, while holes in graphene have no effect on the crack propagation.
Different strategies have been used to improve the fracture behaviour of 2D materials. The fracture toughness of multilayer graphene was increased from 16 to 39 J m−2 through chemical functionalization.90 Apart from the distinct crack propagation in multilayer samples, oxygen groups induce local strain fields, thus a higher energy is required for crack growth. Secondly, defect engineering, such as inducing high-density defects, can lead to the transition from brittle to ductile fracture in graphene and MoS2.82 Finally, kirigami-type structures have been found to undergo large strains without fracture, as ripples in a kirigami structure can stiffen the nanosheets significantly.91
3. “Model” nanocomposites
To achieve mechanical reinforcement in bulk polymer nanocomposites, 2D nanosheets need to be dispersed into the matrix and the stress transferred from the matrix to the 2D nanosheets via an interfacial shear force when the composites are subjected to external loading. Since the elastic modulus of 2D nanosheets is much higher than that of the polymer matrices, it means that in a uniform strain situation, a much larger stress can be sustained.92 It is difficult, however, from the study of bulk polymer nanocomposites to extract conclusions regarding the reinforcing mechanisms originating from individual monolayer or few-layer 2D materials due to a number of complexities. These include agglomeration and orientation of the fillers, the formation of filler folds or loops during processing and the size distribution of the fillers. In order to fully understand and model the stress transfer mechanisms originating from the geometric characteristics and the intrinsic mechanical properties of 2D materials, researchers have devised the study of “model” polymer nanocomposites where individual flakes are sandwiched between two polymer layers. Studies on model nanocomposites can provide guidance on how to balance different factors, such as the lateral dimensions of the flakes, the layer number, any chemical functionalization and the effects of defects or wrinkles, to achieve optimal mechanical reinforcement of polymers using 2D nanosheets. There are some reports in which flakes are deposited on top of a flexible polymer substrate and strain is subsequently applied to the polymer beam. These studies are also very helpful to achieve a detailed understanding of the stress transfer mechanisms.3.1. Theories of reinforcement in polymer matrix: the shear-lag theory
The ultimate mechanical performance of polymer nanocomposites depends not only upon the mechanical properties of the incorporated 2D nanosheets, but is also subject to the interfacial interaction between the nanosheets and the matrix. A strong interfacial interaction means that the stress in a matrix can be transferred efficiently to the nanosheets via shear and reinforcement can thus be achieved. The stress transfer mechanism from a matrix to 2D nanosheets can be described using shear-lag analysis93 based upon elastic deformation with no interfacial sliding. When a strain is applied to the matrix with shear modulus Gm, the strain in the 2D nanosheet εf can be calculated from | (4) |
 is the shear-lag parameter describing the interfacial shear stress transfer efficiency, Ef is the Young's modulus of the filler and t and T are the thicknesses of the nanosheet and the surrounding matrix.
When strain is applied to a nanosheet, the strain begins at the edges and extends to match the strain level of the matrix at a certain distance away from the filler edge; 90% of this distance is defined as the critical length lc, as seen from Fig. 5b. Only the central part of the flakes delivers effective reinforcement, while the critical length region reinforces the composite relatively poorly. The maximum strain in the graphene occurs at the centre of the flake where x = 0 and the maximum interfacial shear stress occurs at the edges. The lateral size of the nanosheet is therefore an important parameter. When the lateral size is large, efficient stress transfer and mechanical reinforcement can be achieved; as the lateral size decreases, insufficient stress transfer takes place, as seen from Fig. 5c–e. To achieve good mechanical reinforcement, the size of the nanosheets needs to be about 10 × lc. Moreover, mechanical reinforcement also depends on the strength of the interface, the interfacial shear strength. The interfacial shear stress τ is given by
 | (5) |
 | (6) |
 , km is the effective stiffness of the substrate. This strain cannot be directly measured and the interfacial shear strength can be determined from the measurements of the plateau strain at the centre of the flake εp, given that the sliding zones develop from the edges and approach the centre:
 | (7) |
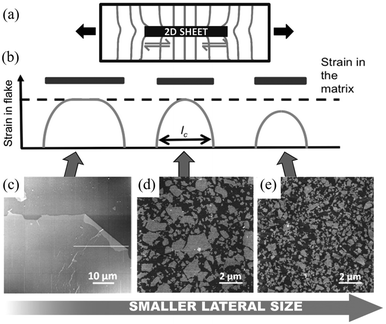 | ||
| Fig. 5 (a) Illustration of stress transfer from a matrix to 2D nanosheets through shear at the fibre–matrix interface. The distortion of the stress lines comes as a result of the differences in the Young's modulus between the matrix and the fibre. (b–e) Variations of strain transfer efficiency with lateral size of 2D nanofiller. When the lateral size is large, strain transfer efficiency from the matrix to 2D nanosheet is high; when the lateral size reduces to the critical length lc, only strain at the centre position of the nanosheet equals to strain in the matrix; as the lateral size continues to decrease, the strain transfer efficiency is poor. Reproduced with permission from ref. 10. Copyright 2016 Wiley-VCH Verlag GmbH & Co. KGaA. | ||
It can be realised from eqn (7) that the level of stress transferred from the matrix to the nanofiller can be improved by increasing the lateral size of the nanosheets and by having a high interfacial shear strength (e.g. by chemical functionalization).
3.2. Model monolayer nanocomposites
In order to understand the mechanics of reinforcement it is desirable to know the distribution of strain in the 2D nanofillers. The strain in the nanosheets, the stress transfer mechanisms and the mechanical reinforcement can be evaluated using Raman spectroscopy and photoluminescence (PL) spectroscopy as strain induces changes in phonon frequencies and band gaps. This can offer invaluable information with regards to both the mechanical properties of the 2D nanosheets and their polymer-based nanocomposites.Raman spectroscopy has been widely used to study model nanocomposites under strain. The strain induces shifts in the characteristic Raman bands of 2D materials, such as the G94–96 and 2D97–99 bands of graphene, the G mode of h-BN,100 the E2g1 and A1g modes of MoS2![[thin space (1/6-em)]](https://www.rsc.org/images/entities/char_2009.gif) 101–104 and WS2,105–107 and the A1g mode of Ti3C2Tx.108 The shifts of phonon modes are generally proportional to the applied strain and this allows the determination of strain in 2D nanosheets. The mode-specific Grüneisen parameter is calculated based on the following expression for either uniaxial or biaxial strain for a specific phonon mode95
101–104 and WS2,105–107 and the A1g mode of Ti3C2Tx.108 The shifts of phonon modes are generally proportional to the applied strain and this allows the determination of strain in 2D nanosheets. The mode-specific Grüneisen parameter is calculated based on the following expression for either uniaxial or biaxial strain for a specific phonon mode95
 | (8) |
The strain in graphene can be monitored by observing the 2D band shifts of a monolayer deposited onto a flexible polymer substrate. Reported values of the rate of band shift are found to vary as a result of slippage109 or wrinkling110 and a value of around −60 cm−1/% for uniaxial strain has been regarded as a reference for good stress transfer.95 Gong et al.19 studied stress transfer in a graphene/SU-8/polymethyl methacrylate (PMMA) model composite under uniaxial tension using the Raman 2D band shift. Monolayer graphene (tens of micrometres in lateral dimensions) was exfoliated from graphite and the Raman spectra at the centre of the nanosheets were obtained. For strains under 0.4%, the 2D band shift is −50 cm−1/% and the shear-lag theory works well. The interfacial shear stress was calculated to be around 2.3 MPa. For strains above 0.4%, interfacial sliding occurs as shown in Fig. 6a and the interfacial behaviour can no longer be predicted by the shear-lag theory. The interfacial shear stress drops to about 0.3–0.8 MPa. These values are relatively low compared to the values of carbon fibre composites (∼20–40 MPa),111 as adhesion between graphene and the matrix is relatively poor. Subsequently, Young et al.112 used Raman mapping to capture the strain distribution in monolayer graphene embedded between SU8 and SU8/PMMA. For strains under 0.6%, the 2D band shift is −61 ± 2 cm−1/% and the strain distribution is homogeneous. For strain above 0.6%, the strain distribution becomes inhomogeneous due to the formation of cracks that are also responsible for the poor interfacial shear strength (∼0.25 MPa). Jiang et al.20 later studied the interfacial shear behaviour in a graphene/PET system. For strains from 0 to 1.2%, the 2D band shift was found to be of the order of −52.5 cm−1/%. In this case, at low strain levels, above 0.3% interfacial sliding occurred and a nonlinear shear-lag theory was proposed to describe the stress transfer mechanism (Fig. 6b). According to this theory, the onset of interfacial sliding can be predicted by setting the maximum shear stress equal to the interfacial shear strength. In their experiments, the interfacial shear strength was found to range from 0.7 MPa for a specimen with a length of 12.4 μm to 0.5 MPa for a specimens with a length of 17.2 μm, assuming E2D = 350 N m−1. The maximum strain that could be transferred from the substrate to graphene was in the range of 1.2–1.6%. Anagnostopoulos et al.113 investigated how doping and edge effects (bond length and angle and edge chirality) affect stress transfer in a graphene/SU-8/PMMA system. The lateral size of graphene was of the order of tens of micrometres. It was found that the stress transfer may deviate from the shear-lag theory near the edges (∼2 μm), induced by residual stress and doping. According to the authors, the overall length for efficient load transfer was estimated to be ∼4 μm, meaning that for flakes that are simply supported on a substrate, a length of ∼8 μm is needed for efficient loading. The interfacial shear strength was about 0.4 MPa. The morphology of the flake under study in the specific investigation makes the interpretation of results challenging as the short width of the flake leads to the maximisation of the interfacial shear stress under strain at a very short length, within the spatial resolution of the Raman measurements (of the order of 1–2 μm). Additionally, the mechanical exfoliation process and the subsequent deposition on substrates (with varying degrees of roughness) can lead to high levels of residual stresses. There is a caveat that the lateral strain of graphene is often not εy = −νε in a specimen under uniaxial strain. Where the strain of a substrate is fully transferred to graphene, its lateral strain is either determined by the Poisson's ratio of the substrate, or zero (e.g. during flexure of a thin beam). This results in complexity in obtaining strain from the shift of the 2D mode, whereas the G mode with clearer mechanical meaning may be a better alternative. A number of key factors such as the interfacial shear stress have been quantitatively determined through these studies, along with the intrinsic mechanical properties of the nanosheets, which are helpful for the optimization of the mechanical reinforcement in bulk polymer nanocomposites.
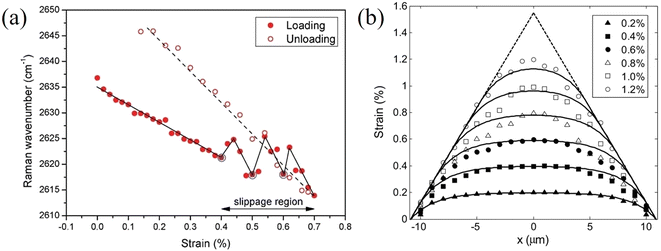 | ||
| Fig. 6 (a) Raman 2D peak shifts of graphene with applied uniaxial strain under loading and unloading. For strains higher than 0.4%, interfacial slippage occurs. Reproduced with permission from ref. 19. Copyright 2010 Wiley-VCH Verlag GmbH & Co. KGaA. (b) Experimental (dots) and nonlinear shear-lag theory prediction (lines) values of strain distribution from edge to centre of graphene under different loading conditions. Reproduced with permission from ref. 20. Copyright 2013 Wiley-VCH Verlag GmbH & Co. KGaA. | ||
Stress transfer from the polymer substrate to 2D nanosheets has also been studied for other materials.107,108 Wang et al.107 followed the stress transfer of a WS2/SU8/PMMA model composite under uniaxial tension through monitoring the downshift of the Raman E2g1 mode. The strain distributions in an uncoated WS2 nanosheet at 0% and 0.55% are shown in Fig. 7. At 0% applied strain, the centre of the flake is under 0% strain while the edge of the flake is under compression, as a result of the specimen preparation procedure. At 0.55% applied strain, the strain builds up from the edges and reaches about 0.55% strain towards the centre of the flake. This means that stress can be transferred from the substrate to the nanosheet effectively. The shear stress at the edges of the nanosheets was calculated to be about 1.1 MPa, which is similar to the values for graphene but significantly lower than that of the carbon fibres in composites (∼20–40 MPa). For monolayer WS2 coated with an SU8 layer, a crack was observed at the middle of the flake upon the application of 0.55% strain. This result, using the modulus of WS2 (∼272 GPa), suggests that the fracture strength of this monolayer WS2 flake was of the order of ∼1.5 GPa. Liu et al.108 studied interfacial stress transfer in Ti3C2Tx MXene–polymer composites. The strain distributions and interfacial shear stresses of a monolayer flake are illustrated in Fig. 7d and e. At 0.2% and 0.4% strain, the strain distributions still follow shear-lag behaviour and the shear stress at the edge is estimated to be 2.0 and 4.0 MPa, respectively. It was concluded that Ti3C2Tx MXene flake with a length of >10 μm and a thickness of 10s of nanometers would be a good candidate for mechanical reinforcement in polymer matrices.
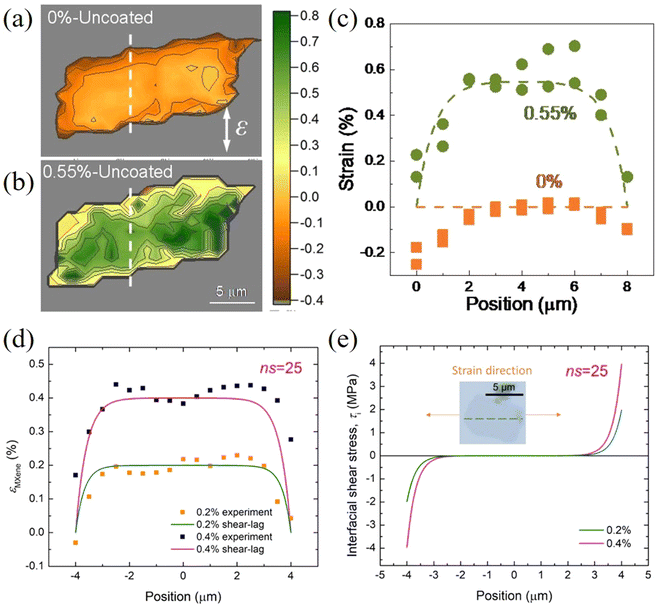 | ||
| Fig. 7 (a and b) Strain distributions in uncoated WS2 nanosheets at 0% and 0.55% applied strain. (c) Strain distributions along the white dashed lines in (a) and (b), where the points represent experimental values and the dashed lines represent values calculated from shear-lag theory. Reproduced with permission from ref. 107. Copyright 2020 IOP Publishing Ltd. (d) Strain distributions and (e) interfacial shear stresses of a monolayer Ti3C2Tx flake under 0.2% 0.4% strain. Reproduced with permission from ref. 108. Copyright 2022 American Chemical Society. | ||
The stress transfer from a matrix to 2D nanosheets with a direct band gap can also be studied by photoluminescence (PL) spectroscopy.114–116 Liu el al114 followed the strain transferred from PDMS to MoS2 by PL mapping as shown in Fig. 8a and b. It was found through the observation of PL peak shifts that about 10% of the applied strain can be transferred from PDMS to MoS2. Finite element modelling further showed that an increase in substrate modulus will improve the stress transfer under the same interfacial conditions. This is in good agreement with observations from a number of experimental investigations on graphene–polymer nanocomposites reported in the literature, where it was concluded that an increase of the modulus of the matrix leads to an increase in the effective graphene modulus within the composite.16 In a recent study, the stress transfer mechanism from a polymer matrix to monolayer MoS2 was studied in detail through strain-dependent PL spectroscopy.115 With increasing strain, the strain distribution in monolayer MoS2 can be described by shear-lag, partial-debonding and total-debonding models. It was concluded that the shear-lag model overestimates the strain in the flake when slippage takes place, as shown in Fig. 8c and d. Additionally, any errors originating from the incorrect use of the shear-lag model will increase with loading, as a result of the slippage length increasing further with loading.
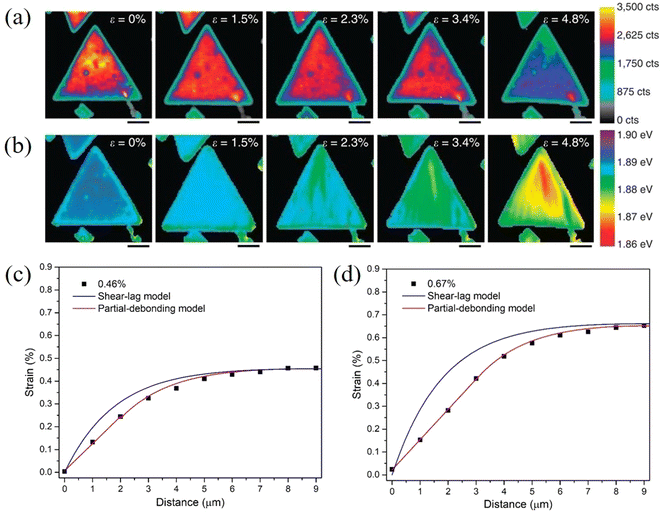 | ||
| Fig. 8 PL A exciton (a) intensity and (b) peak mapping of MoS2 with applied strain increasing from 0 to 4.8%. (Scale bar, 4 μm). Reproduced with permission from ref. 114. Copyright 2014 Nature Publishing Group. Strain distribution in monolayer MoS2 at (c) 0.46% and (d) 0.67% strain. Both shear-lag model and partial-debonding model were used to fit the experimental results. Reproduced with permission from ref. 115. Copyright 2023 Elsevier. | ||
The geometry of 2D materials and their orientation with the loading direction can affect the stress transfer from matrix to the inclusion.117–119 Manikas et al.117 studied the transfer of stress from a PMMA substrate to graphene ribbons aligned to the loading direction. In this way, truly axial deformation was achieved, and the effect of off-axial shear was avoided. The authors derived an inverse length parameter that governs the stress transfer process. The transfer lengths were in the range of 500 to 1000 nm, which are lower than cases of randomly oriented 2D materials with irregular shapes. Out-of-plane deformations such as wrinkling and crumping often occur during the preparation of 2D materials. These out-of-plane deformations can affect stress transfer and the level of mechanical reinforcement. Li et al.120 studied the stress transfer mechanisms from a PET matrix to wrinkled monolayer CVD graphene using Raman spectroscopy. The microstructure of CVD graphene consists of islands where the inside of the island is flat while the material separating the flat graphene is wrinkled graphene. Strain increases towards the centre of each separated area as shown in Fig. 9a. The observed 2D band shift of the wrinkled part is −12.8 cm−1/% is therefore about 75% lower than that of the flat part (−60 cm−1/%). In subsequent studies,121,122 it was found that wrinkling will not affect the stress transfer in a composite significantly if the flake is not delaminated from the matrix.121 Moreover, small amplitude wrinkling can improve the stress transfer efficiency of few-layer flakes due to a higher interfacial shear stress.122 In a recent study, the difference between strain relaxation in graphene and MoS2 was investigated by Yu et al.123 Monolayer graphene and MoS2 were deposited on a PDMS substrate and AFM was used to extract the spacing between wrinkles. According to the authors, at lower strain, the 2D nanosheets prefer to delaminate to generate new wrinkles; at higher strain, the 2D nanosheets prefer to slip to enlarge the existing wrinkles as shown in Fig. 9b. Furthermore, MoS2 is able to sustain a larger strain before relaxing and the maximum interfacial friction of MoS2 on PDMS (7.7 ± 2.5 MPa) is higher than that of graphene (3.8 ± 0.8 MPa). This is because the interfacial adhesion energy between MoS2 and PDMS is stronger compared to the graphene counterpart. It should be noted that the PDMS substrate was described by the manufacturer as a gel with adhesive properties, which most likely resulted in higher values of interfacial adhesion and friction. In another study, Zhang et al.124 studied the strain relaxation of WS2 on a PDMS substrate using PL spectroscopy. It was found that the formation of wrinkles depends on the orientation between the flake edge and the tensile axis; when an edge of the flake is parallel to the tensile axis, the wrinkles are distributed uniformly.
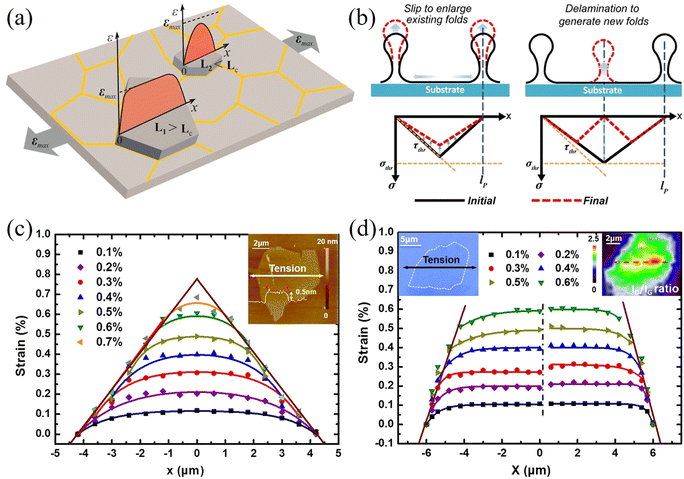 | ||
| Fig. 9 (a) Strain transfer from a substrate to a wrinkled graphene nanosheet. Reproduced with permission from ref. 120. Copyright 2015 American Chemical Society. (b) Mechanism for the formation of wrinkles in 2D nanosheets: slip to enlarge existing folds and delamination to generate new folds. Reproduced with permission from ref. 123. Copyright 2020 American Chemical Society. Strain distributions in (c) pristine graphene and (d) oxidized graphene at different applied strain. Reproduced with permission from ref. 125. Copyright 2016 American Chemical Society. | ||
As a result of the weak vdW forces between the 2D nanosheets and the matrix, interfacial slippage occurs at a relatively low strain, especially when the length of the flakes is lower than the critical length and the 2D nanosheets are not able to reinforce efficiently. Non-covalent or covalent bonds between the nanosheets and substrate can be used to improve the interfacial shear strength.125–127 Wang et al.125 studied the effects of functionalization on the stress transfer and mechanical properties of a graphene/PMMA model nanocomposite as shown in Fig. 9c and d. On one hand, it was found that the interfacial shear strength quadrupled to 1.7 MPa compared to pristine graphene. On the other hand, the functional groups induced defects in the graphene and in turn, the defects degraded the mechanical properties of graphene. Therefore, a balance needs to be kept between the degree of functionalization and the increased interfacial shear strength. The effect of chemical functionalization on the interfacial stress transfer and mechanical properties of model composites based on 2D nanosheets is a field which can provide important information regarding the reinforcement mechanisms of different nanosheets and there is plenty of scope for future investigations.
3.3. Model few- and many-layer nanocomposites
In contrast to monolayer 2D nanosheets, few-layer and multi-layer nanosheets are most commonly used as fillers in polymer nanocomposites. In this case the strain is transferred from the matrix to the outer layer of the nanosheets, and then transferred to the inner layer via shear forces. Therefore, in addition to the interfacial shear strength, the interlayer interactions also play an important role in controlling effective reinforcement from 2D nanosheets. This section focuses upon the studies of few-layer 2D nanosheets, where it is easy to identify contributions from interlayer stress transfer and interactions.Gong et al.128 studied the behaviour of monolayer and few-layer graphene/polymer model composites under axial tension with an emphasis on the effect of layer number on mechanical reinforcement. Firstly, it was found that the 2D band shift of uncoated bilayer graphene (−31 cm−1/%) is much lower compared with the coated bilayer graphene (−53 cm−1/%) and coated or uncoated monolayer graphene (−59 cm−1/%). This implies that interlayer stress transfer is relatively poor in graphene. Reduced interlayer stress transfer can further be realised from the behaviour of the coated monolayer, bilayer, trilayer and multi-layer graphene composites where the 2D band shifts are −52 cm−1/%, −53 cm−1/%, −43 cm−1/%, −8 cm−1/%, respectively, as seen from Fig. 10a.
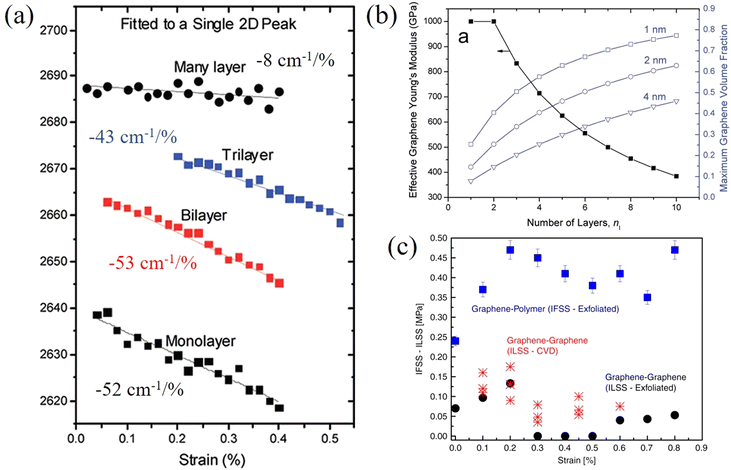 | ||
| Fig. 10 (a) Raman 2D shifts of monolayer, bilayer, trilayer and multilayer graphene in a polymer/graphene/polymer model composite. (b) Variations of effective elastic modulus of graphene with layer number. Reproduced with permission from ref. 128. Copyright 2012 American Chemical Society. (c) Interfacial shear stress of graphene–polymer and graphene–graphene. Reproduced with permission from ref. 129. Copyright 2020 Nature Publishing Group. | ||
The 2D band shift is related to the effective Young's modulus of 2D nanosheets as
 | (9) |
Interfacial stress transfer for both mechanically-exfoliated and CVD-grown bilayer graphene deposited on a PMMA/SU8 substrate have been studied using Raman spectroscopy as shown in Fig. 10c.129 The interfacial shear stress between the graphene and polymer was found to be about 0.45 MPa, whereas the maximum interfacial shear stress between the graphene layers was only about 0.13 MPa and this value dropped to zero (adhesion being lost, leaving only friction) with an increase in strain. This means that the interfacial interactions within graphene are relatively weak and interlayer stress transfer is poor. Interestingly, in this study, the interlayer strain that was transferred from the bottom to top graphene layers is only about half of the interfacial strain that was transferred from the polymer substrate to the bottom graphene layer. In a recent study, it was found that stress can be transferred within few-layer graphene with a ladder-like morphology effectively as all the layers adhere to the surrounding polymer and interlayer slippage is suppressed.130
In contrast to graphene, the effective Young's modulus of h-BN does not decrease with increasing layer number and this suggests a major advantage in using h-BN in polymer nanocomposites.100,131 Androulidakis et al.100 studied the stress transfer in a few-layer h-BN/SU-8/PMMA system. The E2g+ and E2g− (E2g+ mode is perpendicular to the applied strain and E2g− is parallel to the applied strain) band shifts are −8.3, −7.7, −9.8 cm−1/% and −24.2, −23.7, −27.1 cm−1/% for the number of layers ranging from 2 to 4 (Fig. 11a and b), respectively. This shows that the layers are strongly bonded and few-layer h-BN is strained as a whole unit, contrary to what is observed in graphene, as a result of the high sliding energy of h-BN, a finding identical to that concluded from AFM indentation experiments.17 Moreover, the interlayer stress transfer efficiency of h-BN was determined to be 0.99 as shown in Fig. 11c, which is much higher than graphene (0.6–0.8).131 These findings indicate that multilayer h-BN can be considered to be more effective than multilayer graphene for the reinforcement of polymers. In another study, the interlayer stress transfer efficiency of few-layer MoS2 was derived through layer-dependent PL spectroscopy as shown in Fig. 11d.115 The value of interlayer stress transfer efficiency was in the range of 0.76–0.86, higher than the value of graphene but lower than that of h-BN. The Raman peak shifts of few-layer BP were observed by Li et al.132 for BP nanosheets sandwiched between PMMA and SU8 and subjected to uniaxial strain. The Raman shift rate of the B2g mode was −11 cm−1/% strain whereas the strain transfer coefficient was not confirmed.
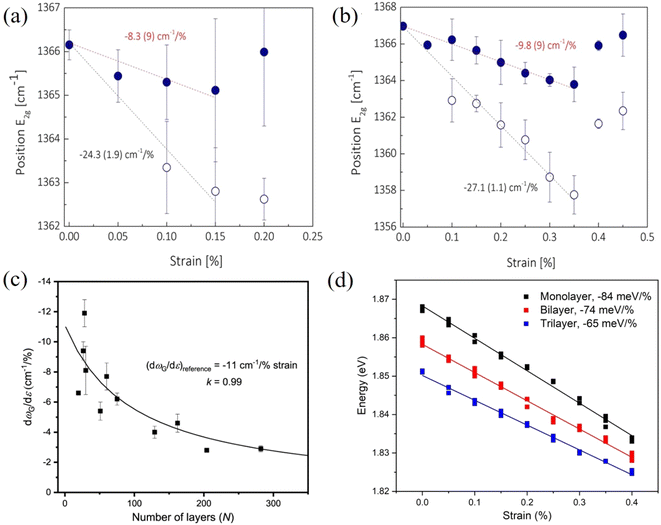 | ||
| Fig. 11 Raman G peak shifts of (a) bilayer and (b) four-layer h-BN under uniaxial tension. Reproduced with permission from ref. 100. Copyright 2018 American Physical Society. (c) Raman G band shift rate of h-BN as a function of layer number. Reproduced with permission from ref. 131. Copyright 2021 IOP Publishing Ltd. (d) Evolution of the PL A peak of monolayer, bilayer and trilayer MoS2 with strain. Reproduced with permission from ref. 115. Copyright 2023 Elsevier. | ||
The parameters governing interfacial and interlayer stress transfer mechanisms of 2D materials within a polymer matrix are summarized in Table 2. Firstly, the interfacial shear strength values for different 2D materials in combination with different polymers (SU8, PMMA and PET) generally fall within the same order of magnitude. This is not surprising since interfacial stress transfer takes place primarily through van der Waals interactions and the effect of polymer or nanosheet chemical structure appears to be minimal. Secondly, chemical functionalization and wrinkled structures are effective ways to improve the interfacial shear strength at the expense of degrading the intrinsic mechanical properties of 2D materials. A balance should therefore be achieved between an increased shear strength and the degraded mechanical properties. Thirdly, the interlayer stress transfer efficiency plays a vital role in reinforcing polymer nanocomposites with 2D nanofillers in view of the fact that monolayer materials are not likely to be used commercially to reinforce bulk nanocomposites.
| 2D materials | Layers | Polymer | Applied strain (%) | Interfacial shear strength (MPa) | Critical length (μm) | Interlayer transfer efficiency | Ref. |
|---|---|---|---|---|---|---|---|
| f-Graphene: functionalized graphene; w-graphene, wrinkled graphene. | |||||||
| Graphene | 1 | SU8/PMMA | 0.4–0.6 | 0.3–2.3 | 3 | — | 19 |
| Graphene | 1 | PET | 1.2–7.0 | 0.46–0.69 | — | — | 20 |
| Graphene | 2 | SU8/PMMA | 0.4 | 0.15 | — | 0.6–0.8 | 128 |
| Graphene | 1 | SU8/PMMA | 1.6 | 0.2–0.5 | 10 | — | 133 |
| 2 | SU8/PMMA | 1.5 | 0.2–0.5 | 15–22 | — | ||
| 3 | SU8/PMMA | 1.6 | 0.2–0.5 | 22–30 | — | ||
| Graphene ribbon | 1 | PMMA | 1.0 | 0.3 | 0.5–1 | — | 117 |
| w-Graphene | 3 | SU8/PMMA | 0.8 | 0.75 | ≥20 | — | 122 |
| f-Graphene | 1 | PMMA | 0.6 | 1.7 | 5.4 | — | 125 |
| WS2 | 1 | SU8/PMMA | 0.35–0.55 | 1.1–1.5 | 4 | — | 107 |
| Ti3C2Tx | 1 | PMMA | 0.4 | 3–4 | — | — | 108 |
| h-BN | 50 | PMMA | 0.1–0.3 | 3.8–9.4 | 6 | 0.99 | 131 |
| MoS2 | 1 | PMMA | 0.7 | 0.26–0.28 | 9 | — | 115 |
| 2 | PMMA | 0.9 | 0.24–0.29 | 14 | 0.86 | ||
3.4. Stacking, scrolling and folding in model nanocomposites
Compared to the top-down methods for the preparation of 2D nanosheets, one major advantage of the bottom-up CVD synthesis method is that the process is highly controllable. The continuous stacking of CVD grown nanosheets onto highly-ordered layered structures provides opportunities to model and study experimentally the mechanical properties of nanocomposites containing numerous nanosheets. Further processing of the stacked nanocomposites, such as cutting, scrolling and folding, can modify their mechanical performance.134–137 Stacked CVD graphene-based laminates and scrolled fibres were firstly studied by Vlassiouk et al.134 and then by Liu et al.135 Vlassiouk et al.134 fabricated (graphene/PMMA)16 (subscript represents layer number) laminates and subsequently scrolled the laminates into fibres. The addition of 0.13 vol% of graphene increased the PMMA modulus by a factor of three, but the strength increased by only a quarter. This corresponds to an effective modulus and strength of 1.2 ± 0.5 TPa and 11 ± 6.7 GPa according to the rule of mixtures, indicating effective stiffness reinforcement but poorer strength reinforcement. The enhancement is due to polymer orientation at the interface instead of efficient load transfer between graphene and PMMA. The effective strength of graphene in the fibres was calculated to be 19 ± 9 GPa, (a reduced value due to defects in the fibres from and fracture of the nanosheets during scrolling). This indicates that the theoretical and experimental values of the strength of graphene of about 130 GPa cannot be easily realised in practical applications such as nanocomposites. Liu et al.135 fabricated very similar (graphene/polycarbonate (PC))8 up to (graphene/PC)320 laminates and fibre structures as shown in Fig. 12, with the graphene volume fractions ranging from 0.003 to 0.185%. The effective modulus of graphene was estimated to be in the order of 360 GPa and 500 GPa for the laminates and fibres, respectively. The atomic thinness of monolayer CVD graphene and its extremely large aspect ratio maximize the reinforcement. These highly interesting studies demonstrate sophisticated methods to prepare nanocomposites with uniformly-distributed nanosheets to take advantage of the unique properties of monolayer 2D nanosheets and approach the theoretical modulus values. It is possible that such nanocomposite assemblies might in the future be used for structural and functional applications but it should be noted that at present, the stacking process is time-consuming which makes it difficult to produce and use such assemblies used in bulk, practical applications. The development of the R2R process mentioned in section 2.1.2 or an automated CVD transfer process may be promising routes to upscale this family of model nanocomposites. In a recent study, a scalable manufacturing approach, the float-stacking strategy, was proposed to fabricate graphene/PMMA laminates.138 The graphene/PMMA membrane was initially floated on a water–air interface after etching the copper foil. Then, the membrane was stacked layer-by-layer by a roller, followed by a hot-rolling mill process to fabricate the laminate. Using this method, monolayer graphene was well-aligned in the polymer matrix and the effective Young's modulus of graphene was calculated to be 1.09 TPa. According to the authors, the heat-treatment eliminated wrinkles and voids on the surface and interlayer and increased the conformal contact of graphene and PMMA; this maximized the reinforcing efficiency of graphene. It should be noted though that the specific work has received considerable criticism from Ruoff and coworkers139 who argued that the reported enhancement in the Young's modulus and strength of the graphene-reinforced laminated was mainly result of the heat treatment rather than the actual presence of graphene. In the same work, it was mentioned that the hot rolling process introduces a considerable amount of cracks and defects in graphene, which should reduce its reinforcing efficiency.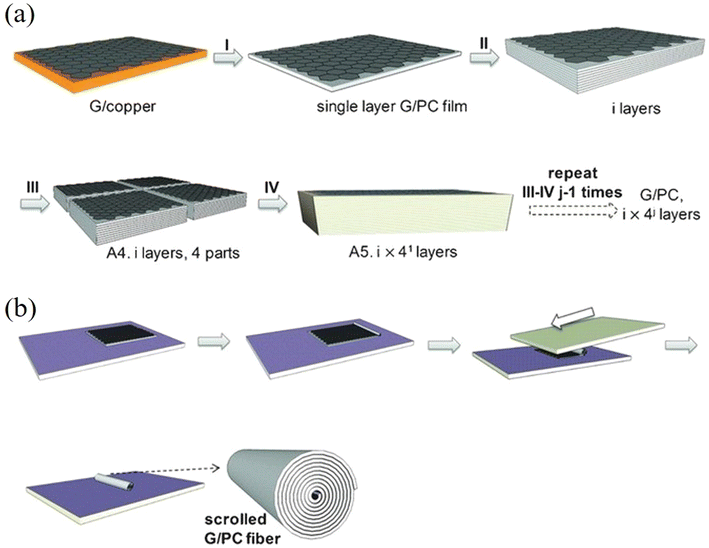 | ||
| Fig. 12 (a) Stacking and cutting of layered graphene/PC composites. (b) Scrolling of layered graphene/PC composites. Reproduced with permission from ref. 135. Copyright 2016 AAAS. | ||
4. Bulk nanocomposites
4.1. Preparation
Even though the intrinsic mechanical properties of 2D materials are excellent both in their monolayer and few-layer forms, it is challenging to achieve their full potential in the mechanical reinforcement of polymer nanocomposites. The mechanical performance of the final nanocomposites depends strongly on the dispersion and orientation of the 2D materials in the matrix, and a homogeneous distribution of the fillers can improve the mechanical behaviour significantly. A number of approaches have been proposed to prepare high-performance nanocomposites, including physical mixing, in situ polymerization, layer-by-layer (LBL) assembly, evaporation, filtration and freeze casting.![[thin space (1/6-em)]](https://www.rsc.org/images/entities/char_2009.gif) 141 and MXenes.142 A typical example is the work of Eksik et al.143 who prepared MoS2/epoxy nanocomposites containing 0.2 wt% MoS2 using solution casting as shown in Fig. 13. The bulk MoS2 was exfoliated to monolayer and few-layer flakes via sonication in 1-vinyl-2 pyrrolidone. The epoxy was then added to the solvent and after a series of mixing steps the epoxy-MoS2 nanocomposite was produced. It was found that low nanofiller loading fractions can improve the mechanical properties of the epoxy composites significantly. The fracture energy increased from 230 J m−2 for the epoxy matrix to 600 J m−2 and the fracture toughness increased from ∼1 MPa m1/2 to ∼1.6 MPa m1/2. Despite its simplicity, solution casting has a number of drawbacks. The use of toxic solvents can pose environmental hazards. Achieving a homogeneous dispersion of high-content fillers (e.g., over 10 wt%) in the matrix through simple mixing is difficult. Additionally, controlling the orientation of the fillers within the matrix presents a significant challenge. Finally, for thicker nanocomposites, sedimentation of the fillers is also an issue that also needs to be considered.
141 and MXenes.142 A typical example is the work of Eksik et al.143 who prepared MoS2/epoxy nanocomposites containing 0.2 wt% MoS2 using solution casting as shown in Fig. 13. The bulk MoS2 was exfoliated to monolayer and few-layer flakes via sonication in 1-vinyl-2 pyrrolidone. The epoxy was then added to the solvent and after a series of mixing steps the epoxy-MoS2 nanocomposite was produced. It was found that low nanofiller loading fractions can improve the mechanical properties of the epoxy composites significantly. The fracture energy increased from 230 J m−2 for the epoxy matrix to 600 J m−2 and the fracture toughness increased from ∼1 MPa m1/2 to ∼1.6 MPa m1/2. Despite its simplicity, solution casting has a number of drawbacks. The use of toxic solvents can pose environmental hazards. Achieving a homogeneous dispersion of high-content fillers (e.g., over 10 wt%) in the matrix through simple mixing is difficult. Additionally, controlling the orientation of the fillers within the matrix presents a significant challenge. Finally, for thicker nanocomposites, sedimentation of the fillers is also an issue that also needs to be considered.
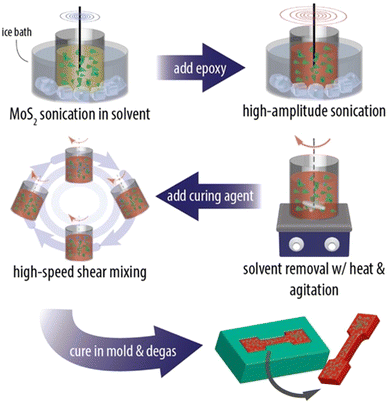 | ||
| Fig. 13 Solution casting method for the preparation of MoS2/epoxy composites. Reproduced with permission from ref. 143. Copyright 2014 American Chemical Society. | ||
Mechanical mixing, utilising high shear forces to disperse 2D materials in the matrix, is an alternative method to prepare polymer nanocomposites.144,145 Compared to solution casting, this method can avoid the use of toxic solvents and is more suitable for large-scale production. One example of a mechanical mixing process is the three-roll milling technique, in which shear forces generated by rollers can disperse 2D materials such as graphene,144,145 hybrid MoS2/h-BN146 and MXene nanoplatelets147 in the matrix. The drawbacks of mechanical mixing include difficulties in dispersing high filler contents homogeneously as a result of viscosity increase and a possible reduction in filler lateral size due to high shear forces.
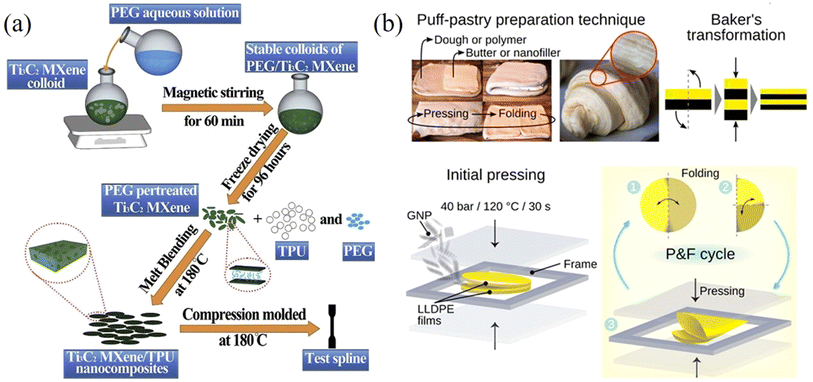 | ||
| Fig. 14 (a) Melt mixing method for the preparation of MXene/TPU composites. Reproduced with permission from ref. 149. Copyright 2019 Elsevier. (b) Puff-pastry preparation inspired pressing-and-folding method and illustration of this method for the fabrication of a GNP/LLDPE composite film. Reproduced with permission from ref. 155. Copyright 2018 America Chemical Society. | ||
A press-and-folding (P&F) method inspired by puff-pastry preparation has been used to fabricate 2D nanosheets/polymer nanocomposites. Santagiuliana et al.155 prepared graphene nanoplatelets (GNPs)/linear-low density polyethylene (LLDPE) composite films using the P&F method illustrated in Fig. 14b. The GNPs were added to the middle of two LLDPE films to form a sandwich structure. The sandwich structure was then hot-pressed and folded twice and the P&F process was repeated several times to prepare the composites. The mechanical properties of the composites improved significantly with the increase of the number of P&F cycles due to a more homogeneous distribution of the GNPs in the composites. For example, the elastic modulus reinforcement was more than doubled after 500 P&F cycles compared to the unmodified nanocomposite. This study shows that P&F is an effective method to improve the dispersion of nanofillers in nanocomposites and therefore optimise their mechanical properties.
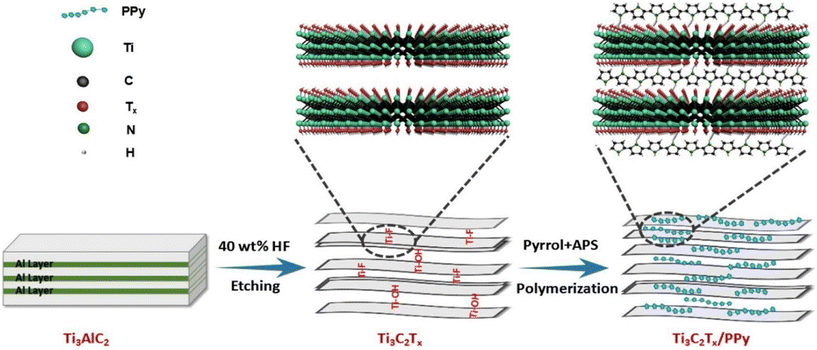 | ||
| Fig. 15 In situ polymerization for the preparation of Ti3C2Tx/polypyrrole (PPy) composites. Reproduced with permission from ref. 157 Copyright 2018 Elsevier. | ||
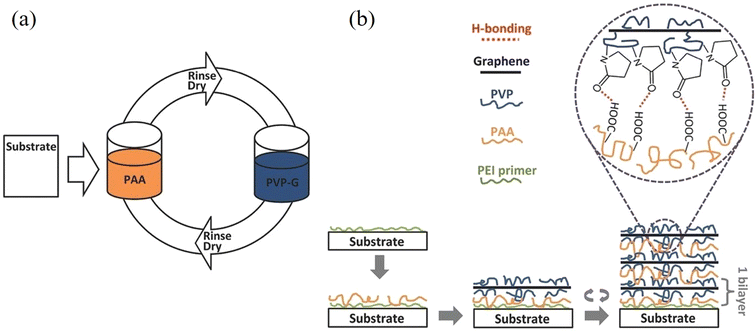 | ||
| Fig. 16 Layer-by-layer assembly for the preparation of graphene/polymer composites. Reproduced with permission from ref. 163. Copyright 2016 Wiley-VCH Verlag GmbH & Co. KGaA. | ||
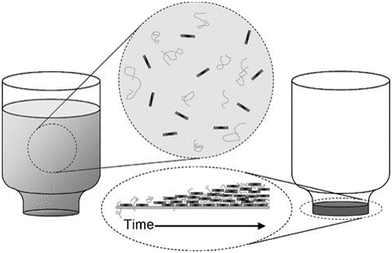 | ||
| Fig. 17 Vacuum filtration for the preparation of GO/PVA and GO/PMMA nancomposites. Reproduced with permission from ref. 165. Copyright 2010 Wiley-VCH Verlag GmbH & Co. KGaA. | ||
4.2. Mechanisms of reinforcement
When subjected to uniform homogeneous strain, the rule of mixtures can be used to describe the Young's modulus of the bulk nanocomposites Ec as
| Ec = EfVf + EmVm | (10) |
By taking the orientation and the aspect ratio of the fillers into consideration, eqn (10) can be modified as
| Ec = ηoηlEeffVf + EmVm | (11) |
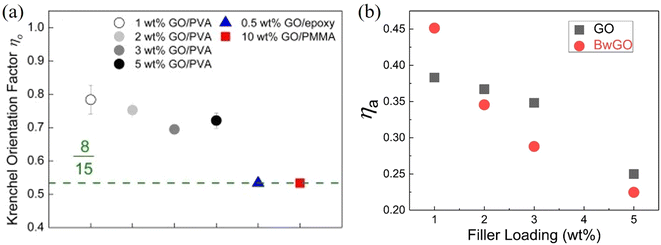 | ||
| Fig. 18 (a) Krenchel orientation factors of GO/PVA, GO/epoxy and GO/PMMA nanocomposites. Reproduced with permission from ref. 167. Copyright 2016 Elsevier. (b) Variations of agglomeration factor with GO and BwGO (the functional groups of GO were partially removed by base wash) filler loadings. Reproduced with permission from ref. 170. Copyright 2018 Elsevier. | ||
Meanwhile, agglomeration is very important in controlling mechanical properties. The rule of mixtures will fail to describe the behaviour of polymer nanocomposites if agglomeration is extensive, especially at high loadings. Li et al.170 proposed to include an agglomeration factor ηa to the modified rule of mixtures to account for the effect of agglomeration on the modulus of composites such that:
| Ec = ηoηlEeffηaVf + EmVm | (12) |
If no agglomeration takes place during the preparation of composites (ηa = 1), the effective volume fraction of fillers will be high and good stress transfer can be obtained. Otherwise, an increase in agglomeration will degrade the reinforcement significantly. The agglomeration factor generally decreases with an increase in filler loading. Even though BwGO (the functional groups of GO were partially removed by base washing) shows a better dispersion at low loadings, its agglomeration factor declines faster compared to that for GO due to the reduction of the number of functional groups (Fig. 18b). Following the shear-lag theory in section 3.1, the length factor can be determined by
 | (13) |
Recently, Young et al.171 evaluated the effect of aspect ratio, order of alignment and Young's modulus of nanosheets on the efficiency of reinforcement, based on the shear-lag theory and the rule of mixtures. Substituting eqn (13) into the expression for the modulus of fillers
 | (14) |
For flexible matrices (small ns), eqn (14) is expressed as
 | (15) |
Then, inserting the equations  and
and  into eqn (15), the Young's modulus of the filler becomes
 | (16) |
Quite interestingly, this equation predicts that the modulus of fillers is proportional to the modulus of the matrix and independent of the modulus of the nanofiller. Substituting eqn (16) into eqn (10), the following equation can be obtained
 | (17) |
This expression reveals that the modulus of the final composites is independent of the modulus of the nanofillers, while it is dependent on the modulus of the matrix, the aspect ratio and the volume fraction of the fillers. As can be seen from Fig. 19a, eqn (17) works well for a number of polymer matrices with varying degrees of stiffness. Additionally, the modulus of the nanofillers derived from Raman 2D modes show good agreement with the theoretical predictions after using the equation ER = Egr[(∂ω2D/∂ε)/(∂ω2D/∂ε)ref] as stated in section 3.3.
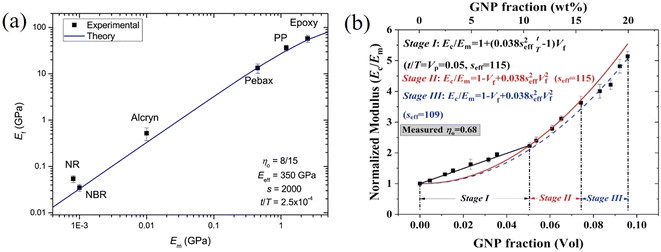 | ||
| Fig. 19 (a) Variation of the modulus of graphene nanoplatelets (GNPs) with the modulus of the matrices (dots: experiment data; blue line: theory predictions from eqn (16) and (19)). Reproduced with permission from ref. 171. Copyright 2018 Elsevier. (b) Three stages for the reinforcement of GNPs on elastomers. Reproduced with permission from ref. 153. Copyright 2019 Elsevier. | ||
More recently, the effects of the volume fraction of the fillers on the mechanical reinforcement of elastomers were studied further and the concept of a mechanical percolation threshold volume fraction Vp was proposed, above which the stiffness increases significantly from the interaction of neighbouring fillers, while below Vp, the rate of increase is much smaller as a result of the contributions of individual fillers.153 For volume fractions of filler (Vf) below Vp, the shear-lag interfacial parameter t/T can be approximated to be equal to Vp and the following equation is obtained by substituting eqn (16) into eqn (10)
 | (18) |
 | (19) |
According to eqn (18) and (19), the reinforcement process can be divided into three stages with increasing filler loading as shown in Fig. 19b. For the first stage of reinforcement (Vf < Vp), there is no interaction between individual fillers and the interfacial parameter t/T is proportional to Vp. For the second stage (Vf > Vp), the interaction between fillers starts to increase and the reinforcement is quadratically related to the volume fraction, as described by eqn (19). For the final stage of reinforcement, at the highest levels of filler content, agglomeration occurs and the reinforcing efficiency is reduced, as can be seen from the reduction of the effective aspect ratio. The good agreement between the theory and experimental data in Fig. 18c validates the accuracy of eqn (18) and (19) in the prediction of mechanical reinforcement of elastomers.
 | (20) |
 | (21) |
 | (22) |
 | (23) |
 | (24) |
Generally, low filler loadings can reinforce polymer nanocomposites effectively, while the use of fillers at high contents decreases the reinforcing efficiency due to the tendency of the fillers to agglomerate. With the current progress in preparation strategies that are presented in literature, polymer nanocomposites with well-dispersed fillers at high contents have been successfully fabricated and very large improvements of the mechanical properties of a wide range of polymers have been reported.
4.3. Mechanical properties
As can be understood from the previous sections, a number of factors can affect the reinforcing efficiency and the final mechanical performance of the bulk nanocomposites; these include the aspect ratio, the orientation, the agglomeration and volume fraction of the fillers, the interfacial interaction between the fillers and the matrices and the modulus of the matrix. Considering the large family of 2D materials, it is highly desirable to investigate the levels of mechanical reinforcement that can be obtained from different 2D nanosheets. A large number of polymer nanocomposites based on different 2D nanofillers are reviewed in the following section.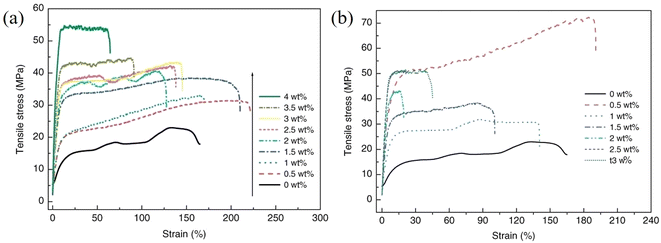 | ||
| Fig. 20 Variations of stress–strain curves with filler loading for (a) GO/PVA and (b) rGO/PVA nanocomposites, respectively. Reproduced with permission from ref. 175. Copyright 2011 Wiley-VCH Verlag GmbH & Co. KGaA. | ||
In addition to the effects of functionalization and agglomeration, it is interesting to examine the relationship between the effective mechanical reinforcement and modulus of the matrix. Papageorgiou et al.16 extracted the Young's modulus Ef (using eqn (10)) of GNP, GO and rGO from a large number of polymer nanocomposites with various values of matrix stiffness, as shown in Fig. 21. As an update, the data released after 2017 (derived from Table 3) are added to Fig. 21. Even though considerable scatter exists in the data as a result of numerous factors including orientation, agglomeration, aspect ratio, filler functionalization etc., the Young's modulus of graphene-based nanocomposites was found to increase linearly with the increase of the modulus of the matrix. For soft matrices, the low shear modulus of the polymers leads to ineffective stress transfer between the filler and the matrix and subsequently poor mechanical reinforcement. This is why the exceptional properties of 2D materials cannot be fully realised in elastomers even though the apparent percentage (%) increases over those of the elastomer matrix are usually impressive even at low filler contents. This conclusion is important for the study of the mechanical reinforcement from graphene in polymer nanocomposites and provides guidance for the application of other 2D nanosheets in polymer nanocomposites.
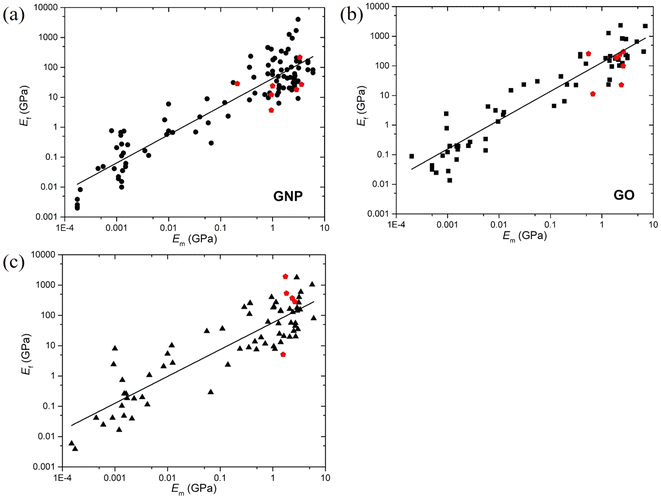 | ||
| Fig. 21 Variations of the Young's modulus of (a) GNP, (b) GO and (c) rGO with the modulus of matrices. The red dots correspond to new data published after 2017 and provide an update to the previous figure presented in ref. 16. Reproduced with permission from ref. 16. Copyright 2017 Elsevier. | ||
| Filler | Matrixa | Processing method | Matrix modulus (GPa) | Optimum filler fraction | Increase (%) | Ref. | ||
|---|---|---|---|---|---|---|---|---|
| Young's modulus | Tensile strength | Fracture toughness | ||||||
| a PLA, polylactic acid; PS, polystyrene; PVC, poly(vinyl chloride); PP, polypropylene; PI, polyimide; PVDF, polyvinylidene fluoride; CS, chitosan; HDPE, high-density polyethylene; PEEK, poly(ether ether ketone); PA6, polyamide 6; GF, graphene fluoride; ABS, acrylonitrile butadiene styrene, ANF, aramid nanofiber. When more than one optimum filler fractions are mentioned, they correspond to the optimum filler fractions for improvement of modulus, strength and toughness, sequentially. | ||||||||
| f-rGO | PMMA | In situ polymerization | 3.12 | 1 wt% | 42 | 15 | — | 182 |
| f-GNP | PMMA | Solution casting | 1 | 2 wt% | 24 | 20 | — | 183 |
| GO | PMMA | Vacuum filtration | 0.67 | 75 wt% | 1019 | 1116 | — | 165 |
| rGO | Epoxy | Solution casting | 2.91 | 0.2 wt% | 6 | 7 | 51 | 178 |
| GNP | Epoxy | Solution casting | 3.75 | 3 wt% | — | — | 109 | 179 |
| GO | Epoxy | Solution casting | 3 | 0.1, 0.5, 1 wt% | 12 | 13 | 63 | 184 |
| GO | Epoxy | Solution casting | 1.92 | 0.75, 0.5 wt% | 40 | 3 | — | 185 |
| GO | Epoxy | Solution casting | 2.62 | 0.5 wt% | 31 | 52 | — | 186 |
| rGO | Epoxy | Solution casting | 2.62 | 0.5 wt% | 28 | 31 | — | 186 |
| rGO | Epoxy | Solution casting | 1.82 | 0.3 wt% | 47 | 47 | — | 187 |
| rGO | Epoxy | Freeze casting | — | 1 wt% | — | — | 314 | 188 |
| f-GNP | Epoxy | Solution casting | 3.35 | 2 wt% | 71 | 23 | 124 | 189 |
| GNP | Epoxy | Solution casting | 2.89 | 78 wt% | 411 | — | – | 190 |
| GNP | Epoxy | Solution casting | — | 5 wt% | — | — | 51 | 191 |
| GO | PVA | Vacuum filtration | 2.6 | 50 wt% | 1300 | 186 | — | 165 |
| GO | PVA | Vacuum filtration | 2.1 | 5, 3 wt% | 190 | 69 | — | 192 |
| f-rGO | PVA | Solution casting | 2.34 | 1 wt% | 82 | 48 | — | 193 |
| GO | PVA | Solution casting | 0.12 | 3 vol% | 990 | 166 | — | 194 |
| rGO | PVA | Solution casting | 1.74 | 0.1, 0.3 wt% | 55 | 48 | — | 195 |
| f-GO | PLA | Solution casting | 1.9 | 0.2, 0.2, 0.6 wt% | 19.2 | 58 | 384 | 196 |
| f-GO | PS | Solution casting | 1.45 | 0.9 wt% | 57.2 | 69.5 | — | 197 |
| GO | PS/PMMA | In situ polymerization | 2.24 | 0.25 wt% | 14 | 11 | — | 198 |
| GNP | PVC | Solution casting | 0.8 | 2 wt% | 58 | 130 | — | 199 |
| rGO | PP | Melt mixing | 1.02 | 0.42 vol% | 74 | 75 | — | 200 |
| f-GNP | PI | In situ polymerization | 2.3 | 3 wt% | 610 | 84 | — | 201 |
| f-GO | PI | In situ polymerization | 0.55 | 1 wt% | 257.2 | 58 | — | 202 |
| GO | PVDF | Solution casting | 1.4 | 2 wt% | 192 | 92 | — | 203 |
| f-rGO | PVDF | Solution casting | 1.0 | 5, 1 wt% | 585 | 317 | — | |
| GO | CS | Solution casting | 1.32 | 1 wt% | 64 | 122 | — | 204 |
| GO | CS | Vacuum filtration | 2.4 | 95 wt% | 842 | 391 | — | 205 |
| GNP | HDPE | Melt mixing | 0.95 | 10 wt% | 56 | 23 | — | 206 |
| GNP | PEEK | Melt mixing | 3.61 | 10 wt% | 44 | – | — | 207 |
| GNP | PA6 | Melt mixing | 1.2 | 20 wt% | 412 | 54 | — | 208 |
| GO | Silk | Layer by layer | 9.5 | 23.5 vol% | 1426 | 200 | — | 209 |
| GNP | Cellulose | Vacuum filtration | 0.945 | 50 wt% | 137 | 33 | — | 210 |
| f-GNP | ABS | Solution casting | 0.21 | 1 wt% | 60 | 18 | 107.1 | 211 |
| rGO | ANF | Vacuum filtration | 1.57 | 50 wt% | 125 | −19 | — | 212 |
Fracture toughness is another important mechanical property affected by the addition of nanofillers to composites.176,177 Tang et al.178 investigated the effects of nanofiller dispersion on the fracture toughness of graphene/epoxy nanocomposites prepared by solution casting. Ball milling was used to generate high shear stress to prevent agglomeration and improve dispersion of reduced GO (rGO) nanosheets, while the samples not processed by ball milling were found to be poorly-dispersed. It should be kept in mind, however, that high-energy milling procedures over long time periods can lead to a significant reduction of the aspect ratio of the fillers and as a consequence to poorer effective mechanical properties. The fracture toughness of the poorly-dispersed and well-dispersed composites was found to be increased by about 24% and 52%, respectively, upon the addition of 0.2 wt% rGO, as shown in Fig. 22a. This study shows once again the importance of the dispersion of fillers in the improvement of the fracture toughness of composites. To further promote the dispersion of fillers, carboxyl terminated butadiene acrylonitrile (CTBN) was used and the effects of CTBN on the mechanical and thermal properties of graphene/epoxy nanocomposites were studied.179 The addition of CTBN can suppress the debonding between the flakes and the epoxy. Compared to the neat epoxy, the fracture toughness of the CTBN/epoxy composites was improved by ∼70% with 10 wt% CTBN. The optimal loading of graphene was achieved at 3 wt% loading for which the fracture toughness of the epoxy was more than doubled. The mechanisms whereby the GNPs can affect crack propagation are illustrated in Fig. 22c: (1) crack deflection and layer breakage; (2) separation between GNP layers; and (3) crack penetration and layer breakage.
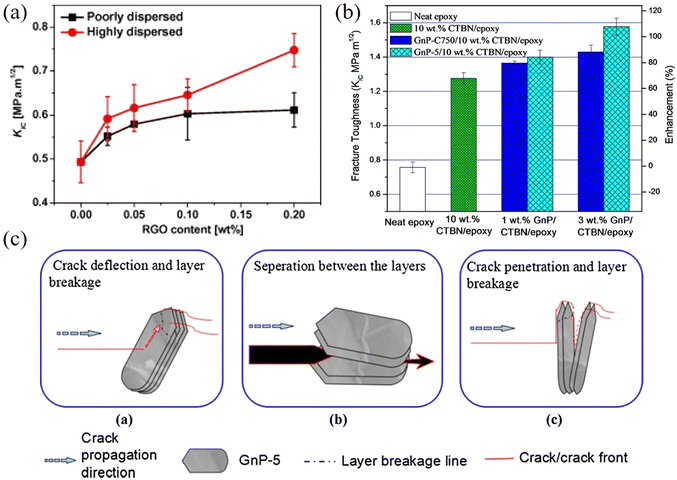 | ||
| Fig. 22 (a) Variations of KIC of rGO/epoxy nanocomposites with rGO loading. Reproduced with permission from ref. 178. Copyright 2013 Elsevier. (b) Effects of CTBN and GNP on the fracture toughness of epoxy composites. (c) Crack propagation in GnP-5 flakes. Reproduced with permission from ref. 179. Copyright 2016 Elsevier. | ||
Another intriguing concept for the utilisation of the geometry of the 2D fillers is the fabrication of nacre-type composites.164 Nacre has high strength and toughness, which has been attributed to its hierarchical structure and abundant interfacial interactions. This has motivated researchers to construct nanocomposites with nacre-like microstructures to improve their mechanical properties.164 Compared to graphene, GO is more advantageous in the improvement of tensile strength as the surface functional groups enable the formation of strong interlayer bonds. Li et al.180 prepared GO/PVA composites with nacre-like structures using solution casting, while rGO/PVA composites were prepared by the reduction of the original GO/PVA composites (Fig. 23a). The stress–strain curves of the composites fabricated are shown in Fig. 23b. The Young's modulus and tensile strength were found to be 11.4 GPa and 118.0 MPa for GO/PVA nacre-composites, significantly higher than the values of 4.1 GPa and 67.1 MPa for the neat GO films. The tensile strength increased to 188.9 MPa and the Young's modulus decreased slightly to 10.4 GPa for rGO/PVA composites. The improvements in mechanical properties are thought to be due to the formation of hydrogen bonds and the hierarchical structure between the GO (or rGO) and PVA. When the composites are subjected to tension, the weak vdW bonds will break first and with an increase in loading, and the hydrogen bonds will also break. More energy is required to fracture the composites with enhanced hydrogen and oxygen bonds and therefore tensile strength is improved. In summary, a hierarchical structure and strong interlayer bonds are two key factors that can be tuned to improve the mechanical properties of the nanocomposites. Different methods such as vacuum filtration and freezing have been used to prepare polymer nanocomposites based on graphene derivatives.165,181
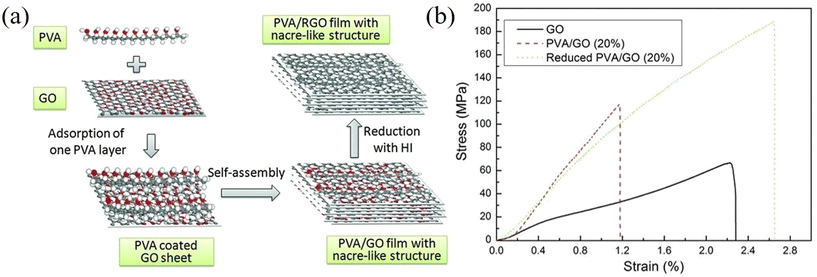 | ||
| Fig. 23 (a) Preparation of GO/PVA and rGO/PVA composites with nacre-like structures. (b) Stress–strain curves of GO films, GO/PVA and rGO/PVA composites. Reproduced with permission from ref. 180. Copyright 2012 Wiley-VCH Verlag GmbH & Co. KGaA. | ||
In order to enhance the mechanical performance of BN-based composites, different surface functionalization strategies, including physical and chemical functionalization,214 have been applied in a number of studies. For example, Kim et al.215 functionalized the BNNSs non-covalently with 1-pyrenebutyric acid (PBA) molecules and prepared BNNS/epoxy nanocomposites by solution blending, as seen from Fig. 24a–d. Compared to the neat epoxy, the addition of 0.3 wt% BNNSs led to an improvement of Young's modulus and tensile strength from 2.7 to 3.3 GPa and from 46.7 to 71.9 MPa, corresponding to increases of 21% and 54%. Significantly, the fracture toughness of the composites was improved from 0.7 to 1.5 MJ m−3. These significant improvements in the mechanical properties were attributed to the increased surface area and good stress transfer, as π–π interactions were established between the PBA molecules and BN nanosheets. In another study, the effects of non-covalent functionalization on the storage modulus of h-BN/bisphenol E cyanate ester (BECy) composites were investigated, as shown in Fig. 24e.216 At 10 vol% loading, dopamine-treated h-BN composites show better reinforcement than pristine h-BN; while at 15 vol% loading, the performance of dopamine-treated h-BN samples was worse compared to pristine h-BN. The storage modulus of the composites at 25 °C was improved significantly from 2.0 to 7.1 GPa with 15 vol% of untreated h-BN. This shows the importance of controlling the degree of functionalization and the loading of fillers, as discussed in Section 3.2. There is a balance between the effect of improved dispersion as well as the better interfacial interactions upon the ultimate mechanical properties of nanocomposites, due to functionalization of the nanofillers.
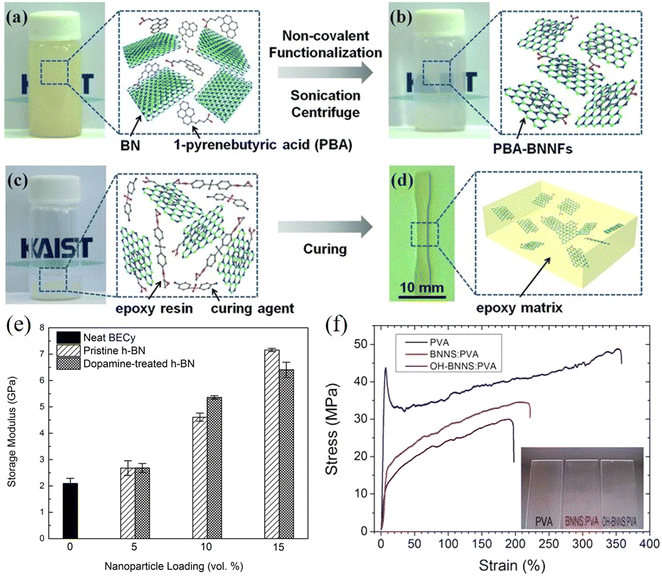 | ||
| Fig. 24 (a–d) Non-covalent functionalization of h-BN and solution blending for the preparation of h-BN/epoxy composites. Reproduced with permission from ref. 215. Copyright 2013 Wiley-VCH Verlag GmbH & Co. KGaA. (e) Variations of storage modulus at 25 °C of BNNS/BECy composites with nanoparticle loading. Reproduced with permission from ref. 216. Copyright 2015 American Chemical Society. (f) Stress–strain curves of BNNS/PVA composites. Reproduced with permission from ref. 217. Copyright 2012 American Chemical Society. | ||
Covalent functionalization has been used to improve the mechanical performance of h-BN-based nanocomposites. Sainsbury et al.217 covalently functionalized BNNSs and prepared hydroxyl-functionalized BNNS (OH-BNNS) and isocyanate-functionalized BNNS (i-BNNS). The stress–strain curves of such BNNS/PVA composites are shown in Fig. 24f. Compared to the neat PVA, the Young's modulus and tensile strength of the OH-BNNS/PVA composites were respectively increased from 0.4 to 1.1 GPa and from 30 to 49 MPa with only 0.1 wt% filler. Several factors contributed to the improvements in the mechanical properties of the nanocomposites. The lateral size of the exfoliated BN nanosheets was as large as 2 to 3 μm which is beneficial for stress transfer, while the covalent functionalization and the uniform alignment promoted the performance of the h-BN nanosheets in matrices. Recently, Liu et al.218 covalently functionalized BNNSs using (3-aminopropyl) triethoxysilane (APTES) and fabricated APTES-BNNS/epoxy nanocomposites by solution blending. Compared with the neat epoxy, the storage modulus of the nanocomposites filled with 10 wt% of APTES-BNNSs at 35 °C was increased from 1.5 GPa to 4.3 GPa.
Apart from surface functionalization, different preparation and alignment approaches have been used to fabricate BNNS-based composites displaying homogeneous dispersion. Hu et al.219 prepared h-BN/epoxy nanocomposites via hot pressing the mixture of BNNS and epoxy at 150 °C and under a pressure of 10 MPa. This fabrication strategy was found to improve the orientation of BN in an epoxy matrix significantly. For the neat matrix, the elastic modulus, tensile strength and fracture toughness were measured to be 0.6 GPa, 23.6 MPa, and 0.87 MJ m−3. The maximum fracture toughness was found to be 1.1 MJ m−3 at 10 wt% h-BN loading, showing an increase of 33%; while the maximum tensile strength was 39.3 MPa with 30 wt% of h-BN nanosheets. Finally, the Young's modulus increased by more than 600% to 4.63 GPa with 50 wt% of aligned h-BN in comparison to the value of 1.48 GPa obtained from 50 wt% randomly oriented h-BN, as shown in Fig. 25a. As can be seen from the evaluation of individual mechanical properties as a function of filler loading, the tensile strength and fracture toughness are prone to be affected by the agglomeration of BNNSs and therefore reach their maximum values at lower loadings compared to Young's modulus. In another interesting study, a magnetic field was used to align BN nanosheets in epoxy matrix.220 The effects of alignment on the Young's modulus of the epoxy composites with 20 wt% h-BN are shown in Fig. 25b. Compared to the modulus of neat epoxy at 2.7 GPa, vertically-aligned composites (VmhBN-epoxy, z direction) show the highest elastic modulus at 4.55 GPa, while randomly-distributed (RmhBN-epoxy) and horizontally-aligned (VmhBN-epoxy, x–y direction) composites show similar modulus values (3.45 and 3.52 GPa). Overall, high degrees of orientation, induced by compressive or magnetic forces have been demonstrated to improve the mechanical properties of nanocomposites reinforced with BNNS effectively. The mechanical properties of BN-reinforced polymer nanocomposites are summarized in Table 4.
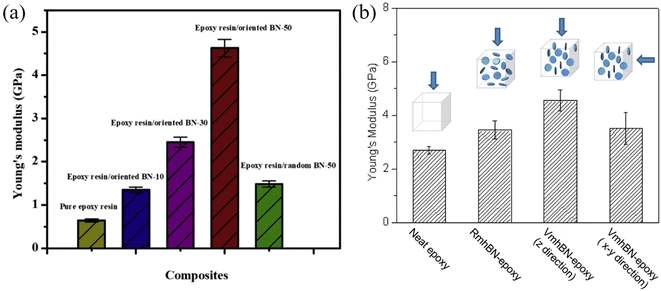 | ||
| Fig. 25 (a) Variation of the Young's modulus of the h-BN/epoxy nanocomposites with h-BN content. Reproduced with permission from ref. 219. Copyright 2018 Elsevier. (b) Variation of the Young's modulus of h-BN/epoxy nanocomposites with the orientation of h-BN. Reproduced with permission from ref. 220. Copyright 2013 American Chemical Society. | ||
| Filler | Matrixa | Processing method | Matrix modulus (GPa) | Optimum filler fraction | Increase (%) | Ref. | ||
|---|---|---|---|---|---|---|---|---|
| Young's modulus | Tensile strength | Fracture toughness | ||||||
| a PU, polyurethane; PE, polyethylene; UHMWPE, ultrahigh molecular weight polyethylene; SBR, styrene butadiene rubber; PA66, polyamide 66; PEN, polyarylene ether nitrile. | ||||||||
| BN | PMMA | Solution casting | 1.74 | 0.3 wt% | 22 | 11 | — | 213 |
| BN | PMMA | Solution casting | 2.2 | 3 wt% | 132 | — | — | 221 |
| f-BN | PMMA | Hot pressing | 0.739 | 0.5 wt% | 8.7 | — | 69.6 | 222 |
| f-BN | Epoxy | Solution casting | 2.749 | 0.3 wt% | 21 | 54 | 107 | 215 |
| BN | Epoxy | Hot pressing | 0.64 | 50, 30, 10 wt% | 623 | 66 | 30 | 219 |
| BN | Epoxy | Solution casting | 2.7 | 20 wt% | 68.5 | — | — | 220 |
| BN | Epoxy | Solution casting | — | 2 wt% | — | — | 121 | 223 |
| BN | Epoxy | Freeze casting | — | 2.08 vol% | — | — | 600 | 224 |
| f-BN | PVA | Solution casting | 0.378 | 0.1 wt% | 186 | 66 | 191 | 217 |
| BN | PVA | Solution casting | 2.5 | 0.12, 0.05 vol% | 36 | 33 | — | 225 |
| BN | PVA | Solution casting | 1.52 | 0.5 wt% | 39 | 27 | — | 226 |
| BN | PVA | Vacuum filtration | 0.053 | 27 vol% | 1221 | 83 | — | 227 |
| f-BN | PVA | Solution casting | 0.18 | 0.2 wt% | 73.6 | 109.3 | — | 228 |
| f-BN | PVA | Vacuum filtration | 0.4 | 60 wt% | 1800 | 110 | — | 229 |
| BN | PVC | Solution casting | 2 | 0.12 vol% | 37.5 | 60 | — | 230 |
| f-BN | PS | Melt mixing | 2.01 | 30 wt% | 23 | 82 | — | 231 |
| f-BN | PU | Solution casting | 0.19 | 0.1 wt% | 17 | 118 | 233 | 217 |
| BN | PE | Solution casting | 0.4 | 5 wt% | 64.1 | 26 | — | 232 |
| BN | UHMWPE | Solution casting | 3.01 | 11 wt% | 152 | — | — | 233 |
| BN | PVDF | Electrospinning | 0.002 | 1 wt% | 200 | 900 | 2614 | 234 |
| f-BN | PVDF | Electrospinning | 0.87 | 30 wt% | 24 | 151 | — | 235 |
| BN | PDMS | Solution casting | — | 28.6 wt% | — | 75 | 36 | 236 |
| f-BN | SBR | Mechanical mixing | 0.002 | 90 phr | 653 | 145 | — | 237 |
| BN | PA66 | Melt mixing | 2.6 | 20 wt% | 92 | 4 | — | 238 |
| BN | PEN | Solution casting | 2.637 | 5, 2 wt% | 11 | 16 | — | 239 |
| BN | ANF | Vacuum filtration | 2.81 | 70 wt% | 31.9 | 61.6 | — | 240 |
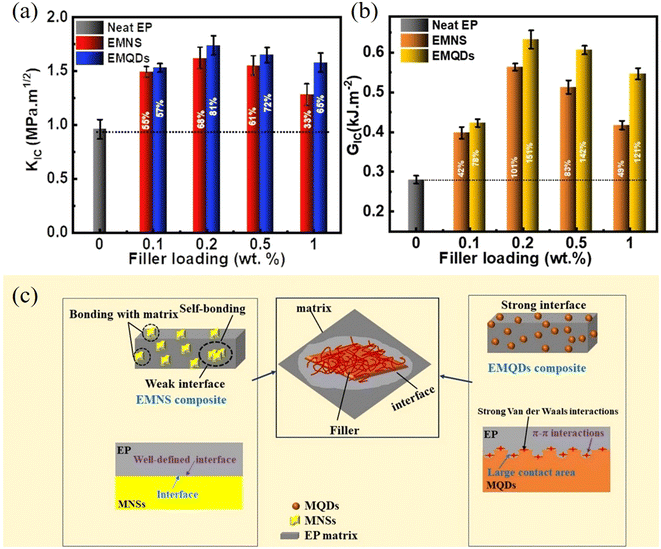 | ||
| Fig. 26 (a) KIC and (b) GIC of neat epoxy, epoxy/MNSs (EMNS) and epoxy/MQDs (EMQDs) nanocomposites. (c) Interfacial interactions of EMNS and EMQDs. Reproduced with permission from ref. 241. Copyright 2021 Elsevier. | ||
Poor interfacial strength between the matrix and the TMDCs restricts the reinforcing efficiency of the nanofiller. Non-covalent functionalization can therefore improve the interfacial interactions and hence the mechanical properties of the nanocomposites.242–244 Feng et al.242 prepared MoS2/poly(ethylene oxide) (PEO) nanocomposites via solution blending. The exfoliation and non-covalent functionalization were conducted in a pluronic aqueous solution assisted by sonication. It was found that the addition of 0.9 wt% MoS2 increased the Young's modulus of the neat PEO (0.84 GPa) by ∼90%. The mechanical reinforcement in terms of the elastic modulus of the matrix showed good agreement with the Halpin–Tsai model in the case of the random distribution of 2D nanosheets. This improvement was attributed to the good interfacial interaction and gradient interfaces between the MoS2 and PEO (due to non-covalent functionalization). The use of the surfactant during the exfoliation procedure improved the effective volume fraction of the MoS2 nanosheets. Wang et al.244 prepared lipoic acid-functionalized MoS2/nylon-6 (PA6) composites via in situ polymerization. It was found that the elastic modulus and tensile strength of the pristine PA6 were enhanced by about 80% (to 2.45 GPa) and 78% (to 80.6 MPa), respectively, upon the addition of 1.0 wt% functionalized MoS2. The weak van der Waals interfaces were modified by the chemical bonds, which led to an improvement in interfacial stress transfer. The in situ polymerization method is known to make the distribution of fillers more homogeneous156,157 in the case of MoS2 nanosheets, although its use is generally limited by its restriction to low filler contents.
In addition to MoS2, other TMDCs such as WS2![[thin space (1/6-em)]](https://www.rsc.org/images/entities/char_2009.gif) 245,246 and MoSe2
245,246 and MoSe2![[thin space (1/6-em)]](https://www.rsc.org/images/entities/char_2009.gif) 247 have also been used as reinforcing agents in polymer composites. For example, Kim et al.245 compared the mechanical reinforcement of MoS2 and WS2 in a PVA matrix. The MoS2 and WS2 nanosheets were fabricated via intercalation-assisted liquid exfoliation (their lateral sizes were quite small, of the order of 50–200 nm), and the composites were prepared by solution blending. The variation of tensile modulus with volume fraction is shown in Fig. 27a, where PM and PW represent the MoS2- and WS2-based PVA composites. Despite the small lateral size of the nanosheets it was found that the addition of 2.0 wt% WS2 increases the elastic modulus of the composites by 52% from 1.93 GPa to 2.93 GPa, while the introduction of 0.9 wt% MoS2 led to an increase of the modulus by 65% from 1.93 GPa to 3.18 GPa. This difference is due to the fact that the interactions between the MoS2 and PVA are stronger than the interactions between the WS2 and PVA, since more S–H–O bonds were formed between MoS2 and PVA (confirmed by Fourier-transform infrared spectroscopy (FTIR)). Sahu et al.246 functionalized WS2 with polyethyleneimine (PEI) to increase its compatibility with an epoxy matrix and fabricated WS2/epoxy nanocomposites by solution casting. It was found the fracture toughness of the polymer was improved by about 83% with the addition of 0.25 wt% WS2-PEI nanosheets as shown in Fig. 27b. The compressive and flexural strengths were improved significantly (43% and 65%, respectively). In summary, thanks to their excellent mechanical properties and good affinity with the matrices, TMDCs are effective in improving the mechanical performance of polymer composites. More research needs to be conducted in the near future to improve production yields, increase the lateral size of processed flakes and to functionalize TMDC nanosheets chemically (especially covalently) in order to achieve a higher reinforcement efficiency. The mechanical properties of TMDCs-reinforced polymer nanocomposites are summarized in Table 5.
247 have also been used as reinforcing agents in polymer composites. For example, Kim et al.245 compared the mechanical reinforcement of MoS2 and WS2 in a PVA matrix. The MoS2 and WS2 nanosheets were fabricated via intercalation-assisted liquid exfoliation (their lateral sizes were quite small, of the order of 50–200 nm), and the composites were prepared by solution blending. The variation of tensile modulus with volume fraction is shown in Fig. 27a, where PM and PW represent the MoS2- and WS2-based PVA composites. Despite the small lateral size of the nanosheets it was found that the addition of 2.0 wt% WS2 increases the elastic modulus of the composites by 52% from 1.93 GPa to 2.93 GPa, while the introduction of 0.9 wt% MoS2 led to an increase of the modulus by 65% from 1.93 GPa to 3.18 GPa. This difference is due to the fact that the interactions between the MoS2 and PVA are stronger than the interactions between the WS2 and PVA, since more S–H–O bonds were formed between MoS2 and PVA (confirmed by Fourier-transform infrared spectroscopy (FTIR)). Sahu et al.246 functionalized WS2 with polyethyleneimine (PEI) to increase its compatibility with an epoxy matrix and fabricated WS2/epoxy nanocomposites by solution casting. It was found the fracture toughness of the polymer was improved by about 83% with the addition of 0.25 wt% WS2-PEI nanosheets as shown in Fig. 27b. The compressive and flexural strengths were improved significantly (43% and 65%, respectively). In summary, thanks to their excellent mechanical properties and good affinity with the matrices, TMDCs are effective in improving the mechanical performance of polymer composites. More research needs to be conducted in the near future to improve production yields, increase the lateral size of processed flakes and to functionalize TMDC nanosheets chemically (especially covalently) in order to achieve a higher reinforcement efficiency. The mechanical properties of TMDCs-reinforced polymer nanocomposites are summarized in Table 5.
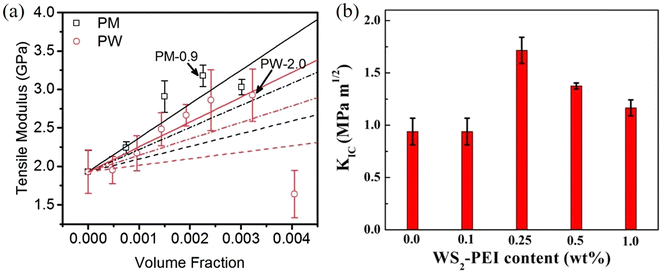 | ||
| Fig. 27 (a) Tensile modulus for the PVA composites based on MoS2 (PM) and WS2 (PW). Reproduced with permission from ref. 245. Copyright 2014 Royal Society of Chemistry. (b) Variation of facture toughness of WS2/epoxy composites with volume fraction. Reproduced with permission from ref. 246. Copyright 2017 American Chemical Society. | ||
| Filler | Matrixa | Processing method | Matrix modulus (GPa) | Optimum filler fraction | Increase (%) | Ref. | ||
|---|---|---|---|---|---|---|---|---|
| Young's modulus | Tensile strength | Fracture toughness | ||||||
| a WPU, waterborne polyurethane; CN, cellulose nanofibril. | ||||||||
| MoS2 | Epoxy | Solution casting | 3.45 | 0.2 wt% | 9 | 33 | 66 | 143 |
| f-MoS2 | Epoxy | Solution casting | — | 0.25 wt% | — | — | 81 | 248 |
| MNQs | Epoxy | Solution casting | — | 0.2 wt% | — | — | 81 | 241 |
| f-WS2 | Epoxy | Solution casting | — | 0.25 wt% | — | — | 83 | 246 |
| MoS2 | PVA | Solution casting | 3.4 | 3, 3, 2 wt% | 42 | 56 | 300 | 141 |
| f-MoS2 | PVA | Solution casting | — | 2 wt% | — | 57 | — | 249 |
| f-MoS2 | PVA | Solution casting | 1.93 | 0.9 wt% | 65 | — | — | 245 |
| f-WS2 | PVA | Solution casting | 1.93 | 2 wt% | 52 | — | — | 245 |
| MoS2 | PVA | Solution casting | 2.8 | 0.25 wt% | 14 | 18 | — | 250 |
| MoS2 | PEO | Solution casting | 0.27 | 2 wt% | 111 | — | — | 251 |
| f-MoS2 | PEO | Solution casting | 0.84 | 0.9 wt% | 88.1 | 53.3 | — | 242 |
| f-MoS2 | PA6 | In situ polymerization | 1.36 | 1 wt% | 80 | 78 | — | 244 |
| f-MoS2 | PE | In situ polymerization | 0.515 | 1.23 wt% | 56.5 | 114 | — | 252 |
| f-MoS2 | PE | In situ polymerization | 0.48 | 1.53 wt% | 90 | 72 | — | 253 |
| f-MoS2 | PE | In situ polymerization | 0.515 | 0.47, 1.02 wt% | 61 | 105 | — | 254 |
| MoS2 | PS | Melt mixing | 3.8 | 0.002 wt% | −2 | 27.5 | 100 | 255 |
| f-MoS2 | PI | Solution casting | 2.5 | 1 wt% | 43 | 47 | — | 256 |
| f-MoS2 | PP | In situ polymerization | 0.85 | 0.52 wt% | 61.2 | 11.4 | — | 257 |
| f-MoS2 | WPU | Solution casting | 0.12 | 4 wt% | 85 | 140 | — | 258 |
| MoS2 | CS | Solution casting | — | 0.5 wt% | — | 207 | — | 259 |
| f-MoS2 | PVDF | Solution casting | — | 7 wt% | — | 61.5 | — | 260 |
| MoS2 | CN | Solution casting | 4.1 | 6 wt% | 100 | 74 | — | 261 |
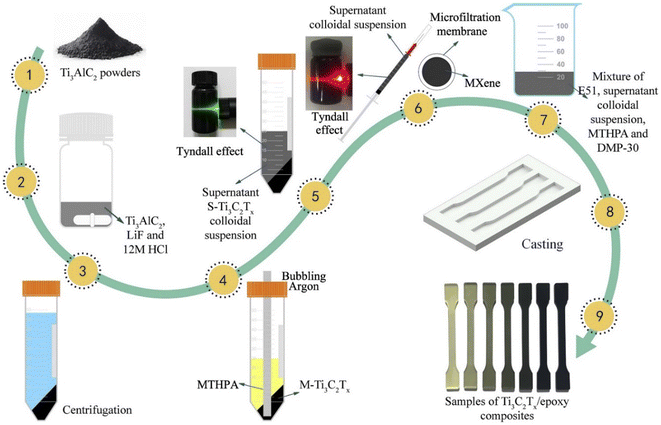 | ||
| Fig. 28 Preparation process of Ti3C2Tx/epoxy nanocomposites. Reproduced with permission from ref. 262. Copyright 2020 Elsevier. | ||
As a result of the presence of abundant surface functional groups, MXenes have been combined with various polymers, such as PVA,263 waterborne polyurethane (WPU),264,265 cellulose nanofiber (CNF)266,267 and aramid nanofiber (ANF)268,269 to fabricate bioinspired nanocomposites with nacre structure. Cao et al.266 prepared d-Ti3C2Tx/CNF nanocomposites with a nacre structure using vacuum filtration (Fig. 29a and b). The stress–strain curves are shown in Fig. 29c, and the optimal mechanical performance was achieved at 50 wt% Ti3C2Tx content. The fracture toughness of the composites was improved by ∼360% from 3.2 ± 0.2 MJ m−3 to 14.8 ± 0.4 MJ m−3. Meanwhile, both the elastic modulus and tensile strength show improvements, increasing from 1.4 ± 0.1 to 3.8 ± 0.3 GPa and from 49.3 ± 4.8 to 135.4 ± 6.9 MPa, respectively. The improvement in mechanical properties is induced by the formation of abundant hydrogen bonds, as a number of terminal groups exist on d-Ti3C2Tx nanosheets, while hydroxyl groups are present on the CNFs. In addition, a synergistic effect was observed due to the formation of a “brick-and-mortar” layered structure. With tensile loading, interlayer hydrogen bonds will break and the d-Ti3C2Tx nanosheets will slide over each other. The presence of CNFs reduces the slippage of nanosheets and delays crack propagation at higher loadings. As a result, a high tensile strength was observed. In another study, the tensile strength of Ti3C2Tx/CNF nanocomposites prepared using a similar method was as high as 416 MPa with 60 wt% Ti3C2Tx after vacuum pressing as shown in Fig. 29d and the Young's modulus increased to 46.5 GPa with 90 wt% Ti3C2Tx.267 Overall, as mentioned earlier, the excellent intrinsic mechanical properties and surface functional groups make MXenes very attractive candidates for the mechanical reinforcement of nanocomposites. The mechanical properties of MXenes-reinforced polymer nanocomposites are summarized in Table 6.
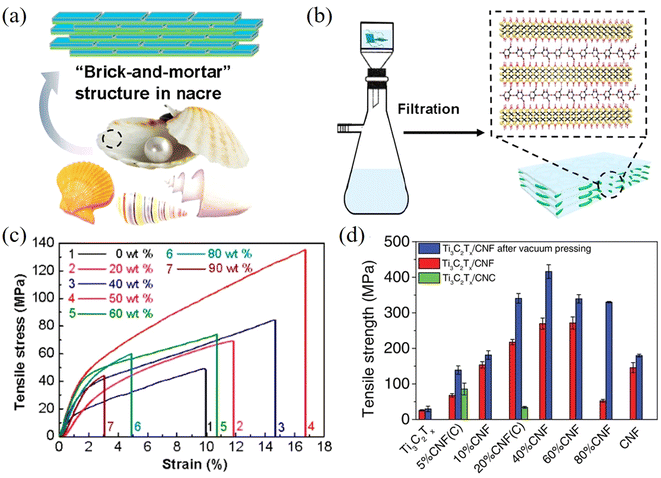 | ||
| Fig. 29 (a) Natural nacre with a “brick and mortar” structure. (b) Vacuum filtration for the preparation of Ti3C2Tx/CNF composites. (c) Stress–strain curves of Ti3C2Tx/CNF composites with different Ti3C2Tx contents. Reproduced with permission from ref. 266. Copyright 2018 American Chemical Society. (d) Variations of tensile strength of Ti3C2Tx/CNF composites with different CNF content. Reproduced with permission from ref. 267. Copyright 2019 WILEY–VCH Verlag GmbH & Co. KGaA. | ||
| Filler | Matrixa | Processing method | Matrix modulus (GPa) | Optimum filler fraction | Increase (%) | Ref. | ||
|---|---|---|---|---|---|---|---|---|
| Young's modulus | Tensile strength | Fracture toughness | ||||||
| a WEP, waterborne epoxy; PANI, polyaniline; NR, natural rubber. | ||||||||
| Ti3CN | Epoxy | Solution casting | 4.5 | 90 wt% | 182 | — | — | 142 |
| f-Ti3C2Tx | Epoxy | Solution casting | 2.6 | 0.2, 0.2, 1 wt% | 35 | 51 | 107 | 262 |
| Ti3C2Tx | Epoxy | Solution casting | 3.62 | 5 wt% | 21 | — | — | 270 |
| f-Ti3C2Tx | Epoxy | Solution casting | — | 0.5 wt% | — | — | 70 | 271 |
| Ti3C2Tx | Epoxy | Freeze casting | — | 0.6 wt% | — | — | 710 | 272 |
| f-Ti3C2Tx | Epoxy/PE | Solution casting | 3.24 | 1 wt% | 17 | 56 | — | 273 |
| Ti3C2Tx | WEP | Solution casting | 0.45 | 2 wt% | 94 | 40 | — | 274 |
| TSAC | PMMA | Solution casting | 0.289 | 0.3 wt% | 396.5 | 88 | — | 275 |
| Ti3C2Tx | PVA | Vacuum filtration | 1 | 40 wt% | 270 | 203 | — | 263 |
| Ti3C2Tx | PVA | Solution casting | 2.21 | 0.6 wt% | 27 | 24 | — | 169 |
| Ti3C2Tx | PVA | Solution casting | — | 10 wt% | — | 205 | 346 | 276 |
| f-Ti3C2Tx | PVA | Solution casting | 3.56 | 2 wt% | 64 | 67 | — | 277 |
| Ti3C2Tx | PVC | Solution casting | 0.024 | 10 wt% | 177.47 | 173.55 | — | 278 |
| Ti3C2Tx | PANI | Vacuum filtration | — | 87.5 wt% | — | 670 | — | 279 |
| Ti3C2Tx | CNF | Vacuum filtration | 1.4 | 50 wt% | 171.4 | 174.6 | 362.5 | 266 |
| Ti3C2Tx | CNF | Vacuum filtration | 8.25 | 90, 40 wt% | 467 | 131 | — | 267 |
| Ti3C2Tx | CNF | Vacuum filtration | 5.8 | 50, 40 wt% | 21 | 24 | — | 280 |
| Ti3C2Tx | ANF | Vacuum filtration | — | 10 wt% | — | 20 | — | 268 |
| Ti3C2Tx | ANF | Vacuum filtration | 6.2 | 40, 10, 10 wt% | 123 | 19 | 13 | 269 |
| f-Ti3C2Tz | PLA | Solution casting | — | 1 wt% | — | — | 144.3 | 281 |
| Ti3C2Tx | PP | Melt mixing | — | 2 wt% | — | 35.3 | — | 282 |
| Ti3C2Tx | TPU | Melt mixing | — | 0.5 wt% | — | 47.1 | — | 149 |
| Ti3C2Tx | WPU | Vacuum filtration | 2.53 | 80wt% | 211 | 232 | 297 | 264 |
| Ti3C2Tx | WPU | Solution casting | — | 0.5 wt% | — | 20 | — | 283 |
| Ti3C2Tx | NR | Vacuum filtration | 0.00055 | 6.71 vol% | 15![[thin space (1/6-em)]](https://www.rsc.org/images/entities/char_2009.gif) 000 000 |
700 | — | 284 |
| Ti3C2Tx | Nafion | Solution casting | 0.1046 | 10 wt% | 66 | 51 | — | 285 |
Protective layers have been utilised to fabricate air-stable BP nanosheets for the reinforcement of polymer nanocomposites.289,290 Qiu et al.289 modified few-layer BP nanosheets by polyphosphazene (PZN) functionalization and fabricated BP/epoxy nanocomposites (Fig. 30). The sandwich-like PZN-BP-PZN structure, shown in Fig. 31, was formed through direct polymerization and the BP nanosheets were found to be stable in air due to the wrapping of the PZN hybrids. The hybrid structures also prevented BP nanosheets from agglomeration within the nanocomposite, as confirmed by TEM images. Meanwhile, the mechanical properties of the epoxy composites were improved significantly with a small loading of BP nanosheets. For instance, the storage modulus of the composites at room temperature was improved by ∼130% with 1 wt% of PZN-functionalized BP nanosheets. This was attributed to the excellent mechanical properties of BP nanosheets and good interfacial interactions between the PZN-BP-PZN and epoxy matrix.
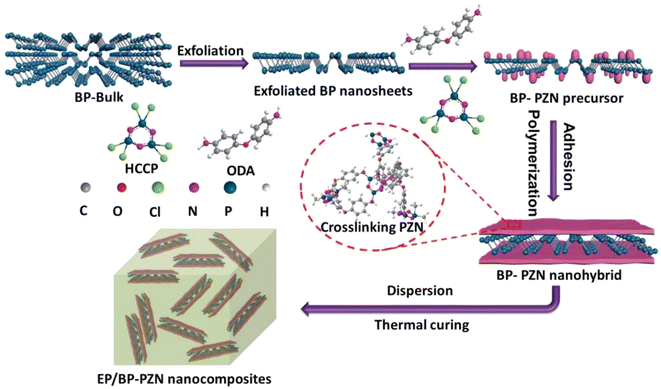 | ||
| Fig. 30 Preparation of PZN-functionalized BP nanosheets and BP/epoxy nanocomposites. Reproduced with permission from ref. 289. Copyright 2019 WILEY–VCH Verlag GmbH & Co. KGaA. | ||
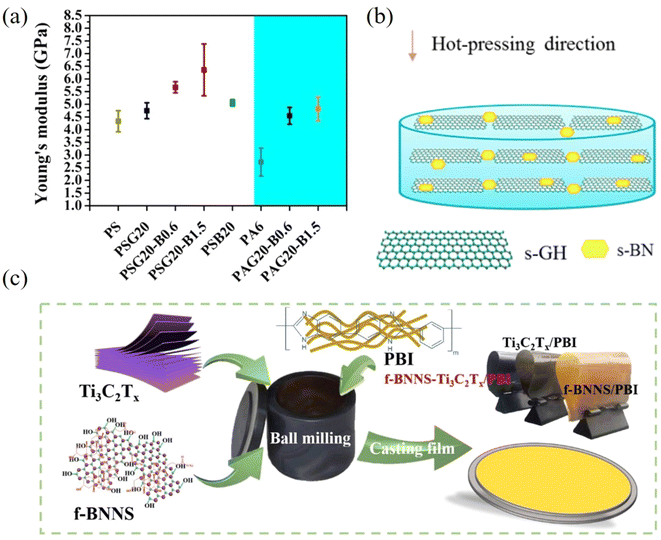 | ||
| Fig. 31 (a) Variation of the Young's modulus of PS and PA composites with the addition of graphene and BN. (b) Scheme for the stacking of graphene (s-GH) and BN (s-BN). Reproduced with permission from ref. 311. Copyright 2015 American Chemical Society. (c) Preparation process of PBI-based composite films. Reproduced with permission from ref. 319. Copyright 2019 Elsevier. | ||
Overall, even though air instability may hinder the applications of BP nanosheets, it has provided opportunities for researchers to explore different strategies to fabricate air-stable BP nanosheets. These strategies promote the interactions between BP nanosheets and matrices, prevent BP nanosheets from agglomeration and therefore improve the final mechanical performance of the nanocomposites. The mechanical properties of BP-reinforced polymer nanocomposites are summarized in Table 7.
| Filler | Matrixa | Processing method | Matrix modulus (GPa) | Optimum filler fraction | Increase (%) | Ref. | ||
|---|---|---|---|---|---|---|---|---|
| Young's modulus | Tensile strength | Fracture toughness | ||||||
| a NFC, nanofibrillar cellulose. | ||||||||
| f-BP | Epoxy | Solution casting | — | 1 wt% | — | 71 | — | 291 |
| f-BP | Epoxy | Solution casting | — | 1 wt% | — | 27.2 | — | 292 |
| f-BP | Epoxy | Solution casting | — | 1 wt% | — | 56 | — | 293 |
| BP | PVDF | Solution casting | 1.46 | 2.5 wt% | 56.8 | — | — | 286 |
| BP | PVA | Solution casting | 5.6 | 3.11 wt% | 104 | 88 | — | 287 |
| BP | PVA | Solution casting | 0.88 | 5 wt% | 101.5 | 131.2 | — | 294 |
| f-BP | TPU | Solution casting | — | 0.5 wt% | — | 27.6 | — | 295 |
| f-BP | TPU | Solution casting | — | 0.5 wt% | — | 55 | — | 296 |
| f-BP | NFC | Vacuum filtration | — | 25 wt% | — | 312 | — | 297 |
| f-BP | PLA | Solution casting | — | 1 wt% | — | 11 | — | 298 |
| Filler | Matrix | Processing method | Matrix modulus (GPa) | Optimum filler fraction | Increase (%) | Ref. | ||
|---|---|---|---|---|---|---|---|---|
| Young's modulus | Tensile strength | Fracture toughness | ||||||
| COFs | TPU | Solution casting | — | 3.2 wt% | 45 | 64 | — | 299 |
| COF | TPU | Solution casting | — | 3 wt% | — | 69.6 | — | 307 |
| f-COFs | CS | Solution casting | 0.0123 | 1.6 wt% | 94.3 | 27.9 | — | 300 |
| f-COFs | PLA | Solution casting | — | 1 wt% | 68.6 | — | — | 302 |
| COF | PEG | Solution casting | 0.36 | 50 wt% | 154 | 116 | — | 303 |
| MOF | Epoxy | Solution casting | 1.56 | 1.2 wt% | −6 | 34 | — | 308 |
| MOF | PI | In situ polymerization | 17.8 | 3 wt% | 85 | 35 | — | 309 |
| f-MOFs | PLA | Solution casting | 3.5 | 2 wt% | 14 | 17 | — | 243 |
| f-MOFs | PLA | Solution casting | — | 5 wt% | — | 47 | — | 306 |
5. Hybrid nanocomposites
Two or more nanofillers can be incorporated into a single matrix to improve the mechanical performance of polymer nanocomposites, leading to additive or synergistic effects. These synergistic effects are usually related to the creation of various interfacial bonds between the filler and the matrix that induce a significant improvement in the mechanical properties. Unlike the weak van der Waals bonds, the presence of both covalent and non-covalent bonds such as hydrogen bonds, ionic bonds and π–π interactions between the filler and the matrix can improve the interfacial shear strength and hence the stress transfer efficiency. The combination of these bonds within a composite can improve the mechanical performance synergistically. A number of papers have reported synergistic improvements of various properties of nanocomposites as a result of combinations of nanofillers with different geometries (2D, 1D, 0D and their combinations). There is therefore an opportunity to improve the mechanical properties of nanocomposites using hybrid fillers for the creation of different types of chemical bonds and constrain the movement of the macromolecular chains of the matrix effectively. In this section, we will review the combination of 2D fillers with fillers of different dimensions including 2D–2D, 2D–1D and 2D–0D and their additive or synergistic effects upon the mechanical reinforcement of nanocomposites.5.1. 2D–2D nanocomposites
The exceptional multifunctional properties of different types of 2D nanosheets have led to a large number of publications dealing with the preparation and properties of 2D–2D hybrid nanocomposites.146,310–322 The intrinsic mechanical properties of hybrid nanosheets can lead to reinforcement of the composites, most commonly as a result of additive effects. More importantly, the use of hybrid nanosheets can promote uniform dispersions or the formation of ordered, stacked structures that are known to lead to improved stress transfer efficiency.Cui et al.311 prepared PS and polyamide 6 (PA6) composites reinforced with graphene nanoplatelets and h-BN nanosheets by hot pressing at 180 °C under 15 MPa pressure. The Young's modulus and hardness of the composites were characterized by nanoindentation. In terms of PS composites, the Young's modulus was only increased slightly from 4.32 to 4.7 GPa upon the addition of 20 wt% graphene (PSG20) or BN (PSB20) nanosheets. The addition of 1.5 wt% h-BN to PSG20 (PSG20-B1.5) improved the Young's modulus of the composites significantly from 4.7 to 6.3 GPa as shown in Fig. 31a. According to the authors, the h-BN nanosheets were located between the graphene interspaces as illustrated in Fig. 31b. This improved stress transfer efficiency from the matrix to nanosheets was the result of more interfaces being involved in stress transfer. Furthermore, the h-BN nanosheets were stacked on graphene nanosheets, which helped reduce stress concentrations and modified the crack propagation mechanism. These two factors synchronously improved the elastic modulus of the composites significantly. In another study, f-BNNS and Ti3C2Tx MXene were introduced into a polybenzimidazole (PBI) matrix through ball milling as illustrated in Fig. 31c.319 With the addition of 25 wt% f-BNNS/Ti3C2Tx, the yield and ultimate tensile strengths of the composites were improved by 61.1% and 39.8% to 175.5 MPa and 189.6 MPa, respectively. The synergistic effect originates from the interaction between the f-BNNS and Ti3C2Tx, which not only prevents agglomeration but also facilitate the formation of bridge connections between the fillers. These studies show that the use of hybrid nanosheets can further improve the mechanical properties of composites compared with the use of individual types of nanosheets.
Wan et al.317 demonstrated the synergistic effect between GO and MoS2 for the toughening of TPU nanocomposites. The GO/MoS2/TPU composites were prepared by a filtration method, creating a nacre-type structure. The corresponding stress–strain curves for different contents of MoS2 were obtained as shown in Fig. 32a.317 The TPU content was kept constant at 10 wt%. Compared with GO/TPU composites, the tensile strength and fracture toughness both increased with the addition of MoS2 nanosheets and reached their maximum values at 4.4 wt% of MoS2, as shown in Fig. 32b and c. The tensile strength was improved by 40% from 166.7 MPa to 235.3 MPa. Additionally, the toughness (determined from the area under the stress–strain curve) was more than doubled from 3.3 MJ m−3 to 6.9 MJ m−3. The fractured morphology of rGO/MoS2/TPU composites is shown in Fig. 32d. According to the authors the application of an external load will result in the slippage of GO nanosheets and the formation of cracks due to the breakage of hydrogen bonds. The friction between GO and MoS2 leads to the movement of MoS2 nanosheets. Due to the excellent lubrication properties of layered MoS2, more energy is required for crack propagation as the crack is deflected, and the toughness is enhanced. The incorporation of MoS2 at loadings beyond 4.4 wt% degrades the tensile strength and toughness probably due to the restacking of the nanosheets. Recently, ultra-tough nanocomposites based on rGO + MXene,323 and rGO + BP324 have been reported from the same group. Except for the toughening mechanism described above, the synergistic effects between covalent bonds and π–π interactions play an important role in the improvement of tensile strength. These studies demonstrate a promising strategy for the improvement of both the tensile strength and toughness of nanocomposites.
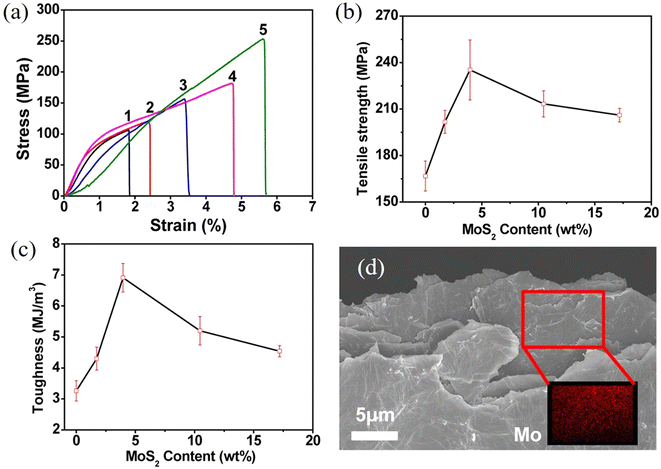 | ||
| Fig. 32 (a) Stress–strain curves of GO/MoS2/TPU nanocomposites. 1 to 5 represent GO film, GO/TPU, rGO/TPU, GO/MoS2/TPU, and rGO/MoS2/TPU composites, respectively. Dependence of the (b) tensile strength and (c) toughness of the composites with the loading of MoS2. (d) Fracture surface of the rGO/MoS2/TPU composites. Reproduced with permission from ref. 317. Copyright 2015 American Chemical Society. | ||
In summary, the use of hybrid nanosheets shows huge potential in the improvement of mechanical properties of nanocomposites due to additive or synergistic effects. The good mechanical properties and unique characteristics of diverse 2D nanosheets can be combined together to reinforce nanocomposites. To achieve additive or synergistic effects, it is important to promote homogeneous dispersion of hybrid nanosheets; otherwise, agglomeration phenomena may degrade the mechanical performance of the hybrid nanocomposites. The mechanical properties of hybrid 2D–2D nanocomposites are summarized in Table 9.
| Filler 1 | Filler 2 | Matrix | Processing method | Matrix modulus (GPa) | Optimum hybrid filler (f1/f2) fractiona | Increase (%) | Ref. | ||
|---|---|---|---|---|---|---|---|---|---|
| Young's modulus | Tensile strength | Fracture toughness | |||||||
| EAA, poly(ethylene-co-acrylic acid); UP, unsaturated polyester. GP, graphite platelet.a When more than one optimum filler fractions are mentioned, they should correspond to the optimum filler fractions for improvement of modulus, strength and toughness, sequentially. | |||||||||
| GO | GNP | Epoxy | Freeze casting | — | 5 wt% | — | — | 81.4 | 325 |
| GP | GNP | PP | Melt mixing | 0.6 | 3/20 wt% | 285 | 17 | — | 310 |
| GNP | BN | PS | Hot pressing | 4.32 | 20/1.5 wt% | 46 | — | — | 311 |
| rGO | BN | PVA | Solution casting | 2.3 | 0.8, 0.8, 1.6 wt% | 22 | 18 | 100 | 312 |
| GO | BN | PU | Solution casting | 0.03 | 0.5 wt% | 140 | 85 | — | 314 |
| GNP | BN | PVDF | Solution casting | — | 2.5/30 wt% | — | 63 | — | 315 |
| f-GO | f-BN | PU | Solution casting | 0.05 | 3 wt% | 76 | 62 | — | 316 |
| f-GO | f-BN | TPU | Solution casting | 0.036 | 10 wt% | 2729 | 381 | — | 326 |
| GNP | MoS2 | PVC | Melt mixing | 0.0388 | 2/2 wt% | 566 | 38 | — | 318 |
| GO | Ti3C2Tx | EAA | Solution casting | 0.1 | 10 wt% | 354 | 78 | — | 327 |
| GO | Ti3C2Tx | PI | Solution casting | 11 | 1/0.3 wt% | 18 | 54 | — | 328 |
| GO | f-BP | PVA | Solution casting | — | 25 wt% | – | 114 | 236 | 329 |
| GO | Clay | UP | Solution casting | 3.27 | 1 wt% | 93 | 130 | — | 330 |
| BN | MoS2 | Epoxy | Solution casting | 0.34 | 0.25, 1 wt% | 58 | 95 | — | 146 |
| BN | MoS2 | PU | Solution casting | 0.3 | 0.5 wt% | 80 | — | — | 331 |
| f-BN | Ti3C2Tx | PBI | Solution casting | 2 | 25 wt% | 97 | 39.8 | — | 319 |
| MoS2 | WS2 | PLA | Solution casting | 0.01 | 1/1 phr | 47 | 86 | 58 | 321 |
| MoS2 | Bi2Se3 | Epoxy | Solution casting | — | 1 wt% | — | 31 | — | 322 |
5.2. 2D–1D nanocomposites
The addition of 1D nanomaterials to composites based on 2D nanomaterials has been widely explored in an attempt to improve their mechanical performance. Several 1D nanomaterials possess excellent mechanical properties and good compatibility with polymer matrices. For example, the Young's modulus and tensile strength of carbon nanotubes (CNTs) were measured to be 1 TPa and 100 GPa.332 Even though the elastic modulus of nanofibrillar cellulose (∼150 GPa) is relatively low compared to CNTs, there are abundant hydroxyl groups on its surface which is beneficial for the formation of strong interfacial bonds with other fillers or matrices.164 Therefore, 1D nanofillers can not only improve the mechanical properties of composites due to additive effects, but also promote the dispersion of 2D nanosheets in matrices and therefore lead to additional synergistic effects.Carbon nanotubes are extensively used in hybrid nanocomposites, such as in combination with graphene,333–336 BN,337–342 MoS2![[thin space (1/6-em)]](https://www.rsc.org/images/entities/char_2009.gif) 343–345 and MXenes.346–348 Li et al.333 prepared epoxy composites based on GNPs and CNTs. They compared the mechanical properties of the composites containing only GNPs or CNTs, and GNPs + CNTs (a mixture of GNPs and CNTs) or CNTs-GNPs (CNTs grown on GNPs), as seen from Fig. 33a–d. It was found that the combination CNTs-GNPs not only gave the highest elastic modulus and tensile strength, but also the highest fracture strain. With the addition of 0.5 wt% CNTs-GNPs, the elastic modulus and tensile strength of the composites were improved by 40% and 36% respectively as shown in Fig. 33f and g. Meanwhile, the fracture strain was not reduced in contrast to the other three cases where the fracture behaviour was degraded severely (Fig. 33h). These excellent mechanical properties were attributed to the formation of strong bonds between the CNTs and GNPs. The conjunction between CNTs and GNPs promoted the homogeneous distribution both nanofillers, and prevented both the GNPs from agglomeration and the CNTs from curling. This conjunction therefore promotes good stress transfer and hence the mechanical properties to be achieved.
343–345 and MXenes.346–348 Li et al.333 prepared epoxy composites based on GNPs and CNTs. They compared the mechanical properties of the composites containing only GNPs or CNTs, and GNPs + CNTs (a mixture of GNPs and CNTs) or CNTs-GNPs (CNTs grown on GNPs), as seen from Fig. 33a–d. It was found that the combination CNTs-GNPs not only gave the highest elastic modulus and tensile strength, but also the highest fracture strain. With the addition of 0.5 wt% CNTs-GNPs, the elastic modulus and tensile strength of the composites were improved by 40% and 36% respectively as shown in Fig. 33f and g. Meanwhile, the fracture strain was not reduced in contrast to the other three cases where the fracture behaviour was degraded severely (Fig. 33h). These excellent mechanical properties were attributed to the formation of strong bonds between the CNTs and GNPs. The conjunction between CNTs and GNPs promoted the homogeneous distribution both nanofillers, and prevented both the GNPs from agglomeration and the CNTs from curling. This conjunction therefore promotes good stress transfer and hence the mechanical properties to be achieved.
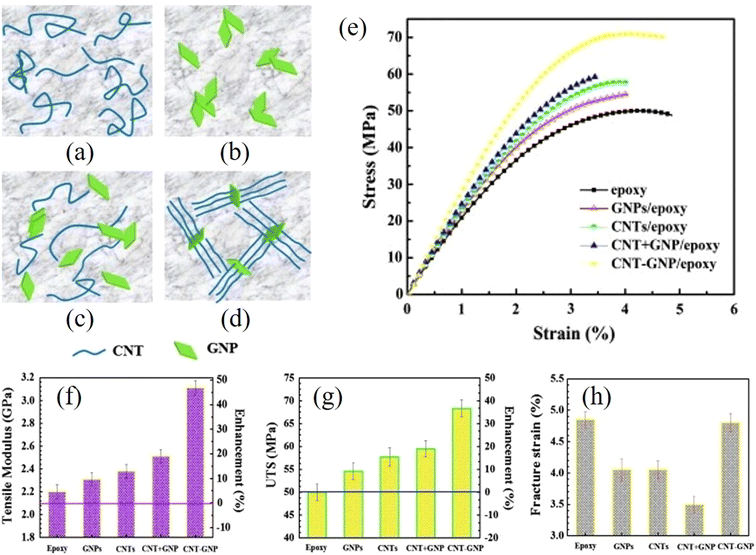 | ||
| Fig. 33 (a–d) CNTs, GNPs, CNTs and GNPs, and CNTs on GNPs. (e) Stress–strain curves of the epoxy composites based on CNTs and GNPs. (f–h) Variations of elastic modulus, tensile strength and fracture strain of epoxy composites with GNP and CNT. Reproduced with permission from ref. 333. Copyright 2012 Elsevier. | ||
CNTs can act as bridges to connect 2D nanosheets and improve load transfer. For example, Park et al.341 fabricated PI composites based on h-BN nanosheets and CNTs. The BN-Fe-CNT hybrids were formed and each part was connected by amide bonds as shown in Fig. 34a. This improved the mechanical performance of the final composites significantly. As seen from Fig. 34b and c, the elastic modulus of the composites was increased from 2.1 to 5.4 GPa with the addition of 2 wt% of nanofillers. The tensile strength was improved considerably from 67 MPa to 174 MPa. Such improvements can be attributed once again to the enhanced stress transfer due to the formation of interlinked nanofillers. These interconnected nanofillers reduce the curling of the CNTs and the agglomeration of the h-BN nanosheets. Overall, the good intrinsic mechanical properties and strong interactions with the 2D nanosheets, as well as polymer chains, make CNTs appealing in the fabrication of hybrid 2D–1D nanocomposites.
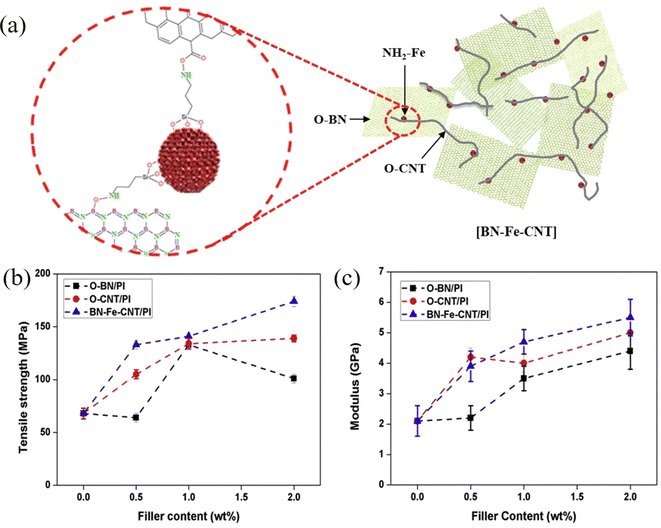 | ||
| Fig. 34 (a) Interconnection of BN-Fe-CNT. (b and c) Variations of tensile strength and modulus of PI composites with O-BN, O-CNT and BN-Fe-CNT. Reproduced with permission from ref. 341. Copyright 2020 Elsevier. | ||
Recently, a liquid flow assisted method has been used to align 2D nanosheets in polymer nanocomposites.349 The dispersion of 2D nanosheets was achieved by the superspreading of the reaction solution with GO and sodium alginate (NaAlg) on the surface of polyacrylamide hydrogel. Gel-drying was then used to prepare the nanocomposites. Based on this process, polymer nanocomposites with NaAlg, PVA, GO, nanoclay, and CNTs (5![[thin space (1/6-em)]](https://www.rsc.org/images/entities/char_2009.gif) :
:![[thin space (1/6-em)]](https://www.rsc.org/images/entities/char_2009.gif) 4
4![[thin space (1/6-em)]](https://www.rsc.org/images/entities/char_2009.gif) :
:![[thin space (1/6-em)]](https://www.rsc.org/images/entities/char_2009.gif) 1
1![[thin space (1/6-em)]](https://www.rsc.org/images/entities/char_2009.gif) :
:![[thin space (1/6-em)]](https://www.rsc.org/images/entities/char_2009.gif) 2
2![[thin space (1/6-em)]](https://www.rsc.org/images/entities/char_2009.gif) :
:![[thin space (1/6-em)]](https://www.rsc.org/images/entities/char_2009.gif) 0.03 by weight) showed impressive mechanical properties with an elastic modulus of nearly 200 GPa, a strength of 1215 MPa and a toughness of 6.9 MJ m−3. This impressive mechanical performance was claimed to be because the aligned 2D nanosheets formed a critical interphase. This corresponds to the mechanism illustrated in Fig. 19b, where the mechanical performance of the composites increases quadratically with the increase of filler loading due to strong interactions between the fillers and matrix. This study demonstrates a promising strategy for the alignment of 2D nanosheets in polymer nanocomposites. It shows that the tremendous potential of 2D nanosheets in the mechanical reinforcement of nanocomposites should be explored further.
0.03 by weight) showed impressive mechanical properties with an elastic modulus of nearly 200 GPa, a strength of 1215 MPa and a toughness of 6.9 MJ m−3. This impressive mechanical performance was claimed to be because the aligned 2D nanosheets formed a critical interphase. This corresponds to the mechanism illustrated in Fig. 19b, where the mechanical performance of the composites increases quadratically with the increase of filler loading due to strong interactions between the fillers and matrix. This study demonstrates a promising strategy for the alignment of 2D nanosheets in polymer nanocomposites. It shows that the tremendous potential of 2D nanosheets in the mechanical reinforcement of nanocomposites should be explored further.
Other one-dimensional materials, such as carbon fibres (CFs)350–355 or glass fibers (GFs),356 nanorods or nanowires (NWs)357–361 and nanocelluloses362–365 have also been incorporated into nanocomposites to improve their mechanical performance. For example, Papageorgiou et al.351 studied the additive effect of GNPs and CFs on the mechanical properties of PEEK composites. The Young's modulus was improved from about 3.3 GPa to 4.5 GPa with the addition of 14 vol% GNPs. It was further improved to about 7 GPa with the addition of 34 vol% of a hybrid GNP/CF filler with the improvement being attributed to the additive effect of the presence of GNPs and CFs, in terms of their high values of elastic modulus. Furthermore, the high aspect ratio of GNPs restricted the movement of the macromolecular chains and promoted the stress transfer efficiency. Overall, the use of hybrid 1D and 2D nanofillers can improve the mechanical properties of composites due to additive effects. Synergistic effects can further contribute to the mechanical reinforcement. The mechanical properties of hybrid 2D-1D nanocomposites are summarized Table 10.
| Filler 1 | Filler 2 | Matrix | Processing method | Matrix modulus (GPa) | Optimum hybrid filler (f1/f2) fraction | Increase (%) | Ref. | ||
|---|---|---|---|---|---|---|---|---|---|
| Young's modulus | Tensile strength | Fracture toughness | |||||||
| PTFE, polytetrafluoroethylene; PPC, poly(propylene carbonate); NBR, nitrile rubber. MWCNT, multiwall carbon nanotube; CNC, cellulose nanocrystal; ATP, attapulgite; SAF, short aramid fibre. | |||||||||
| GNP | CNT | Epoxy | Solution casting | 2.2 | 0.5 wt% | 40 | 36 | — | 333 |
| GNP | CNT | Epoxy | Mechanical mixing | — | 0.5 wt% | — | — | 76 | 366 |
| GNP | MWCNT | UHMWPE | Hot pressing | 0.401 | 0.5 wt% | 37.1 | 30.8 | — | 334 |
| GO | CNT | PVA | Solution casting | 3.1 | 10/5, 6/3 wt% | 106 | 80 | — | 367 |
| GNP | MWCNT | Epoxy | Solution casting | 2.646 | 0.9/0.1 wt% | 27.1 | 35.4 | — | 368 |
| f-GNP | f-CNT | TPU | Solution casting | 0.0207 | 3 wt% | 90 | 32 | — | 369 |
| GNP | CNT | UHMWPE | Hot pressing | 0.59 | 0.3/0.1 wt% | 37.3 | 33.4 | — | 335 |
| f-GO | f-CNT | PI | In situ polymerization | 7.7 | 0.9/0.1 wt% | 312 | 221 | 200 | 370 |
| GO | CNT | PI | Solution casting | 2.47 | 1.1 wt% | 94 | 118 | 138 | 371 |
| GNP | f-CNT | PLA | Melt mixing | 1.5 | 0.5 wt% | 66 | 44 | — | 372 |
| GO | CNT | PS | Hot pressing | 0.967 | 1.02 wt% | 19 | 64 | — | 336 |
| BN | MWCNT | Epoxy | Solution casting | 3.25 | 0.5/0.3 wt% | 38 | 25 | — | 337 |
| BN | f-CNT | Nomex/PTFE | Solution casting | 5.2 | 0.5/0.5 wt% | 37.5 | 22.7 | — | 338 |
| BN | CNT | Epoxy | Solution casting | 2.03 | 7.6 wt% | 37 | 300 | — | 339 |
| f-BN | f-CNT | PI | Solution casting | 2.1 | 2 wt% | 170 | 160 | — | 341 |
| BN | CNT | HDPE | Mechanical mixing | 1.47 | 0.15/0.25 wt% | 102 | — | — | 342 |
| MoS2 | MWCNT | Epoxy | Solution casting | 2.6 | 1 wt% | 47.2 | 49.6 | — | 345 |
| GO | CF | PU | Solution casting | 0.00314 | 1.1 wt% | 648 | 46 | — | 350 |
| MoS2 | CF | Epoxy | Solution casting | 1.25 | 0.8 wt% | 53 | 77 | — | 355 |
| GO | SiC | PPC | Solution casting | 3 | 3 wt% | 183 | 46 | — | 359 |
| f-BN | Cu | PVA | Solution casting | 1.33 | 10/0.1 wt% | 303 | 123 | — | 361 |
| GO | CNC | PVA | Solution casting | 0.86 | 5 wt% | 320 | 124 | 159 | 363 |
| BN | CNC | PVA | Solution casting | 2.3 | 3.2, 3.2, 0.8 wt% | 49 | 42 | 100 | 365 |
| f-BN/Ti3C2Tx | Ag | PBI | Solution casting | 2 | 50.5 | 255 | 104 | — | 373 |
| Ti3C2Tx | CNT | TPU | Hot pressing | — | 3 wt% | — | 79.5 | — | 348 |
| Ti3C2Tx | CNT | NBR | Mechanical mixing | 0.00078 | 21.1/2.9 vol% | 429 | 146 | — | 347 |
| Ti3C2Tx | f-CNT | WPU | Solution casting | 0.044 | 0.95/0.05 wt% | 69 | 25 | — | 374 |
| Ti3C2Tx | MWCNT | PVA | Solution casting | 2.23 | 0.6/0.6 wt% | 52 | 48 | — | 375 |
| Ti3C2Tx | MWCNT | Epoxy | Mechanical mixing | 3 | 0.5/0.5 wt% | 31 | 6 | 85 | 147 |
| Ti3C2Tx | ATP | Epoxy | Solution casting | 2.6 | 0.2/0.25, 0.2/1 wt% | 38 | 88 | 195 | 376 |
| Ti3C2Tx | CF | Epoxy | Solution casting | 2.6 | 2 wt% | 46 | 100 | 216 | 377 |
| Ti3C2 | SAF | PP | Melt mixing | 0.879 | 0.3/5 wt% | 35.3 | 28.1 | — | 378 |
5.3. 2D–0D nanocomposites
Another strategy for improving the mechanical performance of 2D materials-based polymer nanocomposites is the introduction of zero-dimensional (0D) nanoparticles or nanospheres. Thanks to their spherical geometry, the combination of 0D and 2D nanofillers can create interlocking interfaces or core–shell structures that are more resistant to sliding or fracture. In addition, the presence of 0D nanofillers can inhibit the agglomeration of 2D nanosheets and promote homogeneous distributions in matrices. Different types of 0D nanoparticles such as SiO2,379–386 Al2O3,387–390 Ag,391,392 Fe2O3,393 carbon black (CB),394–396 nanodiamond (ND),397–399 lignin,400 zinc ferrite (ZF),401 and polyphosphazene (PZS)402,403 have been explored.Silica nanoparticles are widely used in polymer nanocomposites considering their excellent mechanical properties (∼150 GPa modulus).404 Zhang et al.384 prepared SiO2@h-BN/PVA composites via two different methods: solution blending and vacuum filtration. The bulk h-BN was exfoliated into nanosheets by ball milling and the SiO2@h-BN hybrids were prepared by hydrolysis as shown in Fig. 35a. For the solution casting method, the mixtures were poured into a mould and dried for twelve hours; for the vacuum filtration method, the mixtures were filtered by a vacuum system and dried in a vacuum oven. The Young's modulus and tensile strength were 1.8 GPa and 47 MPa for the neat PVA. It was found that composites prepared by vacuum filtration showed better mechanical performance due to a homogeneous distribution of fillers compared to the ones prepared by solution casting. On the other hand, the use of SiO2 improved the mechanical properties of the composites significantly. The Young's modulus and tensile strength of the composites were improved to 4.2 GPa and 110 MPa with the addition of 14.5 wt% h-BN, while these properties were improved further to 5.9 GPa and 156 MPa with the addition of 15.2 wt% SiO2@h-BN hybrids (14.5 wt% h-BN and 0.7 wt% SiO2). This further improvement in mechanical properties with the addition of SiO2 was attributed to a number of factors. As can be seen from Fig. 35b more fillers and interfaces are involved in the crack propagation procedure with the addition of SiO2, which leads to an increase in the resistance to fracture. This study demonstrates that the synergistic combination of 0D and 2D nanofillers is another effective strategy to improve the mechanical performance of nanocomposites.
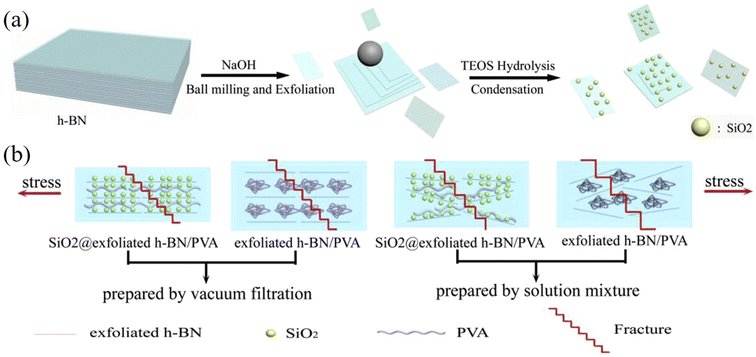 | ||
| Fig. 35 (a) Preparation of boron nitride nanosheets and SiO2@BN bybrids. (b) Fracture behaviour of PVA composites with h-BN and SiO2@h-BN prepared by solution casting and vacuum filtration. Reproduced with permission from ref. 384. Copyright 2018 Elsevier. | ||
The wrapping of nanoparticles with nanosheets to form a core–shell structure is an effective technique to improve the mechanical properties of nanocomposites.385 Zhou et al.402 prepared PZS@MoS2 structures whereby polyphosphazene (PZS) spheres were synthesized with active hydroxyl groups on their surface. The MoS2 nanosheets were assembled onto the nanospheres to form core–shell structures using a hydrothermal process. The PZS@MoS2/epoxy nanocomposites were then fabricated using solution blending and this strategy improved the storage modulus of the composites significantly. With the addition of 2 wt% PZS and MoS2 (individually), the storage modulus was improved by 17.2 and 51.9% respectively. This means that the effective elastic modulus of PZS is relatively low compared to the value for MoS2. Surprisingly, the storage modulus of the composite was improved by 91% with the addition of 2 wt% PZS@MoS2as the hydroxyl groups in the PZS@MoS2 hybrids improved the interfacial adhesion between the filler and the matrix. In addition, the core–shell structure with high stiffness restricted the movement of molecular chains and so improved the storage modulus of the nanocomposites.
An advantage of hybrid 2D–0D nanofillers is the formation of interlocking interfaces, which means that higher loading is needed to induce fracture failure. Zhang et al.397 investigated the synergistic effect of GO and ND on the fracture toughness of epoxy nanocomposites. The NDs were processed by amine-terminated (3-aminopropyl) triethoxysilane and the GO nanosheets were processed by (3-glycidyloxypropyl) trimethoxysilane. Strong covalent bonds were formed between ND and GO as confirmed by XPS. The epoxy composites were prepared by the solution casting method and it was found that the flexural properties and fracture toughness of the composites were improved significantly as shown in Fig. 36a and b. The strong covalent bonds between GO and ND improve the dispersion of NDs on GO nanosheets and prevents the GO nanosheets from agglomeration. Most importantly, the NDs play a crack pinning role in the enhancement of fracture toughness due to the formation of interlocking surfaces as shown in Fig. 36c and d. More energy is required to overcome the locking surfaces for crack propagation and the fracture toughness of the composites is therefore improved significantly. The mechanical properties of hybrid 2D-0D nanocomposites are summarized in Table 11.
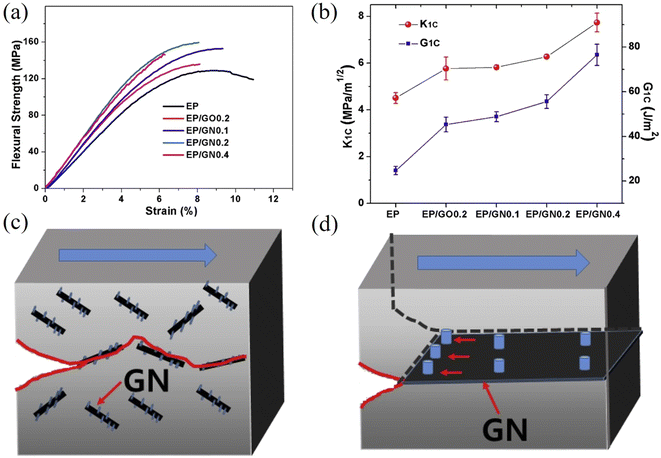 | ||
| Fig. 36 (a) Flexural stress–strain curves of epoxy and its nanocomposites. (b) Variation of fracture toughness of epoxy/GO/ND composites with filler content. (c and d) Crack propagation in epoxy/GO/ND composites. Reproduced with permission from ref. 397. Copyright 2017 Elsevier. | ||
| Filler 1 | Filler 2 | Matrix | Processing method | Matrix modulus (GPa) | Optimum hybrid filler (f1/f2) fraction | Increase (%) | Ref. | ||
|---|---|---|---|---|---|---|---|---|---|
| Young's modulus | Tensile strength | Fracture toughness | |||||||
| PHBV, poly(3-hydroxybutyrate-co-3-hydroxyvalerate); PAN, polyacrylonitrile. LM, liquid metal; ZHS, zinc hydroxystannate. | |||||||||
| GO | SiO2 | Epoxy | Solution casting | 1.36 | 20, 10, 10 wt% | 41 | 54 | 89 | 380 |
| GO | SiO2 | Epoxy | Solution casting | 2.64 | 0.1 wt% | 22.86 | 32.18 | — | 382 |
| GO | SiO2 | Epoxy | Solution casting | 2.133 | 0.25 wt% | 16 | 59 | — | 383 |
| GO | ND | Epoxy | Solution casting | — | 0.4 wt% | — | — | 70 | 397 |
| GO | LM | Epoxy | Solution casting | — | 3.17 wt% | — | — | 134 | 405 |
| GO | Al2O3 | PU | Solution casting | 0.00018 | 10 wt% | 211 | 41 | — | 387 |
| rGO | Fe2O3 | PMMA | In situ polymerization | 2 | 2/2 wt% | 137.86 | 124 | — | 393 |
| BN | SiO2 | PVA | Vacuum filtration | 1.8 | 15.2 wt% | 228 | 232 | — | 384 |
| BN | Ag | Epoxy | Solution casting | 1.05 | 20, 5 wt% | 33 | 20 | — | 391 |
| f-BN | ND | Epoxy | Solution casting | 2.3 | 29 wt% | 60 | — | — | 398 |
| BN | Lignin | PVA | Vacuum filtration | — | 2.5 vol% | — | 33 | — | 400 |
| BN | Al2O3 | PI | Solution casting | 1.23 | 20 wt% | 17 | — | — | 389 |
| MoS2 | ND | PHBV | Solution casting | 0.5294 | 1/2 wt% | 113 | 94 | — | 399 |
| MoS2 | SiO2 | Epoxy | Solution casting | 1.18 | 3 wt% | 46.5 | 68.7 | — | 385 |
| MoS2 | CB | SBR | Solution casting | — | 3 phr | — | 50 | — | 396 |
| f-MoS2 | SiO2 | PAN | Solution casting | — | 2 wt% | — | 42 | — | 386 |
| Ti3C2Tx | ZHS | Epoxy | Solution casting | 0.58 | 2 wt% | 312 | 43 | — | 406 |
6. Conclusions and outlook
The large family of two-dimensional materials displays a range of mechanical properties that can be used to tune the ultimate properties of model, bulk and hybrid polymer nanocomposites. In this present review we have evaluated the possibilities that arise from the use of 2D materials in the mechanical reinforcement of polymers. Despite the possibilities that the inherent properties of 2D materials can offer, the maximisation of their reinforcement efficiency in bulk polymer nanocomposites is still difficult. A number of issues arise from the preparation methods that can either lead to the fabrication of very small aspect ratio flakes, that suffer from interface slippage under stress, or flakes that display high defect densities, that are known to affect the intrinsic properties adversely. Simultaneously, the quality of exfoliated 2D materials that are available commercially is considered to be quite poor, and the batch-to-batch variation is high, identifying the need for the standardization in the fabrication and nomenclature of 2D and graphene-related materials. A step in this direction has been the publication of the ISO terminology for 2D materials (ISO/TS 80004-13:2017).With regards to model “sandwich” composites, it has been shown that the increase in the number of graphene layers leads to a reduction of the reinforcing efficiency of the material, since the interlayer van der Waals interactions are weak. For certain 2D materials, however, such as boron nitride and molybdenum disulphide the strength and modulus of the nanoplatelets does not decrease with increasing layer number due to large positive sliding energies. If such materials can be produced in bulk quantities with large lateral dimensions, they might be considered to be promising alternatives to multilayer graphene in bulk polymer nanocomposites, while offering other multifunctional properties such as electrical insulation. Similarly, MXenes are a very interesting family of 2D materials that show good potential for polymer reinforcement as a result of their surface termination with various functional groups and their hydrophilic nature which contribute to a homogeneous dispersion and strong polymer/filler interfaces. Nevertheless, the use of harsh chemicals for the etching process during the production of MXenes raises concerns regarding safety and environmental impact and as a result more sustainable and less hazardous methods need to be developed for MXene synthesis to mitigate these issues.
We evaluated the use of Raman and photoluminescence spectroscopies for the study of the mechanical properties of 2D materials on the nanoscale, highlighting once again the importance of these particular techniques in the field. It should be also noted that classical micromechanical theories such as the shear lag theory predict the optimal reinforcement by using two-dimensional nanoscale specimens (model nanocomposites), under an assumption that there is no interfacial slippage. Under this scenario, the mechanical properties of bulk polymer nanocomposites can be very effectively modelled using composite micromechanics.
The translation of the impressive intrinsic properties of 2D materials from model nanocomposites to bulk nanocomposites presents a number of challenges. The presence of defects arising from bulk exfoliation methods such as liquid-phase exfoliation or electrochemical exfoliation, limit the mechanical properties of the nanoplatelets. Similarly, wrinkles on the surface of the 2D nanoplatelets or loops/folds that are commonly present as a result of the high shear stresses developed during processing limit the effective aspect ratio of the flakes. Additionally, a homogeneous distribution of the 2D nanoplatelets is of utmost importance in order to maximise the mechanical performance of the nanocomposites. Finally, the development of a strong filler/matrix interface is a critical parameter in nanocomposites and further research into the easy functionalization of flakes for enhancing the interactions between the components of the system needs to be performed. Nevertheless, 2D materials are still more effective than their 1D counterparts when oriented randomly (this is common during standard industrial mixing processes). The effective modulus of 2D materials drops to less than half when they are randomly oriented, compared to tubular or fibre-shaped materials where the effective modulus is reduced by a factor of 5. Quite importantly, polymers reinforced with 2D materials can be processed much easier than those with nanotubes or nanofibers, as they do not form highly complex entanglements that are very difficult to break down and increase the viscosity significantly.
The advances in research upon 2D materials have opened up numerous prospects for the development of commercially-available polymer nanocomposites reinforced with 2D materials; the precise engineering of the structural characteristics, the aspect ratios and the surface chemistry of 2D materials along with progress in polymer processing hold the key for the further advances in this field.
Conflicts of interest
There are no conflicts to declare.References
- K. S. Novoselov, A. K. Geim, S. V. Morozov, D. Jiang, Y. Zhang, S. V. Dubonos, I. V. Grigorieva and A. A. Firsov, Science, 2004, 306, 666–669 CrossRef CAS PubMed.
- K. S. Novoselov, V. I. Fal'ko, L. Colombo, P. R. Gellert, M. G. Schwab and K. Kim, Nature, 2012, 490, 192–200 CrossRef CAS PubMed.
- C. Si, Z. Sun and F. Liu, Nanoscale, 2016, 8, 3207–3217 RSC.
- W. Choi, N. Choudhary, G. H. Han, J. Park, D. Akinwande and Y. H. Lee, Mater. Today, 2017, 20, 116–130 CrossRef CAS.
- J. Halim, S. Kota, M. R. Lukatskaya, M. Naguib, M. Q. Zhao, E. J. Moon, J. Pitock, J. Nanda, S. J. May, Y. Gogotsi and M. W. Barsoum, Adv. Funct. Mater., 2016, 26, 3118–3127 CrossRef CAS.
- A. Castellanos-Gomez, J. Phys. Chem. Lett., 2015, 6, 4280–4291 CrossRef CAS PubMed.
- C. L. Tan, X. H. Cao, X. J. Wu, Q. Y. He, J. Yang, X. Zhang, J. Z. Chen, W. Zhao, S. K. Han, G. H. Nam, M. Sindoro and H. Zhang, Chem. Rev., 2017, 117, 6225–6331 CrossRef CAS PubMed.
- A. A. Balandin, S. Ghosh, W. Z. Bao, I. Calizo, D. Teweldebrhan, F. Miao and C. N. Lau, Nano Lett., 2008, 8, 902–907 CrossRef CAS PubMed.
- K. S. Novoselov, A. K. Geim, S. V. Morozov, D. Jiang, M. I. Katsnelson, I. V. Grigorieva, S. V. Dubonos and A. A. Firsov, Nature, 2005, 438, 197–200 CrossRef CAS PubMed.
- V. Palermo, I. A. Kinloch, S. Ligi and N. M. Pugno, Adv. Mater., 2016, 28, 6232–6238 CrossRef CAS PubMed.
- P. W. Liu, A. L. Cottrill, D. Kozawa, V. B. Koman, D. Parviz, A. T. Liu, J. F. Yang, T. Q. Tran, M. H. Wong, S. Wang and M. S. Strano, Nano Today, 2018, 21, 18–40 CrossRef CAS.
- M. Dong, H. Zhang, L. Tzounis, G. Santagiuliana, E. Bilotti and D. G. Papageorgiou, Carbon, 2021, 185, 57–81 CrossRef CAS.
- D. Akinwande, C. J. Brennan, J. S. Bunch, P. Egberts, J. R. Felts, H. J. Gao, R. Huang, J. S. Kim, T. Li, Y. Li, K. M. Liechti, N. S. Lu, H. S. Park, E. J. Reed, P. Wang, B. I. Yakobson, T. Zhang, Y. W. Zhang, Y. Zhou and Y. Zhu, Extreme Mech. Lett., 2017, 13, 42–77 CrossRef.
- C. Androulidakis, K. H. Zhang, M. Robertson and S. Tawfick, 2D Mater., 2018, 5, 28 Search PubMed.
- C. Lee, X. D. Wei, J. W. Kysar and J. Hone, Science, 2008, 321, 385–388 CrossRef CAS PubMed.
- D. G. Papageorgiou, I. A. Kinloch and R. J. Young, Prog. Mater. Sci., 2017, 90, 75–127 CrossRef CAS.
- A. Falin, Q. R. Cai, E. J. G. Santos, D. Scullion, D. Qian, R. Zhang, Z. Yang, S. M. Huang, K. Watanabe, T. Taniguchi, M. R. Barnett, Y. Chen, R. S. Ruoff and L. H. Li, Nat. Commun., 2017, 8, 9 CrossRef PubMed.
- S. Bertolazzi, J. Brivio and A. Kis, ACS Nano, 2011, 5, 9703–9709 CrossRef CAS PubMed.
- L. Gong, I. A. Kinloch, R. J. Young, I. Riaz, R. Jalil and K. S. Novoselov, Adv. Mater., 2010, 22, 2694–2697 CrossRef CAS PubMed.
- T. Jiang, R. Huang and Y. Zhu, Adv. Funct. Mater., 2014, 24, 396–402 CrossRef CAS.
- X. K. Cai, Y. T. Luo, B. Liu and H. M. Cheng, Chem. Soc. Rev., 2018, 47, 6224–6266 RSC.
- R. J. Young, I. A. Kinloch, L. Gong and K. S. Novoselov, Compos. Sci. Technol., 2012, 72, 1459–1476 CrossRef CAS.
- D. G. Papageorgiou, Z. L. Li, M. F. Liu, I. A. Kinloch and R. J. Young, Nanoscale, 2020, 12, 2228–2267 RSC.
- H. Zhan, D. Guo and G. X. Xie, Nanoscale, 2019, 11, 13181–13212 RSC.
- M. Yi and Z. G. Shen, J. Mater. Chem. A, 2015, 3, 11700–11715 RSC.
- Y. Huang, E. Sutter, N. N. Shi, J. B. Zheng, T. Z. Yang, D. Englund, H. J. Gao and P. Sutter, ACS Nano, 2015, 9, 10612–10620 CrossRef CAS PubMed.
- Y. Hernandez, V. Nicolosi, M. Lotya, F. M. Blighe, Z. Y. Sun, S. De, I. T. McGovern, B. Holland, M. Byrne, Y. K. Gun'ko, J. J. Boland, P. Niraj, G. Duesberg, S. Krishnamurthy, R. Goodhue, J. Hutchison, V. Scardaci, A. C. Ferrari and J. N. Coleman, Nat. Nanotechnol., 2008, 3, 563–568 CrossRef CAS PubMed.
- Z. Li, R. J. Young, C. Backes, W. Zhao, X. Zhang, A. A. Zhukov, E. Tillotson, A. P. Conlan, F. Ding, S. J. Haigh, K. S. Novoselov and J. N. Coleman, ACS Nano, 2020, 14, 10976–10985 CrossRef CAS PubMed.
- A. Ciesielski and P. Samori, Chem. Soc. Rev., 2014, 43, 381–398 RSC.
- J. N. Coleman, M. Lotya, A. O'Neill, S. D. Bergin, P. J. King, U. Khan, K. Young, A. Gaucher, S. De, R. J. Smith, I. V. Shvets, S. K. Arora, G. Stanton, H. Y. Kim, K. Lee, G. T. Kim, G. S. Duesberg, T. Hallam, J. J. Boland, J. J. Wang, J. F. Donegan, J. C. Grunlan, G. Moriarty, A. Shmeliov, R. J. Nicholls, J. M. Perkins, E. M. Grieveson, K. Theuwissen, D. W. McComb, P. D. Nellist and V. Nicolosi, Science, 2011, 331, 568–571 CrossRef CAS PubMed.
- K. R. Paton, E. Varrla, C. Backes, R. J. Smith, U. Khan, A. O'Neill, C. Boland, M. Lotya, O. M. Istrate, P. King, T. Higgins, S. Barwich, P. May, P. Puczkarski, I. Ahmed, M. Moebius, H. Pettersson, E. Long, J. Coelho, S. E. O'Brien, E. K. McGuire, B. M. Sanchez, G. S. Duesberg, N. McEvoy, T. J. Pennycook, C. Downing, A. Crossley, V. Nicolosi and J. N. Coleman, Nat. Mater., 2014, 13, 624–630 CrossRef CAS PubMed.
- M. Yi and Z. G. Shen, Carbon, 2014, 78, 622–626 CrossRef CAS.
- W. W. Lei, V. N. Mochalin, D. Liu, S. Qin, Y. Gogotsi and Y. Chen, Nat. Commun., 2015, 6, 8 Search PubMed.
- J. Zheng, H. Zhang, S. H. Dong, Y. P. Liu, C. T. Nai, H. S. Shin, H. Y. Jeong, B. Liu and K. P. Loh, Nat. Commun., 2014, 5, 7 Search PubMed.
- L. Y. Niu, M. J. Li, X. M. Tao, Z. Xie, X. C. Zhou, A. P. A. Raju, R. J. Young and Z. J. Zheng, Nanoscale, 2013, 5, 7202–7208 RSC.
- S. Stankovich, D. A. Dikin, R. D. Piner, K. A. Kohlhaas, A. Kleinhammes, Y. Jia, Y. Wu, S. T. Nguyen and R. S. Ruoff, Carbon, 2007, 45, 1558–1565 CrossRef CAS.
- M. Naguib, M. Kurtoglu, V. Presser, J. Lu, J. J. Niu, M. Heon, L. Hultman, Y. Gogotsi and M. W. Barsoum, Adv. Mater., 2011, 23, 4248–4253 CrossRef CAS PubMed.
- Y. Zhang, L. Y. Zhang and C. W. Zhou, Acc. Chem. Res., 2013, 46, 2329–2339 CrossRef CAS PubMed.
- K. S. Kim, Y. Zhao, H. Jang, S. Y. Lee, J. M. Kim, K. S. Kim, J. H. Ahn, P. Kim, J. Y. Choi and B. H. Hong, Nature, 2009, 457, 706–710 CrossRef CAS PubMed.
- R. Munoz and C. Gomez-Aleixandre, Chem. Vap. Deposition, 2013, 19, 297–322 CrossRef CAS.
- X. S. Li, W. W. Cai, J. H. An, S. Kim, J. Nah, D. X. Yang, R. Piner, A. Velamakanni, I. Jung, E. Tutuc, S. K. Banerjee, L. Colombo and R. S. Ruoff, Science, 2009, 324, 1312–1314 CrossRef CAS PubMed.
- Y. J. Zhan, Z. Liu, S. Najmaei, P. M. Ajayan and J. Lou, Small, 2012, 8, 966–971 CrossRef CAS PubMed.
- B. Deng, P. C. Hsu, G. C. Chen, B. N. Chandrashekar, L. Liao, Z. Ayitimuda, J. X. Wu, Y. F. Guo, L. Lin, Y. Zhou, M. Aisijiang, Q. Xie, Y. Cui, Z. F. Liu and H. L. Peng, Nano Lett., 2015, 15, 4206–4213 CrossRef CAS PubMed.
- E. Schwerin, Z. Angew. Math. Mech., 1929, 9, 482–483 CrossRef.
- C. R. Jin, A. Davoodabadi, J. L. Li, Y. L. Wang and T. Singler, J. Mech. Phys. Solids, 2017, 100, 85–102 CrossRef CAS.
- J. Han, N. M. Pugno and S. Ryu, Nanoscale, 2015, 7, 15672–15679 RSC.
- A. Lipatov, H. D. Lu, M. Alhabeb, B. Anasori, A. Gruverman, Y. Gogotsi and A. Sinitskii, Sci. Adv., 2018, 4, 7 Search PubMed.
- K. Cao, S. Feng, Y. Han, L. Gao, T. Hue Ly, Z. Xu and Y. Lu, Nat. Commun., 2020, 11, 284 CrossRef CAS PubMed.
- C. Rong, T. Su, Z. Li, T. Chu, M. Zhu, Y. Yan, B. Zhang and F.-Z. Xuan, Nat. Commun., 2024, 15, 1566 CrossRef CAS PubMed.
- J. Varillas, J. Lukeš, A. Manikas, J. Maňák, J. Dluhoš, Z. Melníková, M. Kalbáč, C. Galiotis and O. Frank, Int. J. Mech. Sci., 2024, 273, 109208 CrossRef.
- C. M. Stafford, C. Harrison, K. L. Beers, A. Karim, E. J. Amis, M. R. Vanlandingham, H. C. Kim, W. Volksen, R. D. Miller and E. E. Simonyi, Nat. Mater., 2004, 3, 545–550 CrossRef CAS PubMed.
- A. L. Volynskii, S. Bazhenov, O. V. Lebedeva and N. F. Bakeev, J. Mater. Sci., 2000, 35, 547–554 CrossRef CAS.
- M. Dong, Y. Sun, D. J. Dunstan and D. G. Papageorgiou, Nanoscale, 2022, 14, 7872–7880 RSC.
- N. Iguiniz, R. Frisenda, R. Bratschitsch and A. Castellanos-Gomez, Adv. Mater., 2019, 31, 6 Search PubMed.
- C. Di Giorgio, E. Blundo, G. Pettinari, M. Felici, F. Bobba and A. Polimeni, Adv. Mater. Interfaces, 2022, 9, 2102220 CrossRef CAS.
- G. Wang, H. Hou, Y. Yan, R. Jagatramka, A. Shirsalimian, Y. Wang, B. Li, M. Daly and C. Cao, Int. J. Extreme Manuf., 2023, 5, 032002 CrossRef.
- G. H. Lee, R. C. Cooper, S. J. An, S. Lee, A. van der Zande, N. Petrone, A. G. Hammerherg, C. Lee, B. Crawford, W. Oliver, J. W. Kysar and J. Hone, Science, 2013, 340, 1073–1076 CrossRef CAS PubMed.
- X. D. Wei, Z. X. Meng, L. Ruiz, W. J. Xia, C. Lee, J. W. Kysar, J. C. Hone, S. Keten and H. D. Espinosa, ACS Nano, 2016, 10, 1820–1828 CrossRef CAS PubMed.
- J. W. Suk, R. D. Piner, J. H. An and R. S. Ruoff, ACS Nano, 2010, 4, 6557–6564 CrossRef CAS PubMed.
- A. Castellanos-Gomez, M. Poot, G. A. Steele, H. S. J. van der Zant, N. Agrait and G. Rubio-Bollinger, Adv. Mater., 2012, 24, 772–775 CrossRef CAS PubMed.
- K. Liu, Q. M. Yan, M. Chen, W. Fan, Y. H. Sun, J. Suh, D. Y. Fu, S. Lee, J. Zhou, S. Tongay, J. Ji, J. B. Neaton and J. Q. Wu, Nano Lett., 2014, 14, 5097–5103 CrossRef CAS PubMed.
- Y. C. Yang, X. Li, M. R. Wen, E. Hacopian, W. B. Chen, Y. J. Gong, J. Zhang, B. Li, W. Zhou, P. M. Ajayan, Q. Chen, T. Zhu and J. Lou, Adv. Mater., 2017, 29, 7 Search PubMed.
- R. Zhang, V. Koutsos and R. Cheung, Appl. Phys. Lett., 2016, 108, 5 Search PubMed.
- Y. F. Sun, J. B. Pan, Z. T. Zhang, K. N. Zhang, J. Liang, W. J. Wang, Z. Q. Yuan, Y. K. Hao, B. L. Wang, J. W. Wang, Y. Wu, J. Y. Zheng, L. Y. Jiao, S. Y. Zhou, K. H. Liu, C. Cheng, W. H. Duan, Y. Xu, Q. M. Yan and K. Liu, Nano Lett., 2019, 19, 761–769 CrossRef CAS PubMed.
- J. W. Li, N. V. Medhekar and V. B. Shenoy, J. Phys. Chem. C, 2013, 117, 15842–15848 CrossRef CAS.
- V. N. Borysiuk, V. N. Mochalin and Y. Gogotsi, Nanotechnology, 2015, 26, 10 CrossRef PubMed.
- A. Lipatov, M. Alhabeb, H. D. Lu, S. S. Zhao, M. J. Loes, N. S. Vorobeva, Y. Dall'Agnese, Y. Gao, A. Gruverman, Y. Gogotsi and A. Sinitskii, Adv. Electron. Mater., 2020, 6, 10 Search PubMed.
- J. Tao, W. F. Shen, S. Wu, L. Liu, Z. H. Feng, C. Wang, C. G. Hu, P. Yao, H. Zhang, W. Pang, X. X. Duan, J. Liu, C. W. Zhou and D. H. Zhang, ACS Nano, 2015, 9, 11362–11370 CrossRef CAS PubMed.
- H. Chen, P. Huang, D. Guo and G. X. Xie, J. Phys. Chem. C, 2016, 120, 29491–29497 CrossRef CAS.
- L. Vaquero-Garzon, R. Frisenda and A. Castellanos-Gomez, Nanoscale, 2019, 11, 12080–12086 RSC.
- F. Banhart, J. Kotakoski and A. V. Krasheninnikov, ACS Nano, 2011, 5, 26–41 CrossRef CAS PubMed.
- X. Zhao, D. G. Papageorgiou, L. Y. Zhu, F. Ding and R. J. Young, Nanoscale, 2019, 11, 14339–14353 RSC.
- L. Song, L. J. Ci, H. Lu, P. B. Sorokin, C. H. Jin, J. Ni, A. G. Kvashnin, D. G. Kvashnin, J. Lou, B. I. Yakobson and P. M. Ajayan, Nano Lett., 2010, 10, 3209–3215 CrossRef CAS PubMed.
- W. J. Chen, X. C. Gui, L. L. Yang, H. Zhu and Z. K. Tang, Nanoscale Horiz., 2019, 4, 291–320 RSC.
- C. S. Ruiz-Vargas, H. L. L. Zhuang, P. Y. Huang, A. M. van der Zande, S. Garg, P. L. McEuen, D. A. Muller, R. G. Hennig and J. Park, Nano Lett., 2011, 11, 2259–2263 CrossRef CAS PubMed.
- G. Lopez-Polin, C. Gomez-Navarro, V. Parente, F. Guinea, M. I. Katsnelson, F. Perez-Murano and J. Gomez-Herrero, Nat. Phys., 2015, 11, 26–31 Search PubMed.
- R. Grantab, V. B. Shenoy and R. S. Ruoff, Science, 2010, 330, 946–948 CrossRef CAS PubMed.
- R. J. T. Nicholl, H. J. Conley, N. V. Lavrik, I. Vlassiouk, Y. S. Puzyrev, V. P. Sreenivas, S. T. Pantelides and K. I. Bolotin, Nat. Commun., 2015, 6, 7 Search PubMed.
- G. Lopez-Polin, J. Gomez-Herrero and C. Gomez-Navarro, Nano Lett., 2015, 15, 2050–2054 CrossRef CAS PubMed.
- R. C. Cooper, C. Lee, C. A. Marianetti, X. D. Wei, J. Hone and J. W. Kysar, Phys. Rev. B: Condens. Matter Mater. Phys., 2013, 87, 11 Search PubMed.
- P. Zhang, L. L. Ma, F. F. Fan, Z. Zeng, C. Peng, P. E. Loya, Z. Liu, Y. J. Gong, J. N. Zhang, X. X. Zhang, P. M. Ajayan, T. Zhu and J. Lou, Nat. Commun., 2014, 5, 7 Search PubMed.
- S. S. Wang, Z. Qin, G. S. Jung, F. J. Martin-Martinez, K. Zhang, M. J. Buehler and J. H. Warner, ACS Nano, 2016, 10, 9831–9839 CrossRef CAS PubMed.
- A. A. Griffith and G. I. Taylor, Philosophical Transactions of the Royal Society of London. Series A, Containing Papers of a Mathematical or Physical Character, 1921, vol. 221, pp. 163–198 Search PubMed.
- A. J. Kinloch and R. J. Young, Fracture behaviour of polymers, Springer Science & Business Media, Dordrecht, 2013 Search PubMed.
- X. Zhao, B. Mao, M. Liu, J. Cao, S. J. Haigh, D. G. Papageorgiou, Z. Li and R. J. Young, Adv. Funct. Mater., 2022, 32, 2202373 CrossRef CAS.
- X. L. Wei, S. Xiao, F. X. Li, D. M. Tang, Q. Chen, Y. Bando and D. Golberg, Nano Lett., 2015, 15, 689–694 CrossRef CAS PubMed.
- G. Jung, Z. Qin and M. J. Buehler, Extreme Mech. Lett., 2015, 2, 52–59 CrossRef.
- S. R. Na, X. H. Wang, R. D. Piner, R. Huang, C. G. Willson and K. M. Liechti, ACS Nano, 2016, 10, 9616–9625 CrossRef CAS PubMed.
- Y. C. Yang, Z. G. Song, G. Y. Lu, Q. H. Zhang, B. Y. Zhang, B. Ni, C. Wang, X. Y. Li, L. Gu, X. M. Xie, H. J. Gao and J. Lou, Nature, 2021, 594, 57–61 CrossRef CAS PubMed.
- C. H. Cao, S. Mukherjee, J. Y. Howe, D. D. Perovic, Y. Sun, C. V. Singh and T. Filleter, Sci. Adv., 2018, 4, 9 Search PubMed.
- M. K. Blees, A. W. Barnard, P. A. Rose, S. P. Roberts, K. L. McGill, P. Y. Huang, A. R. Ruyack, J. W. Kevek, B. Kobrin, D. A. Muller and P. L. McEuen, Nature, 2015, 524, 204–207 CrossRef CAS PubMed.
- R. J. Young and P. A. Lovell, Introduction to Polymers, CRC Press, Boca Raton, 2011 Search PubMed.
- H. L. Cox, Br. J. Appl. Phys., 1952, 3, 72–79 CrossRef.
- Z. H. Ni, T. Yu, Y. H. Lu, Y. Y. Wang, Y. P. Feng and Z. X. Shen, ACS Nano, 2008, 2, 2301–2305 CrossRef CAS PubMed.
- T. M. G. Mohiuddin, A. Lombardo, R. R. Nair, A. Bonetti, G. Savini, R. Jalil, N. Bonini, D. M. Basko, C. Galiotis, N. Marzari, K. S. Novoselov, A. K. Geim and A. C. Ferrari, Phys. Rev. B: Condens. Matter Mater. Phys., 2009, 79, 8 CrossRef.
- M. Y. Huang, H. G. Yan, C. Y. Chen, D. H. Song, T. F. Heinz and J. Hone, Proc. Natl. Acad. Sci. U. S. A., 2009, 106, 7304–7308 CrossRef CAS PubMed.
- O. Frank, M. Mohr, J. Maultzsch, C. Thomsen, I. Riaz, R. Jalil, K. S. Novoselov, G. Tsoukleri, J. Parthenios, K. Papagelis, L. Kavan and C. Galiotis, ACS Nano, 2011, 5, 2231–2239 CrossRef CAS PubMed.
- D. Yoon, Y. W. Son and H. Cheong, Phys. Rev. Lett., 2011, 106, 4 Search PubMed.
- I. Polyzos, M. Bianchi, L. Rizzi, E. N. Koukaras, J. Parthenios, K. Papagelis, R. Sordan and C. Galiotis, Nanoscale, 2015, 7, 13033–13042 RSC.
- C. Androulidakis, E. N. Koukaras, M. Poss, K. Papagelis, C. Galiotis and S. Tawfick, Phys. Rev. B, 2018, 97, 6 CrossRef.
- C. Rice, R. J. Young, R. Zan, U. Bangert, D. Wolverson, T. Georgiou, R. Jalil and K. S. Novoselov, Phys. Rev. B: Condens. Matter Mater. Phys., 2013, 87, 5 Search PubMed.
- Y. L. Wang, C. X. Cong, C. Y. Qiu and T. Yu, Small, 2013, 9, 2857–2861 CrossRef CAS PubMed.
- H. J. Conley, B. Wang, J. I. Ziegler, R. F. Haglund, S. T. Pantelides and K. I. Bolotin, Nano Lett., 2013, 13, 3626–3630 CrossRef CAS PubMed.
- Z. W. Li, Y. W. Lv, L. W. Ren, J. Li, L. A. Kong, Y. J. Zeng, Q. Y. Tao, R. X. Wu, H. F. Ma, B. Zhao, D. Wang, W. Q. Dang, K. Q. Chen, L. Liao, X. D. Duan, X. F. Duan and Y. Liu, Nat. Commun., 2020, 11, 8 CrossRef PubMed.
- A. M. Dadgar, D. Scullion, K. Kang, D. Esposito, E. H. Yang, I. P. Herman, M. A. Pimenta, E. J. G. Santos and A. N. Pasupathy, Chem. Mater., 2018, 30, 5148–5155 CrossRef CAS.
- F. Wang, I. A. Kinloch, D. Wolverson, R. Tenne, A. Zak, E. O'Connell, U. Bangert and R. J. Young, 2D Mater., 2017, 4, 14 Search PubMed.
- F. Wang, S. Li, M. A. Bissett, I. A. Kinloch, Z. Li and R. J. Young, 2D Mater., 2020, 7, 045022 CrossRef CAS.
- M. F. Liu, Y. L. Zhuo, A. Sarycheva, Y. Gogotsi, M. A. Bissett, R. J. Young and I. A. Kinloch, ACS Appl. Mater. Interfaces, 2022, 14, 10681–10690 CrossRef CAS PubMed.
- X. Wang, K. Tantiwanichapan, J. W. Christopher, R. Paiella and A. K. Swan, Nano Lett., 2015, 15, 5969–5975 CrossRef CAS PubMed.
- H. Yan, M. Zhang, S. Wang, H. Li, S. Kunsági-Máté and S. Yin, Appl. Surf. Sci., 2023, 610, 155531 CrossRef CAS.
- Y. Huang and R. J. Young, Compos. Sci. Technol., 1994, 52, 505–517 CrossRef CAS.
- R. J. Young, L. Gong, I. A. Kinloch, I. Riaz, R. Jalil and K. S. Novoselov, ACS Nano, 2011, 5, 3079–3084 CrossRef CAS PubMed.
- G. Anagnostopoulos, C. Androulidakis, E. N. Koukaras, G. Tsoukleri, I. Polyzos, J. Parthenios, K. Papagelis and C. Galiotis, ACS Appl. Mater. Interfaces, 2015, 7, 4216–4223 CrossRef CAS PubMed.
- Z. Liu, M. Amani, S. Najmaei, Q. Xu, X. L. Zou, W. Zhou, T. Yu, C. Y. Qiu, A. G. Birdwell, F. J. Crowne, R. Vajtai, B. I. Yakobson, Z. H. Xia, M. Dubey, P. M. Ajayan and J. Lou, Nat. Commun., 2014, 5, 9 CrossRef PubMed.
- M. Dong, R. J. Young, D. J. Dunstan and D. G. Papageorgiou, Compos. Sci. Technol., 2023, 233, 109892 CrossRef CAS.
- I. Niehues, A. Blob, T. Stiehm, R. Schmidt, V. Jadrisko, B. Radatovic, D. Capeta, M. Kralj, S. M. de Vasconcellos and R. Bratschitsch, 2D Mater., 2018, 5, 031003 CrossRef.
- A. C. Manikas, M. G. Pastore Carbone, C. R. Woods, Y. Wang, I. Souli, G. Anagnostopoulos, M. Hadjinicolaou, K. S. Novoselov and C. Galiotis, Nanoscale, 2019, 11, 14354–14361 RSC.
- M. G. Pastore Carbone, G. Tsoukleri, A. C. Manikas, E. Makarona, C. Tsamis and C. Galiotis, J. Compos. Sci., 2019, 3, 42 CrossRef.
- G. Guo and Y. Zhu, J. Appl. Mech., 2015, 82, 031005 CrossRef.
- Z. L. Li, I. A. Kinloch, R. J. Young, K. S. Novoselov, G. Anagnostopoulos, J. Parthenios, C. Galiotis, K. Papagelis, C. Y. Lu and L. Britnell, ACS Nano, 2015, 9, 3917–3925 CrossRef CAS PubMed.
- Z. L. Li, R. J. Young, D. G. Papageorgiou, I. A. Kinloch, X. Zhao, C. Yang and S. J. Hao, 2D Mater., 2019, 6, 11 Search PubMed.
- C. Androulidakis, E. N. Koukaras, J. Rahova, K. Sampathkumar, J. Parthenios, K. Papagelis, O. Frank and C. Galiotis, ACS Appl. Mater. Interfaces, 2017, 9, 26593–26601 CrossRef CAS PubMed.
- J. Yu, S. Kim, E. Ertekin and A. M. van der Zande, ACS Appl. Mater. Interfaces, 2020, 12, 10801–10808 CrossRef CAS PubMed.
- Q. H. Zhang, Z. Y. Chang, G. Z. Xu, Z. Y. Wang, Y. P. Zhang, Z. Q. Xu, S. J. Chen, Q. L. Bao, J. Z. Liu, Y. W. Mai, W. H. Duan, M. S. Fuhrer and C. X. Zheng, Adv. Funct. Mater., 2016, 26, 8707–8714 CrossRef CAS.
- G. R. Wang, Z. H. Dai, L. Q. Liu, H. Hu, Q. Dai and Z. Zhang, ACS Appl. Mater. Interfaces, 2016, 8, 22554–22562 CrossRef CAS PubMed.
- F. Najafi, G. Wang, S. Mukherjee, T. Cui, T. Filleter and C. V. Singh, Compos. Sci. Technol., 2020, 194, 108140 CrossRef CAS.
- Y. Y. Cui, G. R. Wang, W. X. Wang, X. W. Cui, W. L. Dong, C. Y. Wang, M. H. Jin, T. He, Z. Zhang and L. Q. Liu, Compos. Sci. Technol., 2022, 225, 8 CrossRef.
- L. Gong, R. J. Young, I. A. Kinloch, I. Riaz, R. Jalil and K. S. Novoselov, ACS Nano, 2012, 6, 2086–2095 CrossRef CAS PubMed.
- C. Androulidakis, E. N. Koukaras, G. Paterakis, G. Trakakis and C. Galiotis, Nat. Commun., 2020, 11, 1595 CrossRef CAS PubMed.
- A. P. Sgouros, C. Androulidakis, G. Tsoukleri, G. Kalosakas, N. Delikoukos, S. Signetti, N. M. Pugno, J. Parthenios, C. Galiotis and K. Papagelis, ACS Appl. Mater. Interfaces, 2021, 13, 4473–4484 CrossRef CAS PubMed.
- W. M. Wang, Z. L. Li, A. J. Marsden, M. A. Bissett and R. J. Young, 2D Mater., 2021, 8, 8 Search PubMed.
- Y. Y. Li, Z. X. Hu, S. H. Lin, S. K. Lai, W. Ji and S. P. Lau, Adv. Funct. Mater., 2017, 27, 9 Search PubMed.
- C. Androulidakis, D. Sourlantzis, E. N. Koukaras, A. C. Manikas and C. Galiotis, Nanoscale Adv., 2019, 1, 4972–4980 RSC.
- I. Vlassiouk, G. Polizos, R. Cooper, I. Ivanov, J. K. Keum, F. Paulauskas, P. Datskos and S. Smirnov, ACS Appl. Mater. Interfaces, 2015, 7, 10702–10709 CrossRef CAS PubMed.
- P. W. Liu, Z. Jin, G. Katsukis, L. W. Drahushuk, S. Shimizu, C. J. Shih, E. D. Wetzel, J. K. Taggart-Scarff, B. Qing, K. J. Van Vliet, R. Li, B. L. Wardle and M. S. Strano, Science, 2016, 353, 364–367 CrossRef CAS PubMed.
- B. Wang, Z. C. Li, C. H. Wang, S. Signetti, B. V. Cunning, X. Z. Wu, Y. Huang, Y. Jiang, H. F. Shi, S. Ryu, N. M. Pugno and R. S. Ruoff, Adv. Mater., 2018, 30, 10 Search PubMed.
- C. Pavlou, M. G. P. Carbone, A. C. Manikas, G. Trakakis, C. Koral, G. Papari, A. Andreone and C. Galiotis, Nat. Commun., 2021, 12, 9 CrossRef PubMed.
- S.-I. Kim, J.-Y. Moon, S.-K. Hyeong, S. Ghods, J.-S. Kim, J.-H. Choi, D. S. Park, S. Bae, S. H. Cho, S.-K. Lee and J.-H. Lee, Nat. Commun., 2024, 15, 2172 CrossRef CAS PubMed.
- A. Kundu, W. K. Seong, S. K. Jalali, N. M. Pugno and R. S. Ruoff, 2024, arXiv preprint arXiv:2405.11888, DOI:10.48550/arXiv.2405.11888.
- K. S. Hu, D. D. Kulkarni, I. Choi and V. V. Tsukruk, Prog. Polym. Sci., 2014, 39, 1934–1972 CrossRef CAS.
- S. Thakur, P. Bandyopadhyay, S. H. Kim, N. H. Kim and J. H. Lee, Composites, Part A, 2018, 110, 284–293 CrossRef CAS.
- C. B. Hatter, J. Shah, B. Anasori and Y. Gogotsi, Composites, Part B, 2020, 182, 7 CrossRef.
- O. Eksik, J. Gao, S. A. Shojaee, A. Thomas, P. Chow, S. F. Bartolucci, D. A. Lucca and N. Koratkar, ACS Nano, 2014, 8, 5282–5289 CrossRef CAS PubMed.
- Y. Li, H. Zhang, H. Porwal, Z. Huang, E. Bilotti and T. Peijs, Composites, Part A, 2017, 95, 229–236 CrossRef CAS.
- Y. Li, H. Zhang, M. Crespo, H. Porwal, O. Picot, G. Santagiuliana, Z. H. Huang, E. Barbieri, N. M. Pugno, T. Peijs and E. Bilotti, ACS Appl. Mater. Interfaces, 2016, 8, 24112–24122 CrossRef CAS PubMed.
- H. Ribeiro, J. P. C. Trigueiro, W. M. Silva, C. F. Woellner, P. S. Owuor, A. Cristian Chipara, M. C. Lopes, C. S. Tiwary, J. J. Pedrotti, R. Villegas Salvatierra, J. M. Tour, N. Chopra, I. N. Odeh, G. G. Silva and P. M. Ajayan, ACS Appl. Mater. Interfaces, 2019, 11, 24485–24492 CrossRef CAS PubMed.
- M. Dong, O. Tomes, A. Soul, Y. Hu, E. Bilotti, H. Zhang and D. G. Papageorgiou, ACS Appl. Nano Mater., 2024, 7, 3314–3325 CrossRef CAS.
- D. G. Papageorgiou, Z. Terzopoulou, A. Fina, F. Cuttica, G. Z. Papageorgiou, D. N. Bikiaris, K. Chrissafis, R. J. Young and I. A. Kinloch, Compos. Sci. Technol., 2018, 156, 95–102 CrossRef CAS.
- X. X. Sheng, Y. F. Zhao, L. Zhang and X. Lu, Compos. Sci. Technol., 2019, 181, 8 CrossRef.
- M. F. Liu, S. H. Li, I. A. Kinloch, R. J. Young and D. G. Papageorgiou, 2D Mater., 2020, 7, 025031 CrossRef CAS.
- M. F. Liu, I. A. Kinloch, R. J. Young and D. G. Papageorgiou, Nanoscale, 2020, 12, 3377–3386 RSC.
- M. F. Liu, D. G. Papageorgiou, S. H. Li, K. L. Lin, I. A. Kinloch and R. J. Young, Composites, Part A, 2018, 110, 84–92 CrossRef CAS.
- M. F. Liu, I. A. Kinloch, R. J. Young and D. G. Papageorgiou, Composites, Part B, 2019, 178, 8 Search PubMed.
- C. Vilaverde, R. M. Santos, M. C. Paiva and J. A. Covas, Composites, Part A, 2015, 78, 143–151 CrossRef CAS.
- G. Santagiuliana, O. T. Picot, M. Crespo, H. Porwal, H. Zhang, Y. Li, L. Rubini, S. Colonna, A. Fina, E. Barbieri, A. B. Spoelstra, G. Mirabello, J. P. Patterson, L. Botto, N. M. Pugno, T. Peijs and E. Bilotti, ACS Nano, 2018, 12, 9040–9050 CrossRef CAS PubMed.
- H. W. Wei, J. D. Dong, X. J. Fang, W. H. Zheng, Y. T. Sun, Y. Qian, Z. X. Jiang and Y. D. Huang, Compos. Sci. Technol., 2019, 169, 52–59 CrossRef CAS.
- Y. Tong, M. He, Y. M. Zhou, X. Zhong, L. D. Fan, T. Y. Huang, Q. Liao and Y. J. Wang, Appl. Surf. Sci., 2018, 434, 283–293 CrossRef CAS.
- M. Bhattacharya, Materials, 2016, 9, 35 CrossRef PubMed.
- G. Decher, Science, 1997, 277, 1232–1237 CrossRef CAS.
- F. X. Xiao, M. Pagliaro, Y. J. Xu and B. Liu, Chem. Soc. Rev., 2016, 45, 3088–3121 RSC.
- M. Yang, Y. Hou and N. A. Kotov, Nano Today, 2012, 7, 430–447 CrossRef CAS.
- H. Chen, M. B. Müller, K. J. Gilmore, G. G. Wallace and D. Li, Adv. Mater., 2008, 20, 3557–3561 CrossRef CAS.
- F. M. Xiang, D. Parviz, T. M. Givens, P. Tzeng, E. M. Davis, C. M. Stafford, M. J. Green and J. C. Grunlan, Adv. Funct. Mater., 2016, 26, 2143–2149 CrossRef CAS.
- C. J. Huang and Q. F. Cheng, Compos. Sci. Technol., 2017, 150, 141–166 CrossRef CAS.
- K. W. Putz, O. C. Compton, M. J. Palmeri, S. T. Nguyen and L. C. Brinson, Adv. Funct. Mater., 2010, 20, 3322–3329 CrossRef CAS.
- G. Marom and H. D. Wagner, J. Mater. Sci., 2017, 52, 8357–8361 CrossRef CAS.
- Z. L. Li, R. J. Young, N. R. Wilson, I. A. Kinloch, C. Valles and Z. Li, Compos. Sci. Technol., 2016, 123, 125–133 CrossRef CAS.
- Z. L. Li, R. J. Young, I. A. Kinloch, N. R. Wilson, A. J. Marsden and A. P. A. Raju, Carbon, 2015, 88, 215–224 CrossRef CAS.
- M. Dong, Y. Hu, H. Zhang, E. Bilotti, N. Pugno, D. Dunstan and D. G. Papageorgiou, JCOMC, 2024, 13, 100427 CAS.
- Z. L. Li, J. W. Chu, C. Yang, S. J. Hao, M. A. Bissett, I. A. Kinloch and R. J. Youn, Compos. Sci. Technol., 2018, 163, 116–122 CrossRef CAS.
- R. J. Young, M. F. Liu, I. A. Kinloch, S. H. Li, X. Zhao, C. Valles and D. G. Papageorgiou, Compos. Sci. Technol., 2018, 154, 110–116 CrossRef CAS.
- J. C. H. Affdl and J. L. Kardos, Polym. Eng. Sci., 1976, 16, 344–352 CrossRef.
- J. J. Liang, Y. Huang, L. Zhang, Y. Wang, Y. F. Ma, T. Y. Guo and Y. S. Chen, Adv. Funct. Mater., 2009, 19, 2297–2302 CrossRef CAS.
- C. Vallés, I. A. Kinloch, R. J. Young, N. R. Wilson and J. P. Rourke, Compos. Sci. Technol., 2013, 88, 158–164 CrossRef.
- J. C. Wang, X. B. Wang, C. H. Xu, M. Zhang and X. P. Shang, Polym. Int., 2011, 60, 816–822 CrossRef CAS.
- X. Mi, N. Liang, H. Xu, J. Wu, Y. Jiang, B. Nie and D. Zhang, Prog. Mater. Sci., 2022, 130, 100977 CrossRef CAS.
- M. Y. Khalid, A. Kamal, A. Otabil, O. Mamoun and K. Liao, Chem. Eng. J. Adv., 2023, 16, 100537 CrossRef CAS.
- L.-C. Tang, Y.-J. Wan, D. Yan, Y.-B. Pei, L. Zhao, Y.-B. Li, L.-B. Wu, J.-X. Jiang and G.-Q. Lai, Carbon, 2013, 60, 16–27 CrossRef CAS.
- F. Z. Wang, L. T. Drzal, Y. Qin and Z. X. Huang, Composites, Part A, 2016, 87, 10–22 CrossRef CAS.
- Y. Q. Li, T. Yu, T. Y. Yang, L. X. Zheng and K. Liao, Adv. Mater., 2012, 24, 3426–3431 CrossRef CAS PubMed.
- N. F. Zhao, M. Yang, Q. Zhao, W. W. Gao, T. Xie and H. Bai, ACS Nano, 2017, 11, 4777–4784 CrossRef CAS PubMed.
- L. X. Gong, Y. B. Pei, Q. Y. Han, L. Zhao, L. B. Wu, J. X. Jiang and L. C. Tang, Compos. Sci. Technol., 2016, 134, 144–152 CrossRef CAS.
- C. Valles, D. G. Papageorgiou, F. Lin, Z. L. Li, B. Spencer, R. J. Young and I. A. Kinloch, Carbon, 2020, 157, 750–760 CrossRef CAS.
- D. R. Bortz, E. G. Heras and I. Martin-Gullon, Macromolecules, 2012, 45, 238–245 CrossRef CAS.
- M. Huskić, S. Bolka, A. Vesel, M. Mozetič, A. Anžlovar, A. Vizintin and E. Žagar, Eur. Polym. J., 2018, 101, 211–217 CrossRef.
- R. Aradhana, S. Mohanty and S. K. Nayak, Polymer, 2018, 141, 109–123 CrossRef CAS.
- W. Zheng, W. G. Chen, Q. Zhao, S. X. Ren and Y. Q. Fu, Polymer, 2019, 163, 171–177 CrossRef CAS.
- C. J. Huang, J. S. Peng, S. J. Wan, Y. Du, S. X. Dou, H. D. Wagner, A. P. Tomsia, L. Jiang and Q. F. Cheng, Angew. Chem., Int. Ed., 2019, 58, 7636–7640 CrossRef CAS PubMed.
- J. Cha, J. Kim, S. Ryu and S. H. Hong, Composites, Part B, 2019, 162, 283–288 CrossRef CAS.
- F. Cilento, A. Martone, M. G. Pastore Carbone, C. Galiotis and M. Giordano, Compos. Sci. Technol., 2021, 211, 108873 CrossRef CAS.
- J. Guest, I. A. Kinloch and R. J. Young, J. Mater. Sci., 2023, 58, 9473–9485 CrossRef CAS.
- Y. Xu, W. Hong, H. Bai, C. Li and G. Shi, Carbon, 2009, 47, 3538–3543 CrossRef CAS.
- S. Lee, J.-U. Jin, J. R. Hahn, S. Ryu and N.-H. You, Composites, Part B, 2024, 271, 111142 CrossRef CAS.
- X. Zhao, Q. H. Zhang, D. J. Chen and P. Lu, Macromolecules, 2010, 43, 2357–2363 CrossRef CAS.
- X. D. Wang, X. H. Liu, H. Y. Yuan, H. Liu, C. T. Liu, T. X. Li, C. Yan, X. R. Yan, C. Y. Shen and Z. H. Guo, Mater. Des., 2018, 139, 372–379 CrossRef CAS.
- L. Zhang, Y. Li, H. Wang, Y. Qiao, J. Chen and S. Cao, Chem. Eng. J., 2015, 264, 538–546 CrossRef CAS.
- M. Fang, K. G. Wang, H. B. Lu, Y. L. Yang and S. Nutt, J. Mater. Chem., 2009, 19, 7098–7105 RSC.
- S. S. Rahman, M. Arshad, M. Zubair, M. Ghasri-Khouzani, A. Qureshi and A. Ullah, Mater. Today Commun., 2020, 25, 101633 CrossRef CAS.
- S. Vadukumpully, J. Paul, N. Mahanta and S. Valiyaveettil, Carbon, 2011, 49, 198–205 CrossRef CAS.
- P. G. Song, Z. H. Cao, Y. Z. Cai, L. P. Zhao, Z. P. Fang and S. Y. Fu, Polymer, 2011, 52, 4001–4010 CrossRef CAS.
- O.-K. Park, J.-Y. Hwang, M. Goh, J. H. Lee, B.-C. Ku and N.-H. You, Macromolecules, 2013, 46, 3505–3511 CrossRef CAS.
- C. Min, Z. He, H. Liang, D. Liu, C. Dong, H. Song and Y. Huang, Polym. Compos., 2020, 41, 1624–1635 CrossRef CAS.
- M. El Achaby, F. Z. Arrakhiz, S. Vaudreuil, E. M. Essassi and A. Qaiss, Appl. Surf. Sci., 2012, 258, 7668–7677 CrossRef CAS.
- X. Yang, Y. Tu, L. Li, S. Shang and X.-m. Tao, ACS Appl. Mater. Interfaces, 2010, 2, 1707–1713 CrossRef CAS PubMed.
- S. Wan, J. Peng, Y. Li, H. Hu, L. Jiang and Q. Cheng, ACS Nano, 2015, 9, 9830–9836 CrossRef CAS PubMed.
- S. Lin, M. A. S. Anwer, Y. N. Zhou, A. Sinha, L. Carson and H. E. Naguib, Composites, Part B, 2018, 132, 61–68 CrossRef CAS.
- J. A. Puertolas, M. Castro, J. A. Morris, R. Rios and A. Anson-Casaos, Carbon, 2019, 141, 107–122 CrossRef CAS.
- B. Mayoral, E. Harkin-Jones, P. N. Khanam, M. A. AlMaadeed, M. Ouederni, A. R. Hamilton and D. Sun, RSC Adv., 2015, 5, 52395–52409 RSC.
- K. Hu, M. K. Gupta, D. D. Kulkarni and V. V. Tsukruk, Adv. Mater., 2013, 25, 2301–2307 CrossRef CAS PubMed.
- Y. Yang, C.-L. Luo, X.-D. Chen and M. Wang, Compos. Sci. Technol., 2023, 233, 109913 CrossRef CAS.
- S. J. Lee, J. Baek and I.-Y. Jeon, Polymer, 2024, 294, 126727 CrossRef CAS.
- M. Yan, X. Chen, Y. Xu, Y. Pan, J. Li, J. Li, T. Wu, H. Zheng, X. Chen and J. He, Compos. Commun., 2023, 37, 101428 CrossRef.
- C. Zhi, Y. Bando, C. Tang, H. Kuwahara and D. Golberg, Adv. Mater., 2009, 21, 2889–2893 CrossRef CAS.
- Q. H. Weng, X. B. Wang, X. Wang, Y. Bando and D. Golberg, Chem. Soc. Rev., 2016, 45, 3989–4012 RSC.
- D. Lee, S. H. Song, J. Hwang, S. H. Jin, K. H. Park, B. H. Kim, S. H. Hong and S. Jeon, Small, 2013, 9, 2602–2610 CrossRef CAS PubMed.
- H. C. Wu and M. R. Kessler, ACS Appl. Mater. Interfaces, 2015, 7, 5915–5926 CrossRef CAS PubMed.
- T. Sainsbury, A. Satti, P. May, Z. M. Wang, I. McGovern, Y. K. Gun'ko and J. Coleman, J. Am. Chem. Soc., 2012, 134, 18758–18771 CrossRef CAS PubMed.
- Z. Liu, J. H. Li and X. H. Liu, ACS Appl. Mater. Interfaces, 2020, 12, 6503–6515 CrossRef CAS PubMed.
- J. T. Hu, Y. Huang, X. L. Zeng, Q. Li, L. L. Ren, R. Sun, J. B. Xu and C. P. Wong, Compos. Sci. Technol., 2018, 160, 127–137 CrossRef CAS.
- Z. Y. Lin, Y. Liu, S. Raghavan, K. S. Moon, S. K. Sitaraman and C. P. Wong, ACS Appl. Mater. Interfaces, 2013, 5, 7633–7640 CrossRef CAS PubMed.
- M. Kiran, K. Raidongia, U. Ramamurty and C. N. R. Rao, Scr. Mater., 2011, 64, 592–595 CrossRef CAS.
- Z. Cui, A. P. Martinez and D. H. Adamson, Nanoscale, 2015, 7, 10193–10197 RSC.
- S. Han, Q. Meng, Z. Qiu, A. Osman, R. Cai, Y. Yu, T. Liu and S. Araby, Polymer, 2019, 184, 121884 CrossRef CAS.
- H. Wang, R. Lu, L. Li, C. Liang, J. Yan, R. Liang, G. Sun, L. Jiang and Q. Cheng, Nano Res., 2023, 1–9, DOI:10.1007/s12274-023-6101-4.
- U. Khan, P. May, A. O'Neill, A. P. Bell, E. Boussac, A. Martin, J. Semple and J. N. Coleman, Nanoscale, 2013, 5, 581–587 RSC.
- W. M. Wang, Z. L. Li, A. J. Marsden, M. A. Bissett and R. J. Young, Compos. Sci. Technol., 2022, 218, 8 Search PubMed.
- J. Zhang, X. N. Wang, C. P. Yu, Q. L. Li, Z. Li, C. W. Li, H. F. Lu, Q. C. Zhang, J. X. Zhao, M. Hu and Y. G. Yao, Compos. Sci. Technol., 2017, 149, 41–47 CrossRef CAS.
- W. Cai, D. C. Zhang, B. B. Wang, Y. Q. Shi, Y. Pan, J. L. Wang, W. Z. Hu and Y. Hu, Compos. Sci. Technol., 2018, 168, 74–80 CrossRef CAS.
- J. Yang, C. Cao, W. Qiao, J. Qiao, H. Gao, W. Bai, Z. Li, P. Wang, C. Tang and Y. Xue, ACS Appl. Nano Mater., 2022, 5, 15600–15610 CrossRef CAS.
- R. Jan, P. May, A. P. Bell, A. Habib, U. Khan and J. N. Coleman, Nanoscale, 2014, 6, 4889–4895 RSC.
- S. U. Rehman, S. Javaid, M. Shahid, N. M. Ahmad, B. Rashid, C. R. Szczepanski and A. Shahzad, Polymers, 2023, 15, 235 CrossRef CAS PubMed.
- A. Chaurasia, A. Verma, A. Parashar and R. S. Mulik, J. Phys. Chem. C, 2019, 123, 20059–20070 CrossRef CAS.
- N. Tajaddod, K. Song, E. C. Green, Y. Y. Zhang and M. L. Minus, Macromol. Mater. Eng., 2016, 301, 315–327 CrossRef CAS.
- J. Zhang, D. Liu, Q. Han, L. Jiang, H. Shao, B. Tang, W. Lei, T. Lin and C. H. Wang, Composites, Part B, 2019, 175, 107157 CrossRef CAS.
- D. L. Zhang, J. W. Zha, W. K. Li, C. Q. Li, S. J. Wang, Y. Q. Wen and Z. M. Dang, Compos. Sci. Technol., 2018, 156, 1–7 CrossRef CAS.
- Z. Xu, L. Bai, Y. Zhang, J. Cao and J. Zheng, Compos. Sci. Technol., 2023, 240, 110076 CrossRef CAS.
- Y. Zhang, Y. Fan, U. Kamran and S.-J. Park, Composites, Part A, 2022, 156, 106869 CrossRef CAS.
- J. You, H. H. Choi, Y. M. Lee, J. Cho, M. Park, S. S. Lee and J. H. Park, Composites, Part B, 2019, 164, 710–719 CrossRef CAS.
- Q. Xiao, W. Han, R. Yang, Y. You, R. Wei and X. Liu, Polym. Compos., 2018, 39, E1598–E1605 CAS.
- L.-H. Zhao, L. Wang, Y.-F. Jin, J.-W. Ren, Z. Wang and L.-C. Jia, Composites, Part B, 2022, 229, 109454 CrossRef CAS.
- S. Riaz and S. J. Park, Composites, Part A, 2021, 146, 11 CrossRef.
- X. M. Feng, W. Y. Xing, H. Y. Yang, B. H. Yuan, L. Song, Y. Hu and K. M. Liew, ACS Appl. Mater. Interfaces, 2015, 7, 13164–13173 CrossRef CAS PubMed.
- P. P. Chen, X. Liang, Y. Xu, Y. F. Zhou and W. Y. Nie, Appl. Surf. Sci., 2018, 440, 1143–1149 CrossRef CAS.
- X. Wang, E. N. Kalali and D. Y. Wang, J. Mater. Chem. A, 2015, 3, 24112–24120 RSC.
- S. K. Kim, J. J. Wie, Q. Mahmood and H. S. Park, Nanoscale, 2014, 6, 7430–7435 RSC.
- M. Sahu, L. Narashimhan, O. Prakash and A. M. Raichur, ACS Appl. Mater. Interfaces, 2017, 9, 14347–14357 CrossRef CAS PubMed.
- J. L. Wang, C. Ma, X. W. Mu, W. Cai, L. X. Liu, X. Zhou, W. Z. Hu and Y. Hu, J. Hazard. Mater., 2018, 352, 36–46 CrossRef CAS PubMed.
- M. Sahu, L. Narasimhan, A. M. Raichur, A. Sover, R. C. Ciobanu, N. Lucanu and M. J. P. Aradoaei, Polymers, 2021, 13, 4440 CrossRef CAS PubMed.
- S.-D. Jiang, G. Tang, Z.-M. Bai, Y.-Y. Wang, Y. Hu and L. Song, RSC Adv., 2014, 4, 3253–3262 RSC.
- A. O'Neill, U. Khan and J. N. Coleman, Chem. Mater., 2012, 24, 2414–2421 CrossRef.
- S. Biccai, C. S. Boland, D. P. O'Driscoll, A. Harvey, C. Gabbett, D. R. O'Suilleabhain, A. J. Griffin, Z. Li, R. J. Young and J. N. Coleman, ACS Nano, 2019, 13, 6845–6855 CrossRef CAS PubMed.
- H. X. Zhang, E. B. Ko, J. H. Park, Y. K. Moon, X. Q. Zhang and K. B. Yoon, Composites, Part A, 2017, 93, 82–87 CrossRef CAS.
- H. Zhang, Y. K. Moon, X. Q. Zhang, J. S. Liu, H. X. Zhang and K. B. Yoon, Eur. Polym. J., 2017, 87, 60–68 CrossRef CAS.
- H. Zhang, Y. K. Moon, X. Q. Zhang, H. X. Zhang and K. B. Yoon, RSC Adv., 2016, 6, 112429–112434 RSC.
- C. L. C. Rodriguez, M. A. B. S. Nunes, P. S. Garcia and G. J. M. Fechine, Polym. Test., 2021, 93, 106882 CrossRef CAS.
- H. Yuan, X. H. Liu, L. M. Ma, Z. G. Yang, H. G. Wang, J. Q. Wang and S. R. Yang, Composites, Part A, 2017, 95, 220–228 CrossRef CAS.
- H. X. Zhang, X. Q. Zhang and K. B. Yoon, Polymers, 2017, 9, 490 CrossRef PubMed.
- X. Wang, W. Y. Xing, X. M. Feng, B. Yu, L. Song, G. H. Yeoh and Y. Hu, Compos. Sci. Technol., 2016, 127, 142–148 CrossRef CAS.
- X. M. Feng, X. Wang, W. Y. Xing, K. Q. Zhou, L. Song and Y. Hu, Compos. Sci. Technol., 2014, 93, 76–82 CrossRef CAS.
- L. Jiang, H. Xie, Y. Hou, S. Wang, Y. Xia, Y. Li, G.-H. Hu, Q. Yang, C. Xiong and Z. Gao, Ceram. Int., 2019, 45, 11347–11352 CrossRef CAS.
- T. Wu, Y. Song, Z. Shi, D. Liu, S. Chen, C. Xiong and Q. Yang, Nano Energy, 2021, 80, 105541 CrossRef CAS.
- L. Liu, G. Ying, D. Wen, K. Zhang, C. Hu, Y. Zheng, C. Zhang, X. Wang and C. Wang, Mater. Des., 2021, 197, 109276 CrossRef CAS.
- Z. Ling, C. E. Ren, M. Q. Zhao, J. Yang, J. M. Giammarco, J. S. Qiu, M. W. Barsoum and Y. Gogotsi, Proc. Natl. Acad. Sci. U. S. A., 2014, 111, 16676–16681 CrossRef CAS PubMed.
- Z. Liu, W. Wang, J. Tan, J. Liu, M. Zhu, B. Zhu and Q. Zhang, J. Mater. Chem. C, 2020, 8, 7170–7180 RSC.
- Z. Liu, W. Wang, J. Liu, B. Zhu, G. Zhang, J. Wang, H. Zhang and Q. Zhang, Chem. Eng. J., 2022, 430, 132852 CrossRef CAS.
- W. T. Cao, F. F. Chen, Y. J. Zhu, Y. G. Zhang, Y. Y. Jiang, M. G. Ma and F. Chen, ACS Nano, 2018, 12, 4583–4593 CrossRef CAS PubMed.
- W. Q. Tian, A. VahidMohammadi, M. S. Reid, Z. Wang, L. Q. Ouyang, J. Erlandsson, T. Pettersson, L. Wagberg, M. Beidaghi and M. M. Hamedi, Adv. Mater., 2019, 31, 1902977 CrossRef PubMed.
- F. Xie, F. Jia, L. Zhuo, Z. Lu, L. Si, J. Huang, M. Zhang and Q. Ma, Nanoscale, 2019, 11, 23382–23391 RSC.
- C. Weng, T. Xing, H. Jin, G. Wang, Z. Dai, Y. Pei, L. Liu and Z. Zhang, Composites, Part A, 2020, 135, 105927 CrossRef CAS.
- L. Wang, L. X. Chen, P. Song, C. B. Liang, Y. J. Lu, H. Qiu, Y. L. Zhang, J. Kong and J. W. Gu, Composites, Part B, 2019, 171, 111–118 CrossRef CAS.
- R. Wazalwar, M. Tripathi and A. M. Raichur, ACS Appl. Polym. Mater., 2022, 4, 2573–2584 CrossRef CAS.
- H. Wang, R. Lu, J. Yan, J. Peng, A. P. Tomsia, R. Liang, G. Sun, M. Liu, L. Jiang and Q. Cheng, Angew. Chem., Int. Ed., 2023, 62, e202216874 CrossRef CAS PubMed.
- K. Wang, L. Shen, Q. Zhu, R. Bo, R. Lu, X. Lu and Z. Fu, Chem. Eng. J., 2023, 452, 139156 CrossRef CAS.
- Z. Chi, C. Wang, Y. Dong, Y. Zhou, H. Xu, Z. Islam, C. Qian and Y. Fu, Compos. Sci. Technol., 2022, 225, 109505 CrossRef CAS.
- X. Zhang, J. Xu, H. Wang, J. Zhang, H. Yan, B. Pan, J. Zhou and Y. Xie, Angew. Chem., Int. Ed., 2013, 52, 4361–4365 CrossRef CAS PubMed.
- Y. Yi, S. Feng, Z. Zhou and C. Lu, Composites, Part A, 2022, 163, 107232 CrossRef CAS.
- J. H. Woo, N. H. Kim, S. I. Kim, O.-K. Park and J. H. Lee, Composites, Part B, 2020, 199, 108205 CrossRef CAS.
- S. Mazhar, A. A. Qarni, Y. Ul Haq, Z. Ul Haq and I. Murtaza, Ceram. Int., 2020, 46, 12593–12605 CrossRef CAS.
- Y. Zhang, L. Wang, J. Zhang, P. Song, Z. Xiao, C. Liang, H. Qiu, J. Kong and J. Gu, Compos. Sci. Technol., 2019, 183, 107833 CrossRef CAS.
- Z. Zhan, Q. Song, Z. Zhou and C. Lu, J. Mater. Chem. C, 2019, 7, 9820–9829 RSC.
- Y. Xue, J. Feng, S. Huo, P. Song, B. Yu, L. Liu and H. Wang, Chem. Eng. J., 2020, 397, 125336 CrossRef CAS.
- Y. Q. Shi, C. Liu, L. Liu, L. B. Fu, B. Yu, Y. C. Lv, F. Q. Yang and P. A. Song, Chem. Eng. J., 2019, 378, 122267 CrossRef.
- W. Q. Zhi, S. L. Xiang, R. J. Bian, R. Z. Lin, K. H. Wu, T. W. Wang and D. Y. Cai, Compos. Sci. Technol., 2018, 168, 404–411 CrossRef CAS.
- J. Q. Luo, S. Zhao, H. B. Zhang, Z. M. Deng, L. L. Li and Z. Z. Yu, Compos. Sci. Technol., 2019, 182, 107754 CrossRef CAS.
- Y. Liu, J. Zhang, X. Zhang, Y. Li and J. Wang, ACS Appl. Mater. Interfaces, 2016, 8, 20352–20363 CrossRef CAS PubMed.
- G. Tiouitchi, M. Raji, O. Mounkachi, M. A. Ali, A. Mahmoud, F. Boschini, H. Essabir, R. Bouhfid and A. Qaiss, Composites, Part B, 2019, 175, 107165 CrossRef CAS.
- H. Ni, X. C. Liu and Q. F. Cheng, J. Mater. Chem. A, 2018, 6, 7142–7147 RSC.
- S. L. Qiu, B. Zou, H. B. Sheng, W. W. Guo, J. L. Wang, Y. Y. Zhao, W. Wang, R. K. K. Yuen, Y. C. Kan and Y. Hu, ACS Appl. Mater. Interfaces, 2019, 11, 13652–13664 CrossRef CAS PubMed.
- S. L. Qiu, Y. F. Zhou, X. Zhou, T. Zhang, C. Y. Wang, R. K. K. Yuen, W. Z. Hu and Y. Hu, Small, 2019, 15, 33–57 Search PubMed.
- B. Zou, S. Qiu, X. Ren, Y. Zhou, F. Zhou, Z. Xu, Z. Zhao, L. Song, Y. Hu and X. Gong, J. Hazard. Mater., 2020, 383, 121069 CrossRef CAS PubMed.
- W. Yang, J. Liang, S. Qiu, Y. Zhou, B. Zou, J. Wang, L. Song and Y. Hu, Composites, Part A, 2022, 163, 107255 CrossRef CAS.
- W. Yang, S. Qiu, Y. Zhou, J. Wang, B. Zou and L. Song, Chemosphere, 2022, 303, 135012 CrossRef CAS PubMed.
- S. Qiu, W. Yang, X. Wang and Y. Hu, Chem. Eng. J., 2023, 453, 139759 CrossRef CAS.
- J. Guo, L. Yang, L. Zhang and C. Li, Polymer, 2022, 255, 125036 CrossRef CAS.
- W. Cai, T. M. Cai, L. X. He, F. K. Chu, X. W. Mu, L. F. Han, Y. Hu, B. B. Wang and W. Z. Hu, J. Hazard. Mater., 2020, 387, 121971 CrossRef CAS PubMed.
- W. Cai, Y. X. Hu, Y. Pan, X. Zhou, F. K. Chu, L. F. Han, X. W. Mu, Z. Y. Zhuang, X. Wang and W. Y. Xing, J. Colloid Interface Sci., 2020, 561, 32–45 CrossRef CAS PubMed.
- S. Qiu, X. Ren, X. Zhou, T. Zhang, L. Song and Y. Hu, ACS Appl. Mater. Interfaces, 2020, 12, 36639–36651 CrossRef CAS PubMed.
- Y. Zhou, J. Huang, J. Wang, F. Chu, Z. Xu, W. Hu and Y. Hu, Polym. Degrad. Stab., 2020, 178, 109194 CrossRef CAS.
- X. W. Mu, J. Zhan, X. M. Feng, B. H. Yuan, S. L. Qiu, L. Song and Y. Hu, ACS Appl. Mater. Interfaces, 2017, 9, 23017–23026 CrossRef CAS PubMed.
- X. W. Mu, J. Zhan, X. M. Feng, W. Cai, L. Song and Y. Hu, Composites, Part A, 2018, 110, 162–171 CrossRef CAS.
- X. W. Mu, J. Zhan, J. L. Wang, W. Cai, B. H. Yuan, L. Song and Y. Hu, J. Colloid Interface Sci., 2019, 539, 609–618 CrossRef CAS PubMed.
- P. García-Arroyo, M. P. Arrieta, D. Garcia-Garcia, R. Cuervo-Rodríguez, V. Fombuena, M. J. Mancheño and J. L. Segura, Polymer, 2020, 196, 122466 CrossRef.
- Z. F. Wang, Q. Yu, Y. B. Huang, H. D. An, Y. Zhao, Y. F. Feng, X. Li, X. L. Shi, J. J. Liang, F. S. Pan, P. Cheng, Y. Chen, S. Q. Ma and Z. J. Zhang, ACS Cent. Sci., 2019, 5, 1352–1359 CrossRef CAS PubMed.
- Y. W. Yang, J. Zan, W. J. Yang, F. W. Qi, C. X. He, S. H. Huang, S. P. Peng and C. J. Shuai, Mater. Chem. Front., 2020, 4, 973–984 RSC.
- S. Ma, Y. Hou, Y. Xiao, F. Chu, T. Cai, W. Hu and Y. Hu, Mater. Chem. Phys., 2020, 247, 122875 CrossRef CAS.
- X. G. Wang, S. H. Wang, W. J. Wang, H. F. Li, X. D. Liu, X. Y. Gu, S. Bourbigot, Z. W. Wang, J. Sun and S. Zhang, Composites, Part B, 2020, 183, 107568 CrossRef CAS.
- M. Afshari and M. Dinari, Composites, Part A, 2021, 147, 106453 CrossRef CAS.
- A. R. Ghohrodi, M. Ramezanzadeh and B. Ramezanzadeh, Prog. Org. Coat., 2022, 164, 106693 CrossRef CAS.
- Y. Li, J. Yin, Y. Feng, J. Li, H. Zhao, C. Zhu, D. Yue, Y. Liu, B. Su and X. Liu, Chem. Eng. J., 2022, 429, 132228 CrossRef CAS.
- Y. J. Ren, Y. F. Zhang, H. M. Fang, T. P. Ding, J. L. Li and S. L. Bai, Composites, Part A, 2018, 112, 57–63 CrossRef CAS.
- X. L. Cui, P. Ding, N. Zhuang, L. Y. Shi, N. Song and S. F. Tang, ACS Appl. Mater. Interfaces, 2015, 7, 19068–19075 CrossRef CAS PubMed.
- J. Zhang, W. W. Lei, D. Liu and X. G. Wang, Compos. Sci. Technol., 2017, 151, 252–257 CrossRef CAS.
- J. C. Li, X. Y. Zhao, W. J. Wu, Z. X. Zhang, Y. Xian, Y. T. Lin, Y. L. Lu and L. Q. Zhang, Carbon, 2020, 162, 46–55 CrossRef CAS.
- H. Ribeiro, J. P. C. Trigueiro, C. F. Woellner, J. J. Pedrotti, D. R. Miquita, W. M. Silva, M. C. Lopes, G. J. M. Fechine, M. A. Luciano, G. G. Silva and P. M. Ajayan, Polym. Test., 2020, 87, 106510 CrossRef CAS.
- Q. S. Song, W. Zhu, Y. Deng, D. L. He and J. J. Feng, Compos. Sci. Technol., 2018, 168, 381–387 CrossRef CAS.
- X. Y. Li, P. Bandyopadhyay, T. Kshetri, N. H. Kim and J. H. Lee, J. Mater. Chem. A, 2018, 6, 21501–21515 RSC.
- S. J. Wan, Y. C. Li, J. S. Peng, H. Hu, Q. F. Cheng and L. Jiang, ACS Nano, 2015, 9, 708–714 CrossRef CAS PubMed.
- Y. C. Guo, Y. Xue, X. H. Zuo, L. X. Zhang, Z. H. Yang, Y. C. Zhou, C. Marmorat, S. He and M. Rafailovich, Polym. Degrad. Stab., 2017, 144, 155–166 CrossRef CAS.
- Z. J. Liu, C. G. Yin, V. Cecen, J. C. Fan, P. H. Shi, Q. J. Xu and Y. L. Min, Polymer, 2019, 179, 121613 CrossRef CAS.
- Y. L. Xiao, Z. Y. Jin, L. X. He, S. C. Ma, C. Y. Wang, X. W. Mu and L. Song, Composites, Part B, 2020, 182, 107616 CrossRef CAS.
- T. Krasian, W. Punyodom and P. Worajittiphon, Chem. Eng. J., 2019, 369, 563–575 CrossRef CAS.
- Y. Hou, Y. Hu, S. Qiu, L. Liu, W. Xing and W. Hu, J. Hazard. Mater., 2019, 364, 720–732 CrossRef CAS PubMed.
- T. Zhou, C. Wu, Y. Wang, A. P. Tomsia, M. Li, E. Saiz, S. Fang, R. H. Baughman, L. Jiang and Q. Cheng, Nat. Commun., 2020, 11, 2077 CrossRef CAS PubMed.
- T. Zhou, H. Ni, Y. Wang, C. Wu, H. Zhang, J. Zhang, A. P. Tomsia, L. Jiang and Q. Cheng, PNAS, 2020, 117, 8727–8735 CrossRef CAS PubMed.
- P. Yang, S. Ghosh, T. Xia, J. Wang, M. A. Bissett, I. A. Kinloch and S. Barg, Compos. Sci. Technol., 2022, 218, 109199 CrossRef CAS.
- S. Saha, W. Son, N. H. Kim and J. H. Lee, J. Mater. Chem. A, 2022, 10, 4376–4391 RSC.
- O. B. Seo, S. Saha, N. H. Kim and J. H. Lee, J. Membr. Sci., 2021, 640, 119839 CrossRef CAS.
- J. Yan, C. Wu, J. Hou, X. Zhang, Y. Liu, Y. Zhang, P. Li, H. Che, Z. Xing and Y. Wang, Tribol. Int., 2023, 189, 109000 CrossRef CAS.
- W. Yang, S. Qiu, Y. Zhou, B. Zou, J. Wang, P. Jia and L. Song, ACS Appl. Nano Mater., 2022, 5, 14841–14849 CrossRef CAS.
- A. Farshidfar, S. Bazgir, A. A. Katbab and A. Vaziri, Polym. Test., 2023, 120, 107951 CrossRef CAS.
- H. Ribeiro, J. P. C. Trigueiro, M. C. Lopes, J. J. Pedrotti, C. F. Woellner, W. M. Silva, G. G. Silva and P. M. Ajayan, J. Appl. Polym. Sci., 2018, 135, 46560 CrossRef.
- B. Peng, M. Locascio, P. Zapol, S. Y. Li, S. L. Mielke, G. C. Schatz and H. D. Espinosa, Nat. Nanotechnol., 2008, 3, 626–631 CrossRef CAS PubMed.
- W. K. Li, A. Dichiara and J. B. Bai, Compos. Sci. Technol., 2013, 74, 221–227 CrossRef CAS.
- P.-G. Ren, Y.-Y. Di, Q. Zhang, L. Li, H. Pang and Z.-M. Li, Macromol. Mater. Eng., 2012, 297, 437–443 CrossRef CAS.
- T. K. Gupta, M. Choosri, K. M. Varadarajan and S. Kumar, J. Mater. Sci., 2018, 53, 7939–7952 CrossRef CAS.
- H. Xu, X. Li, P. Li, L. Ma, H. Li, L. Shi, M. Wang, H. Chen and G. Song, Compos. Sci. Technol., 2020, 195, 108191 CrossRef CAS.
- H. Ulus, T. Ustun, V. Eskizeybek, O. S. Sahin, A. Avci and M. Ekrem, Appl. Surf. Sci., 2014, 318, 37–42 CrossRef CAS.
- J. Y. Yuan, Z. Z. Zhang, M. M. Yang, L. F. Wu, P. L. Li, F. Guo, X. H. Men and W. M. Liu, Composites, Part A, 2019, 123, 132–140 CrossRef CAS.
- Y. Li, X. Tian, W. Yang, Q. Li, L. Hou, Z. Zhu, Y. Tang, M. Wang, B. Zhang, T. Pan and Y. Li, Chem. Eng. J., 2019, 358, 718–724 CrossRef CAS.
- N. Domun, K. R. Paton, H. Hadavinia, T. Sainsbury, T. Zhang and H. Mohamud, Materials, 2017, 10, 1179 CrossRef PubMed.
- O. K. Park, P. S. Owuor, Y. M. Jaques, D. S. Galvao, N. H. Kim, J. H. Lee, C. S. Tiwary and P. M. Ajayan, Compos. Sci. Technol., 2020, 188, 107977 CrossRef CAS.
- N. D. Badgayan, S. K. Sahu, S. Samanta and P. S. R. Sreekanth, J. Mech. Behav. Biomed. Mater., 2018, 80, 180–188 CrossRef CAS PubMed.
- K. Zhou, J. Liu, Y. Shi, S. Jiang, D. Wang, Y. Hu and Z. Gui, ACS Appl. Mater. Interfaces, 2015, 7, 6070–6081 CrossRef CAS PubMed.
- C. Ji, C. Z. Yan, Y. Wang, S. X. Xiong, F. R. Zhou, Y. Y. Li, R. Sun and C. P. Wong, Composites, Part B, 2019, 163, 363–370 CrossRef CAS.
- D. Wang, X. W. Mu, W. Cai, X. Zhou, L. Song, C. Ma and Y. Hu, Composites, Part A, 2019, 121, 36–44 CrossRef CAS.
- Z. H. Zhou, W. Panatdasirisuk, T. S. Mathis, B. Anasori, C. H. Lu, X. X. Zhang, Z. W. Liao, Y. Gogotsi and S. Yang, Nanoscale, 2018, 10, 6005–6013 RSC.
- M. Aakyiir, J. A. Oh, S. Araby, Q. H. Zheng, M. Naeem, J. Ma, P. Adu, L. Q. Zhang and Y. W. Mai, Compos. Sci. Technol., 2021, 214, 9 CrossRef.
- P. Jia, J. Lu, R. He, G. Jiang, X. Jiang, B. Wang, L. Song and Y. Hu, Chem. Eng. J., 2022, 450, 138184 CrossRef CAS.
- C. Zhao, P. Zhang, J. Zhou, S. Qi, Y. Yamauchi, R. Shi, R. Fang, Y. Ishida, S. Wang, A. P. Tomsia, M. Liu and L. Jiang, Nature, 2020, 580, 210–215 CrossRef CAS PubMed.
- S. A. Jiang, Q. F. Li, J. W. Wang, Z. L. He, Y. H. Zhao and M. Q. Kang, Composites, Part A, 2016, 87, 1–9 CrossRef CAS.
- D. G. Papageorgiou, M. F. Liu, Z. L. Li, C. Valles, R. J. Young and I. A. Kinloch, Compos. Sci. Technol., 2019, 175, 60–68 CrossRef CAS.
- A. K. Pathak, M. Borah, A. Gupta, T. Yolcozeki and S. R. Dhakate, Compos. Sci. Technol., 2016, 135, 28–38 CrossRef CAS.
- X. Q. Zhang, X. Y. Fan, C. Yan, H. Z. Li, Y. D. Zhu, X. T. Li and L. P. Yu, ACS Appl. Mater. Interfaces, 2012, 4, 1543–1552 CrossRef CAS PubMed.
- Z. Xu, G. Lin and G. Sui, J. Appl. Polym. Sci., 2020, 137, 49212 CrossRef CAS.
- Y. Wu, Y. He, C. Chen, H. Li, Y. Xia and T. Zhou, Prog. Org. Coat., 2019, 129, 178–186 CrossRef CAS.
- D. G. Papageorgiou, I. A. Kinloch and R. J. Young, Compos. Sci. Technol., 2016, 137, 44–51 CrossRef CAS.
- R. G. Wang, Z. Li, W. B. Liu, W. C. Jiao, L. F. Hao and F. Yang, Compos. Sci. Technol., 2013, 87, 29–35 CrossRef CAS.
- N. N. Hong, J. Zhan, X. Wang, A. A. Stec, T. R. Hull, H. Ge, W. Y. Xing, L. Song and Y. Hu, Composites, Part A, 2014, 64, 203–210 CrossRef CAS.
- H. Qu, Y. Wang, Y. S. Ye, W. Zhou, S. P. Bai, X. P. Zhou, H. Y. Peng, X. L. Xie and Y. W. Mai, J. Mater. Chem. A, 2017, 5, 22361–22371 RSC.
- Y. M. Yao, X. L. Zeng, R. Sun, J. B. Xu and C. P. Wong, ACS Appl. Mater. Interfaces, 2016, 8, 15645–15653 CrossRef CAS PubMed.
- C.-G. Yin, Z.-J. Liu, R. Mo, J.-C. Fan, P.-H. Shi, Q.-J. Xu and Y.-L. Min, Polymer, 2020, 195, 122455 CrossRef CAS.
- S. Montes, P. M. Carrasco, V. Ruiz, G. Cabanero, H. J. Grande, J. Labidi and I. Odriozola, Compos. Sci. Technol., 2015, 117, 26–31 CrossRef CAS.
- N. El Miri, M. El Achaby, A. Fihri, M. Larzek, M. Zahouily, K. Abdelouahdi, A. Barakat and A. Solhy, Carbohydr. Polym., 2016, 137, 239–248 CrossRef CAS PubMed.
- J. L. Duan, S. S. Gong, Y. Gao, X. L. Xie, L. Jiang and Q. F. Cheng, ACS Appl. Mater. Interfaces, 2016, 8, 10545–10550 CrossRef CAS PubMed.
- J. Zhang, W. W. Lei, J. Y. Chen, D. Liu, B. Tang, J. L. Li and X. A. Wang, Polymer, 2018, 148, 101–108 CrossRef CAS.
- S. Chatterjee, F. Nafezarefi, N. H. Tai, L. Schlagenhauf, F. A. Nuesch and B. T. T. Chu, Carbon, 2012, 50, 5380–5386 CrossRef CAS.
- Y. Q. Li, T. Y. Yang, T. Yu, L. X. Zheng and K. Liao, J. Mater. Chem., 2011, 21, 10844–10851 RSC.
- S. Y. Yang, W. N. Lin, Y. L. Huang, H. W. Tien, J. Y. Wang, C. C. M. Ma, S. M. Li and Y. S. Wang, Carbon, 2011, 49, 793–803 CrossRef CAS.
- A. Rostami and M. I. Moosavi, J. Appl. Polym. Sci., 2020, 137, 11 CrossRef.
- K. H. Nam, J. Yu, N. H. You, H. Han and B. C. Ku, Compos. Sci. Technol., 2017, 149, 228–234 CrossRef CAS.
- J. Wang, X. Jin, H. Wu and S. Guo, Carbon, 2017, 123, 502–513 CrossRef CAS.
- R. Scaffaro and A. Maio, Composites, Part B, 2019, 168, 550–559 CrossRef CAS.
- R. Mo, L. Zhu, X. Wu, W. Guo, Y. Min and J. Fan, Polym. Compos., 2022, 43, 2638–2650 CrossRef CAS.
- D. Lou, H. Chen, J. Liu, D. Wang, C. Wang, B. K. Jasthi, Z. Zhu, H. Younes and H. Hong, ACS Appl. Nano Mater., 2023, 6, 12515–12525 CrossRef CAS.
- M. Dong, Y. Hu, X. Yu, M. Liu, E. Bilotti, H. Zhang and D. G. Papageorgiou, ACS Appl. Polym. Mater., 2024, 6, 207–217 CrossRef CAS.
- L. Liu, G. Ying, Y. Zhao, Y. Li, Y. Wu, D. Wen, M. Wu, M. Wang, Q. Zhou, X. Wang and C. Wang, Polymers, 2021, 13, 1820 CrossRef CAS PubMed.
- L. Liu, G. Ying, C. Sun, H. Min, J. Zhang, Y. Zhao, D. Wen, Z. Ji, X. Liu, C. Zhang and C. Wang, Polymers, 2021, 13, 1825 CrossRef CAS PubMed.
- B. Tang, Y. Yang, Y. Shi, H. Nie, H. Xia and X. Shen, Polym. Compos., 2021, 42, 2010–2018 CrossRef CAS.
- T. Jiang, T. Kuila, N. H. Kim, B. C. Ku and J. H. Lee, Compos. Sci. Technol., 2013, 79, 115–125 CrossRef CAS.
- L. Chen, S. G. Chai, K. Liu, N. Y. Ning, J. Gao, Q. F. Liu, F. Chen and Q. Fu, ACS Appl. Mater. Interfaces, 2012, 4, 4398–4404 CrossRef CAS PubMed.
- Q. Y. Yang, Z. Xu, B. Fang, T. Q. Huang, S. Y. Cai, H. Chen, Y. J. Liu, K. Gopalsamy, W. W. Gao and C. Gao, J. Mater. Chem. A, 2017, 5, 22113–22119 RSC.
- M. Wang, L. Ma, L. Shi, P. Feng, X. Wang, Y. Zhu, G. Wu and G. Song, Compos. Sci. Technol., 2019, 182, 107751 CrossRef CAS.
- C. M. Damian, M. I. Necolau, I. Neblea, E. Vasile and H. Iovu, Appl. Surf. Sci., 2020, 507, 145046 CrossRef CAS.
- J. Zhang, C. Li, C. Yu, X. Wang, Q. Li, H. Lu, Q. Zhang, J. Zhao, E. Songfeng, M. Hu and Y. Yao, Compos. Sci. Technol., 2019, 169, 167–175 CrossRef CAS.
- Y. Xia, Y. He, C. Chen, Y. Wu and J. Chen, Prog. Org. Coat., 2019, 132, 316–327 CrossRef CAS.
- H. Peng, D. Wang, M. Li, L. Zhang, M. Liu and S. Fu, Composites, Part B, 2019, 174, 107037 CrossRef.
- X. Zhang, J. Zheng, H. Fang, Y. Zhang, S. Bai and G. He, Compos. Sci. Technol., 2018, 167, 42–52 CrossRef CAS.
- J. Li, X. Zhao, Z. Zhang, Y. Xian, Y. Lin, X. Ji, Y. Lu and L. Zhang, Compos. Sci. Technol., 2020, 186, 107930 CrossRef CAS.
- G. Y. Duan, Y. T. Cao, J. Y. Quan, Z. M. Hu, Y. Wang, J. R. Yu and J. Zhu, J. Mater. Sci., 2020, 55, 8170–8184 CrossRef CAS.
- L. J. Fang, C. Wu, R. Qian, L. Y. Xie, K. Yang and P. K. Jiang, RSC Adv., 2014, 4, 21010–21017 RSC.
- C. Chen, Y. Xue, Z. Li, Y. F. Wen, X. W. Li, F. Wu, X. J. Li, D. Shi, Z. G. Xue and X. L. Xie, Chem. Eng. J., 2019, 369, 1150–1160 CrossRef CAS.
- X. Q. Fan, Y. Ding, Y. Liu, J. J. Liang and Y. S. Chen, ACS Nano, 2019, 13, 8124–8134 CrossRef CAS PubMed.
- Y. Ul-Haq, I. Murtaza, S. Mazhar, R. Ullah, M. Iqbal, H. Zeeshan ul, A. A. Qarni and S. Amin, Ceram. Int., 2020, 46, 5828–5840 CrossRef CAS.
- Y. H. Zhao, Y. F. Zhang, Z. K. Wu and S. L. Bai, Composites, Part B, 2016, 84, 52–58 CrossRef CAS.
- Y. Jiang, J. Wang, J. Wu and Y. Zhang, Polym. Bull., 2021, 78, 1213–1230 CrossRef CAS.
- Z. H. Tang, C. F. Zhang, Q. Y. Wei, P. J. Weng and B. C. Guo, Compos. Sci. Technol., 2016, 132, 93–100 CrossRef CAS.
- Y. H. Zhang, K. Y. Rhee and S. J. Park, Composites, Part B, 2017, 114, 111–120 CrossRef CAS.
- Y. Zhang, J. R. Choi and S. J. Park, Composites, Part A, 2017, 101, 227–236 CrossRef CAS.
- P. Feng, Y. Kong, L. Yu, Y. Li, C. D. Gao, S. P. Peng, H. Pan, Z. Y. Zhao and C. J. Shuai, Appl. Mater. Today, 2019, 17, 216–226 CrossRef.
- X. Wang, S. L. Ji, X. Q. Wang, H. Y. Bian, L. R. Lin, H. Q. Dai and H. N. Xiao, J. Mater. Chem. C, 2019, 7, 14159–14169 RSC.
- Q. R. Zhang, Z. W. Li, X. H. Li, L. G. Yu, Z. J. Zhang and Z. S. Wu, Chem. Eng. J., 2019, 356, 680–692 CrossRef CAS.
- X. Zhou, S. L. Qiu, W. Y. Xing, C. S. R. Gangireddy, Z. Gui and Y. Hu, ACS Appl. Mater. Interfaces, 2017, 9, 29147–29156 CrossRef CAS PubMed.
- S. L. Qiu, Y. X. Hu, Y. Q. Shi, Y. B. Hou, Y. C. Kan, F. K. Chu, H. Sheng, R. K. K. Yuen and W. Y. Xing, Composites, Part A, 2018, 114, 407–417 CrossRef CAS.
- D. Guo, G. X. Xie and J. B. Luo, J. Phys. D: Appl. Phys., 2014, 47, 25 Search PubMed.
- D. Li, E. Peng, F. Lu, B. Wang, Y. Shen, P. Liu, L. Liu, Y. Huang and Z. Hu, Chem. Eng. J., 2023, 455, 140887 CrossRef CAS.
- J. Lu, B. Wang, P. Jia, W. Cheng, C. Liao, Z. Xu, L. Cheng and Y. Hu, Chem. Eng. J., 2022, 427, 132046 CrossRef CAS.
| This journal is © The Royal Society of Chemistry 2024 |


