Tailoring sensitization properties and improving near-infrared photon upconversion performance through alloying in superatomic molecular Au25 nanoclusters†
Masaaki
Mitsui
 *,
Yuki
Miyoshi
and
Daichi
Arima
Department of Chemistry, College of Science, Rikkyo University, 3-34-1, Nishiikebukuro, Toshima-ku, Tokyo 171-8501, Japan. E-mail: mitsui@rikkyo.ac.jp
First published on 2nd July 2024
Abstract
Noble-metal nanoclusters (NCs) protected by organic ligands have recently come to the forefront as potent triplet sensitizers for photon upconversion (UC) via triplet–triplet annihilation (TTA), owing to their capacity for atomic-level photophysical property customization. Among these, the rod-shaped bi-icosahedral [Au25(PPh3)10(S-C2H4Ph)5Cl2]2+ (Au-rod) NC is a particularly iconic superatomic molecular NC, recently identified as a near-infrared (NIR)-absorbing sensitizer for TTA-UC. In this study, we synthesized Cu-doped NCs, [Au25−xCux(PPh3)10(S-C2H4Ph)5Cl2]2+ (AuCu-rod), and paired them with 9,10-bis(phenylethynyl)anthracene (BPEA) annihilator/emitter to explore the impact of Cu-doping on the triplet sensitization and NIR-UC performance. The triplet state of AuCu-rod, with lifetime of 3 μs, exhibited a modest blue shift compared to the Au-rod, resulting in the increment in the driving force for triplet energy transfer (TET) to the BPEA acceptor. The TET rate constant was determined to be 5.0 × 10⁷ M−1 s−1, which is an order of magnitude higher than the rate constant for the Au-rod/BPEA pair. This improvement has led to a remarkable increase in the TET efficiency. Notably, the AuCu-rod/BPEA pair facilitated the efficient UC of 805 nm NIR light into 510 nm visible light, realizing a large anti-Stokes shift close to 0.9 eV. The UC internal quantum yield of this combination was determined to be 2.33 ± 0.05%, marking a fivefold enhancement over the Au-rod sensitizer (0.49%). Thus, alloying NC sensitizers offers a promising route to enhance UC performance by tuning the triplet state energy and optimizing the compatibility between the sensitizer and annihilator. Additionally, in this series of experiments, the formation of small amounts of BPEA microaggregates was observed. These aggregates did not undergo singlet fission and could retain multiple long-lived triplet excitons. This characteristic facilitated TTA among triplet excitons, resulting in efficient NIR-to-visible UC emission.
Introduction
Sunlight stands as a clean and sustainable energy source available for human use, with growing expectations for its further effective utilization. Despite encompassing a broad range of wavelengths of light (photon energies) from ultraviolet to infrared, the majority of current solar-driven devices are mainly limited to harnessing light in the ultraviolet and visible regions. Therefore, it is crucial to tap into the range of wavelengths that have remained underutilized thus far. For instance, enhancing the efficiency of utilizing light in the near-infrared (NIR) region is a significant challenge in applications such as photocatalytic hydrogen production1 and various types of solar cells.2,3Photon upconversion (UC), a method that converts low-energy photons into higher-energy photons, stands out as a promising technique for light-energy conversion. Particularly, triplet–triplet annihilation (TTA)-based upconversion (TTA-UC) is of significant interest as a mechanism that holds promise in addressing the challenge mentioned, because it operates effectively even under standard solar irradiance.4–8 TTA-UC usually consists of an appropriate combination of a sensitizer and an annihilator (emitter). As illustrated in Scheme 1, in the TTA-UC mechanism, the photoexcited sensitizer in the S1 state undergoes intersystem crossing (ISC) to produce the triplet (T1) state. Subsequently, triplet energy transfer (TET) from this triplet sensitizer to a ground-state annihilator occurs. Two of the triplet annihilators thus generated undergo TTA, one transitions to the S1 state, emitting upconverted fluorescence. Therefore, TTA-UC is a two-photon process, and the maximum UC quantum yield is 50%. Importantly, UC quantum yields that remain uncorrected for reabsorption effects pose obstacles when comparing various sensitizer–annihilator pairs due to their significant dependence on sample concentration and the optical path length of the solution. Hence, to ensure consistency in evaluating UC performance, this paper employs the internal UC quantum yield (ΦUCg), defined as the ratio of upconverted photons generated (#hνgen) to photons absorbed by the sensitizer (#hνabs).9 The formula for ΦUCg is expressed as follows:
 | (1) |
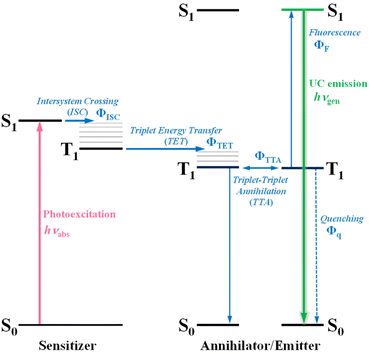 | ||
| Scheme 1 A Jablonski diagram illustrating the photophysical processes associated with photon upconversion (UC) via triplet–triplet annihilation (TTA), utilizing a sensitizer–annihilator/emitter pair. | ||
Numerous sensitizer–annihilator pairs with ΦUCg exceeding several tens of percent have been reported for visible-to-visible UC in degassed solutions. However, the UC quantum yield from NIR (>700 nm) to visible light remains less than 10%, even at the current highest value,10 and in most reported systems, a few percent or less.11 Organometallic complexes with extended π-conjugated frameworks and semiconductor nanocrystals modified with triplet-mediator ligands have been reported as sensitizers for NIR-UC. However, the former generally involves a cumbersome multi-step synthesis,12–14 while the latter, although easy to synthesize, is restricted to compositions containing highly toxic Pb and Se atoms.15–18 The choice of sensitizers with strong NIR light absorption and high ΦISC is indeed considerably limited. Therefore, one of the reasons for the low ΦUCg of NIR-UC is the difficulty in optimizing the combination of sensitizer and annihilator to achieve a high ΦTET.
In recent years, ligand-protected noble-metal nanoclusters (NCs), which allow atomically precise photophysical property tuning, have emerged as powerful triplet sensitizers in TTA-UC.19–25 Many of the NCs exhibit luminescent lowest excited triplet states generated with nearly 100% efficiency (ΦISC ∼1) and relatively long lifetimes (τT) in the range of several microseconds. More noteworthy is that numerous NCs, distinguished by absorption bands extending into the NIR region (>700 nm),26–28 have been discovered thus far, showcasing their potential as NIR-absorbing sensitizers for TTA-UC. Among them, the superatomic molecular NC depicted in Scheme 2, [Au25(PPh3)10(S-C2H4Ph)5Cl2]2+ (hereafter referred to as Au-rod), is one such candidate.29 In Au-rod, the long absorption tail originating from the direct S–T transition extends to around 900 nm, and in fact, delayed fluorescence of rubrene based on the TTA-UC mechanism was observed at 785 nm excitation.21 Notably, Au-rod possesses the capability to incorporate heteroatoms, such as Ag and Cu, into the bi-icosahedral core.30,31 Introducing Ag atoms into the bi-icosahedral core of Au-rod was found to induce a hypsochromic shift in the absorption band.22 Our recent study has revealed that this shift is due to the replacement of the central atom of the bi-icosahedral core with an Ag atom, which induces a pronounced higher energy shift of the T1 state.22 As a result, the Ag-doped NCs, i.e., [Au25−xAgx(PPh3)10(S-C2H4Ph)5Cl2]2+ (AuAg-rod), served as a sensitizer for red-to-blue UC. In contrast, in the Cu-doped NCs, [Au25−xCux(PPh3)10(S-C2H4Ph)5Cl2]2+ (AuCu-rod), the absorption bands remain in the NIR region, because the central atom is presumably not replaced by a Cu atom.31 Therefore, AuCu-rod, which does not exhibit the pronounced energy shift in the T1 state as when Ag-doped, may be a promising sensitizer for NIR-UC. In this study, we initially elucidated the fundamental properties of AuCu-rod as a triplet sensitizer. Subsequently, we combined it with the 9,10-bis(phenylethynyl)anthracene (BPEA) annihilator, a green emitter with the T1 state in the NIR region (ET ∼1.3 eV),32–35 an extremely low ΦISC (10−5–10−4),36 and almost 100% fluorescence quantum yields (ΦF ∼1) independent of the solvent,37 to assess the performance of NIR-UC. Moreover, it was compared with that of the Au-rod/BPEA pair to unravel the impact of Cu doping on the NIR sensitization properties.
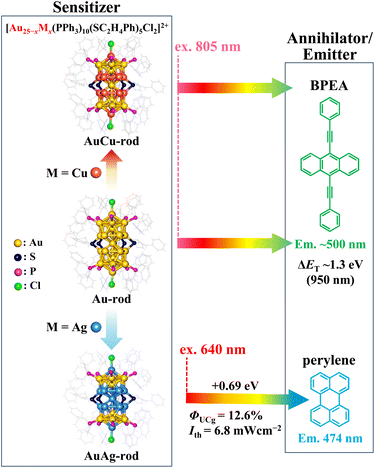 | ||
| Scheme 2 [Au25(PPh3)10(S-C2H4Ph)5Cl2]2+ (Au-rod) and its alloy nanoclusters, [Au25−xCux(PPh3)10(S-C2H4Ph)5Cl2]2+ (AuCu-rod) and [Au25−xAgx(PPh3)10(S-C2H4Ph)5Cl2]2+ (AuAg-rod), were paired with the annihilator/emitter agents BPEA (for NIR-to-visible UC) and perylene (for red-to-blue UC), respectively. Chemical structures of these nanoclusters taken from ref. 30 and 31. The UC performance of AuAg-rod, taken from ref. 22, was also presented. | ||
Results and discussion
Absorption and emission properties
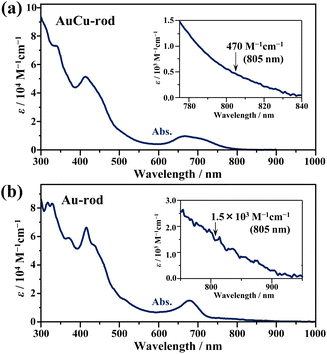
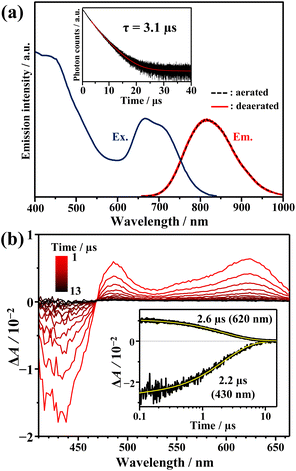
Fig. 1a shows the absorption spectra of the prepared AuCu-rod (average number of Cu-doping: xave = 5.6, see Fig. S1†). The overall feature of the absorption spectrum, including the first absorption band at 650–800 nm and the absorption peak near 415 nm, were in good agreement with those in the literature.31 Compared to the absorption tail (730–900 nm) of Au-rod (Fig. 1b), the absorption edge of AuCu-rod was observed at the shorter wavelength region. Considering that the absorption tail of Au-rod is a direct S–T transition from the ground state,21 the T1 state of AuCu-rod is considered to be somewhat shifted toward shorter wavelength (or higher energy) side. As mentioned earlier, the degree of this blueshift is significantly smaller compared to the case of AuAg-rod (xave = 12), where the shared vertex Au atom in the bi-icosahedron is replaced with the 13th Ag atom.30 This suggests that in AuCu-rod, the shared Au atom is not replaced by the Cu atom, which corresponds with the low average number of doped atoms (xave = 5.6). According to the literature,31 the two pentagonal layers (10-atom sites) bonded to the central Au atom in the bi-icosahedral core and the top-site Au atoms coordinated by Cl atoms (2-atom sites) are preferentially replaced by Cu atoms (Scheme 2). The number of introduced Cu atoms (x) in the alloy NCs synthesized ranged from 1 to 10, suggesting the coexistence of alloy NCs in which some of the 12-atom sites are partially replaced by Cu atoms. The molar absorption coefficient (ε) at 805 nm was determined to be 470 M−1 cm−1, decreasing to nearly zero at around 840 nm. Similar to Au-rod, this absorption edge region of AuCu-rod should originate from S–T transitions, so that the T1 state of AuCu-rod presumably resides around 1.5 eV. Therefore, an exothermic TET process from the AuCu-rod sensitizer to the BPEA annihilator (ET ∼1.3 eV) is expected.As depicted in Fig. 2a, AuCu-rod displays a NIR emission spectrum with a peak at around 810 nm. The excitation spectrum, obtained by monitoring this emission, aligned consistently with the absorption spectrum, confirming the origin of the observed emission from AuCu-rod. This emission remains unaffected by oxygen, with no discernible change in intensity or lifetime (3.1 μs) observed under air-saturated conditions. The time evolution of transient absorption (TA) spectra presented in Fig. 2b revealed a ground-state breach (GSB) at wavelengths below 469 nm and broad excited-state absorption (ESA) band at longer wavelengths (>469 nm). Both bands were observed within 0.1 ns immediately after the 670 nm excitation, with decay times of 2–3 μs. The agreement between the ESA decay time constants and the emission lifetime indicates an identical excited state kinetics are probed in both spectroscopic measurements.
Triplet nature and triplet sensitization
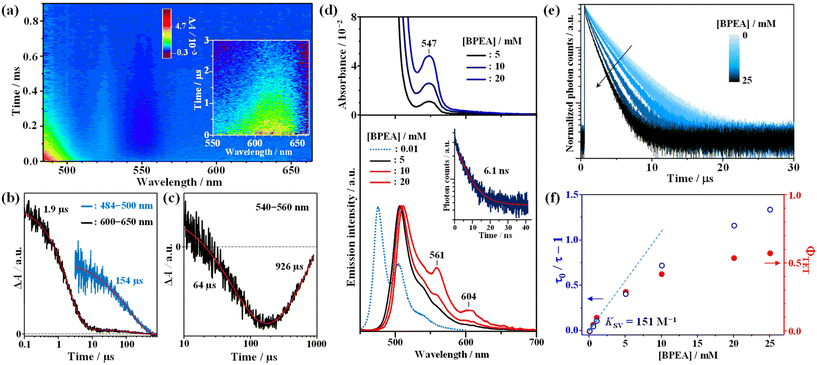
To gain insight into the triplet nature of this excited state, quenching experiments were performed using BPEA as an acceptor, and the results are depicted in Fig. 3. As evident from Fig. 3a and b, the addition of BPEA (5 mM) shortened the decay time of the ESA band to 1.9 μs. Additionally, a new band emerged below 500 nm, with a prolonged decay time (154 μs), indicative of the triplet–triplet (T–T) absorption of BPEA.38 This observation provides clear evidence for TET from AuCu-rod to BPEA and establishes that the observed NIR emission is phosphorescence. In line with the behavior observed in Au-rod and AgAu-rod,21,22AuCu-rod exhibited no fluorescence signal, coupled with the rapid triplet formation. Thus, it can be inferred that the ΦISC is nearly unity in the case of AuCu-rod as well. Note that the lack of phosphorescence quenching by oxygen can be attributed to the positive Gibbs free energy change (ΔGCT = +0.39 eV, Table S1†) in the oxygen quenching process that proceeds via the charge transfer mechanism.23Interestingly, concurrent with the decay of the T–T absorption of BPEA, a weak GSB signal was observed gradually rising around 540–560 nm (Fig. 3c). Furthermore, this GSB signal exhibited a considerably slow decay over a lifetime of nearly 1 ms. This GSB band closely corresponds to the absorption band around 550 nm observed for high concentrations of BPEA (upper part of Fig. 3d) and is therefore considered to originate from small amounts of BPEA aggregates formed in the THF solution. Dynamic light scattering (DLS) measurements for a 20 mM BPEA/THF solution confirmed the formation of BPEA aggregates, with sizes ranging from 0.6 μm to 1 μm (Fig. S2†). The absorption peak of the aggregates (547 nm) is situated on the longer wavelength side compared to lowest-energy absorption peak (498 nm) of the reported nanoparticles with an average diameter of 170 nm.39 In addition, the aggregates exhibited emission spectra with peaks at 561 nm and 604 nm (bottom part of Fig. 3d). Note that the peak around 520 nm originates from the fluorescence of the BPEA monomer. However, the peak wavelength is an apparent value caused by reabsorption by BPEA. It is noteworthy that the spectral feature of this emission closely resembles that of the one-dimensional microrods of BPEA.40 The emission lifetime obtained by monitoring emission signals above 560 nm is 6.1 ns, which is longer than the lifetime of the monomer emission (3.2 ns), and distinctly different from the nanoparticles with a very short emission lifetime (20 ps) due to non-radiative deactivation via singlet fission (SF).39 Hence, the formed BPEA aggregates possess an electronic structure and packing morphology in which SF is less likely to occur. Notably, the very slow rise (64 μs) and decay GSB (926 μs) signals indicate that the slow TET from triplet BPEA monomers to aggregates occurs, with the triplet energy being retained as triplet excitons in the aggregate for an extended period. This phenomenon has significant implications for the TTA-UC performance, as discussed below.
As depicted in Fig. 3e, a decrease in phosphorescence lifetime was observed with increasing BPEA concentration. To determine the TET rate constant (kTET), a Stern–Volmer analysis was conducted on the BPEA concentration dependence of the phosphorescence lifetime. As shown in Fig. 3f, the Stern–Volmer plot exhibited a linear relationship for BPEA concentrations below 1 mM, transitioning to a gradually saturating behavior in the high concentration region (≥5 mM). This nonlinear response with respect to BPEA concentration is reminiscent of the behavior observed in the Au-rod/BPEA system21 and can be attributed to the formation of BPEA aggregates in the high concentration region (Fig. 3d and Fig. S2†). Through fitting the linearly dependent region free from aggregation effects, the kTET value were determined to be and 5.0 × 10⁷ M−1 s−1 (Stern–Volmer constant (KSV) of 151 M−1). This value is 10-fold larger than that of Au-rod (4.6 × 10⁶ M−1 s−1).21 Since the surface ligand environments of AuCu-rod and Au-rod are identical, this improvement is a result of a blue shift of the T1 state due to Cu doping, which increases the driving force of the TET process to the BPEA acceptor. When tetracene (ET = 1.27 eV) and rubrene (1.14 eV), which possess similar or lower T1 energies compared to BPEA (∼1.3 eV), were utilized as acceptors to evaluate kTET, they yielded kTET of 6.3 × 10⁷ M−1 s−1 and 5.9 × 10⁷ M−1 s−1, respectively (Fig. S3 and Table S2†). These rate constants were of similar magnitude to that of BPEA. Conversely, when perylene (ET = 1.53 eV), which has a higher T1 energy than BPEA, was employed as an acceptor, the kTET decreased to 1.5 × 10⁷ M−1 s−1. From these results, it can be inferred that the T1 state of AuCu-rod is indeed located around 1.5 eV, which also corresponds well with the fact that the absorption band edge based on the direct S–T transition from the ground state was observed at around 830 nm (see Fig. 1a). The maximum value of kTET (7.1 × 10⁷ M−1 s−1) of AuCu-rod is one order of magnitude smaller than that of NCs with electronic states (hole and electron distributions) extending to the surface ligands.24,25 This large difference can be attributed to the fact that the T1 state of AuCu-rod is mainly localized on the metal core, with the hole and electron distribution being sterically shielded from the external environment by the surface ligands (PPh3 and S-C2H4Ph). The ΦTET values was obtained using the following equation:
 | (2) |
Near-infrared photon upconversion performance
Fig. 4a depicts the emission spectrum obtained from a deaerated THF solution containing AuCu-rod (50 μM) and BPEA (20 mM) obtained when excited with a the continuous-wave 805(±2)-nm laser. Strong UC emission with peaks at 507, 561, and 604 nm was observed at wavelengths shorter than the excitation light. As evident from the comparison with Fig. 3d and the UC emission spectrum measured before BPEA reached dissolution equilibrium, the emission around 507 nm is primarily attributed to fluorescence from BPEA monomers. Meanwhile, the longer wavelength portion featuring peaks at 561 nm and 604 nm originates from the emission from BPEA aggregates. This is also clear from the influence of BPEA concentration on the UC spectra. As shown in Fig. 4b, as the BPEA concentration increased, the contribution of UC emission from the aggregates (peaks at 561 and 604 nm) progressively increased.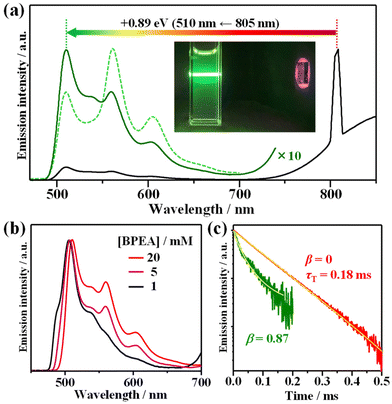 | ||
| Fig. 4 (a) Upconversion (UC) emission spectra of a mixture containing AuAc-rod (50 μM) and BPEA (20 mM) in deaerated THF, observed under continuous wave 805 nm laser excitation (5.1 W cm−2), and a photographic image of the UC emission captured without any filters. The dashed line represents the UC spectrum of the mixture measured before BPEA reached dissolution equilibrium. (b) UC spectra of mixtures containing AuAc-rod (50 μM) and BPEA at concentrations of 1, 5, and 20 mM. (c) UC emission decay curves obtained using appropriate filters for either monomer UC emission (λ ≤ 525 nm, solid green line) or aggregate UC emission (λ ≥ 625 nm, solid red line). The yellow solid lines represent least-square fitting curves obtained using eqn (3). | ||
Fig. 4c shows the decay profiles of each UC emission, observed using appropriate filters to separate the emissions. In a semi-logarithmic plot, the monomer UC emission decay exhibited a pronounced concave curvature, whereas the UC emission decay derived from aggregates was almost linear. These differences in behaviour reflect the varying degrees of TTA influence on the deactivation processes of triplet BPEA monomers and triplet excitons in aggregates. The time trace of UC emission intensity, IUC(t), can be analysed using the following equation:41
 | (3) |
 | (4) |
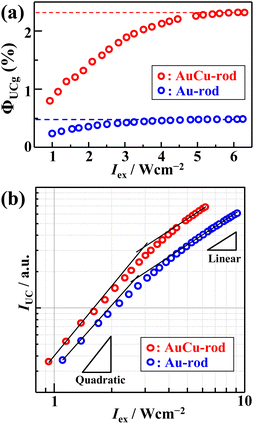
Fig. 5a shows the excitation intensity-dependent ΦUCg (out of 50% maximum) of AuCu-rod (50 μM) or Au-rod (50 μM) with BPEA (20 mM), obtained using the relative method (eqn (S1)†). From the saturation region of ΦUCg beyond 5 W cm−2, the maximum values of ΦUCg were determined to be 2.33 ± 0.05% for AuCu-rod and 0.49 ± 0.01% for Au-rod (Fig. S4 and S5†). Thus, an improvement in ΦUCg by 4.7-fold was observed, which mainly reflects the 3-fold enhancement in ΦTET. As a comparison, Table 1 presents the literature values of ΦUCg when excited near 800 nm for solution systems employing various sensitizers. The ΦUCg of AuCu-rod is significantly superior to those of PbSe and PbS nanoparticles without transmitter ligands, but inferior to those of the nanoparticles with transmitter ligands. As mentioned earlier, the ΦTET of AuCu-rod is 0.54 at 20 mM BPEA, suggesting there is considerable potential for enhancement. Recent findings from our group indicate that the TET rate constant can be markedly improved by incorporating triplet-mediator ligands that maintain the triplet energy, even in ligand-protected metal nanoclusters.45 Therefore, applying this approach to Au-rod and AuCu-rod is anticipated to further enhance the NIR-UC efficiency. The development of such systems is currently in progress within our group.
| Sensitizer | Annihilator | λ ex/nm | Φ UCg (%) |
|---|---|---|---|
a Values reported with a maximum of 100% were halved.
b ![[thin space (1/6-em)]](https://www.rsc.org/images/entities/char_2009.gif) Ref. 16.
c Ref. 16.
c ![[thin space (1/6-em)]](https://www.rsc.org/images/entities/char_2009.gif) Ref. 43.
d Ref. 43.
d ![[thin space (1/6-em)]](https://www.rsc.org/images/entities/char_2009.gif) Ref. 44. Ref. 44.
|
|||
| AuCu-rod | BPEA | 805 | 2.33 ± 0.05 |
| Au-rod | BPEA | 805 | 0.49 ± 0.01 |
| PbSeb | Rubrene | 800 | 0.1 |
| PbSe/CPTb | Rubrene | 808 | 1.05 |
| PbSb | Rubrene | 808 | 0.0105 |
| PbS/CPTb | Rubrene | 808 | 0.85 |
| PbS/CdS/5-CATc | Rubrene | 808 | 4.2 |
| PbS/Th-DPPd | Rubrene | 808 | 6.8 |
The dependence of UC emission intensity (IUC) on excitation intensity (Iex), as depicted in Fig. 5b, exhibits a shift from quadratic to linear behavior in the UC emission intensity. This transition marks the determination of the UC threshold intensity (Ith), a critical performance metric for the TTA-UC system, which was identified at 2.9 W cm−2. Note that an almost identical magnitude of Ith = 2.5 W cm−2 was obtained for Au-rod (Fig. 5b). Iex is expressed by the following:46
 | (5) |
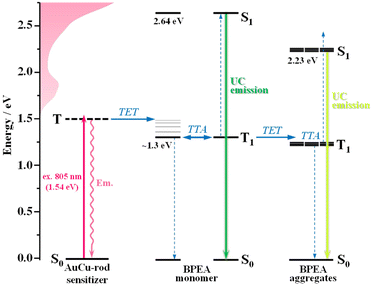
Fig. 6 illustrates a proposed energy-level diagram for the photophysical processes occurring in a TTA-UC system comprising the AuCu-rod sensitizer and BPEA annihilator. The excitation of AuCu-rod at 805 nm is anticipated to directly induce the electronic transition from the ground state to the triplet state. Such direct generation of the sensitizer triplets offers the advantage of suppressing energy loss during the ISC process and increasing the anti-Stokes shift. Indeed, the system successfully converted 805 nm NIR light into 510 nm visible light, achieving an anti-Stokes shift approximately 300 nm in wavelength and 0.9 eV in energy. TET from the triplet AuCu-rod sensitizer to BPEA monomers, followed by TTA among the triplet monomers, results in green UC emission. In addition, some triplet monomers occur TET to BPEA aggregates, generating multiple triplet excitons in the aggregates. As a result, TTA occurs within the aggregates, leading to yellow UC emission from the aggregates that is shifted to longer wavelengths compared to the monomer UC emission. The S1 state energy (ES) of the aggregates was estimated to be around 2.23 eV (555 nm) based on the intersection of their absorption and emission spectra (Fig. 3d). This is a shift from the S1 energy of the monomer (2.64 eV) to an energy approximately 0.4 eV lower, which reflects the singlet exciton coupling strength of the aggregates.
As can be seen in Fig. 4b, the impact of BPEA concentration on the UC spectrum reveals a significant escalation in the contribution of UC emission from aggregates as the BPEA concentration rises. Despite this augmentation, the UC quantum yield (ΦUCg) maintains a nearly linear growth (Fig. S6†). Considering that beyond 10 mM concentration, the increment in ΦTET diminishes and nears saturation (refer to Fig. 3f), the linear enhancement of ΦUCg with higher BPEA concentrations could be attributed to the superior ΦTTA within the aggregates, offsetting the reduced gains in ΦTET. In the case of BPEA monomers, the energy of the S1 state (ES) is approximately twice that of the T1 state, with the ES − 2ET difference being only 30 meV.35 However, within aggregates, the stronger singlet exciton coupling compared to that of triplet excitons,35 the relative energy relationship may change to ES < 2ET. This variation not only promotes TTA but also inhibits SF, which is consistent with the experimental observations. Another contributing factor might be the anisotropic growth of aggregates into one-dimensional (1D) microrods aligned along the π–π stacking direction,40 which would primarily limit exciton migration to this 1D pathway. Such spatial restriction is likely to heighten the encounter rate among triplet excitons,47 thereby elevating ΦTTA. Hence, the current results suggest the usefulness of low-dimensional BPEA aggregates as a platform for efficient TTA in NIR-UC applications, warranting further investigation.
Conclusions
In summary, we explored the photophysical characteristics and NIR-UC performance of AuCu-rod acting as a triplet sensitizer, in combination with a BPEA annihilator, and compared the results with those from an Au-rod/BPEA sensitizer-annihilator pair. Our findings revealed that Cu-substitution leads to a moderate blue shift in the triplet state, markedly improving both TET and UC quantum yields relative to the Au-rod/BPEA combination. Interestingly, we also discovered that micro-aggregates of BPEA annihilators serve as a highly effective platform for TTA and subsequent UC emission. The findings underscore the significance of fine-tuning the triplet state energy via atomic-level alloying of the NIR-absorbing NC sensitizers to refine the synergy between sensitizer and annihilator, thereby enhancing TET efficiency and NIR-UC performance. Considering the abundance of ligand-protected noble-metal NCs capable of absorbing NIR light, the pursuit of these promising strategies is anticipated to further improve the performance of NIR-UC in the future.Author contributions
Yuki Miyoshi: experiment, data acquisition, analysis. Daichi Arima: experiment, data acquisition, analysis. Masaaki Mitsui: supervision, writing – revision and editing, theoretical calculations, and funding acquisition.Data availability
The data supporting this article have been included as part of the ESI.†Conflicts of interest
There are no conflicts to declare.Acknowledgements
This work is partly supported by the Grant-in-Aids for Scientific Research (C), no. 20K05653 and Scientific Research (B), no. 24K01614 and the 45th Japan Sheet Glass Society for the Promotion of Materials Science and Engineering Research Grant. The authors thank Dr Shusaku Nagano of Rikkyo University for the loan of the dynamic light scattering equipment.References
- Q. Wang and K. Domen, Chem. Rev., 2020, 120, 919–985 CrossRef CAS PubMed.
- J. M. Cole, G. Pepe, O. K. A. Bahri and C. B. Cooper, Chem. Rev., 2019, 119, 7279–7327 CrossRef CAS PubMed.
- G. Zhang, F. R. Lin, F. Qi, T. Heumüller, A. Distler, H.-J. Egelhaaf, N. Li, P. C. Y. Chow, C. J. Brabec, A. K.-Y. Jen and H.-L. Yip, Chem. Rev., 2022, 122, 14180–14274 CrossRef CAS PubMed.
- D. V. Kozlov and F. N. Castellano, Chem. Commun., 2004, 2860 RSC.
- S. Baluschev, T. Miteva, V. Yakutkin, G. Nelles, A. Yasuda and G. Wegner, Phys. Rev. Lett., 2006, 97, 143903 CrossRef CAS PubMed.
- A. Monguzzi, J. Mezyk, F. Scotognella, R. Tubino and F. Meinar, Phys. Rev. B: Condens. Matter Mater. Phys., 2008, 78(19), 5112 CrossRef.
- Y. Y. Cheng, T. Khoury, R. G. C. R. Clady, M. J. Y. Tayebjee, N. J. Ekins-Daukes, M. J. Crossley and T. W. Schmidt, Phys. Chem. Chem. Phys., 2010, 12, 66–71 RSC.
- T. N. Singh-Rachford and F. N. Castellano, Coord. Chem. Rev., 2010, 254, 2560–2573 CrossRef CAS.
- Y. Zhou, F. N. Castellano, T. W. Schmidt and K. Hanson, ACS Energy Lett., 2020, 5, 2322–2326 CrossRef CAS.
- W. Liang, C. Nie, J. Du, Y. Han, G. Zhao, F. Yang, G. Liang and K. Wu, Nat. Photonics, 2023, 17, 1–8 CrossRef.
- P. Bharmoria, H. Bildirir and K. Moth-Poulsen, Chem. Soc. Rev., 2020, 49, 6529–6554 RSC.
- V. Yakutkin, S. Aleshchenkov, S. Chernov, T. Miteva, G. Nelles, A. Cheprakov and S. Baluschev, Chem. – Eur. J., 2008, 14, 9846–9850 CrossRef CAS PubMed.
- T. N. Singh-Rachford, A. Nayak, M. L. Muro-Small, S. Goeb, M. J. Therien and F. N. Castellano, J. Am. Chem. Soc., 2010, 132, 14203–14211 CrossRef CAS PubMed.
- S. Amemori, N. Yanai and N. Kimizuka, Phys. Chem. Chem. Phys., 2015, 17, 22557–22560 RSC.
- Z. Huang, X. Li, M. Mahboub, K. M. Hanson, V. M. Nichols, H. Le, M. L. Tang and C. J. Bardeen, Nano Lett., 2015, 15, 5552–5557 CrossRef CAS.
- Z. Huang, D. E. Simpson, M. Mahboub, X. Li and M. L. Tang, Chem. Sci., 2016, 7, 4101–4104 RSC.
- Z. Huang, X. Zihao, M. Mahboub, Z. Liang, P. Jaimes, P. Xia, K. R. Graham, M. L. Tang and T. Lian, J. Am. Chem. Soc., 2019, 141(25), 9769–9772 CrossRef CAS PubMed.
- N. Nishimura, J. R. Allardice, J. Xiao, Q. Gu, V. Gray and A. Rao, Chem. Sci., 2019, 10, 4750–4760 RSC.
- Y. Niihori, Y. Wada and M. Mitsui, Angew. Chem., Int. Ed., 2021, 60, 2822–2827 CrossRef CAS.
- D. Arima, Y. Niihori and M. Mitsui, J. Mater. Chem. C, 2022, 10, 4597–4606 RSC.
- M. Mitsui, Y. Wada, R. Kishii, D. Arima and Y. Niihori, Nanoscale, 2022, 14, 7974–7979 RSC.
- M. Mitsui, D. Arima, Y. Kobayashi, E. Lee and Y. Niihori, Adv. Opt. Mater., 2022, 10, 2200864 CrossRef CAS.
- M. Mitsui, D. Arima, A. Uchida, K. Yoshida, Y. Arai, K. Kawasaki and Y. Niihori, J. Phys. Chem. Lett., 2022, 13, 9272–9278 CrossRef CAS.
- D. Arima and M. Mitsui, J. Am. Chem. Soc., 2023, 145, 6994–7004 CrossRef CAS PubMed.
- M. Mitsui and A. Uchida, Nanoscale, 2024, 16, 3053–3060 RSC.
- (a) R. Jin, Nanoscale, 2015, 7, 1549–1565 RSC; (b) X. Kang, Y. Li, M. Zhu and R. Jin, Chem. Soc. Rev., 2020, 49, 6443–6514 RSC.
- M. S. Bootharaju, V. M. Burlakov, T. M. D. Besong, C. P. Joshi, L. G. AbdulHalim, D. M. Black, R. L. Whetten, A. Goriely and O. M. Bakr, Chem. Mater., 2015, 27, 4289–4297 CrossRef CAS.
- X. Kang, H. Chong and M. Zhu, Nanoscale, 2018, 10, 10758–10834 RSC.
- (a) Y. Shichibu, Y. Negishi, T. Watanabe, N. K. Chaki, H. Kawaguchi and T. Tsukuda, J. Phys. Chem. C, 2007, 111, 7845 CrossRef CAS; (b) H. Qian, W. T. Eckenhoff, M. E. Bier, T. Pintauer and R. Jin, Inorg. Chem., 2011, 50, 10735–10739 CrossRef CAS.
- S. Wang, X. Meng, A. Das, T. Li, Y. Song, T. Cao, X. Zhu, M. Zhu and R. Jin, Angew. Chem., Int. Ed., 2014, 53, 2376 CrossRef CAS PubMed.
- S. Yang, J. Chai, T. Chen, B. Rao, Y. Pan, H. Yu and M. Zhu, Inorg. Chem., 2017, 56, 1771–1774 CrossRef CAS PubMed.
- Y. J. Bae, J. A. Christensen, G. Kang, J. Zhou, R. M. Young, Y.-L. Wu, R. P. Van Duyne, G. C. Schatz and M. R. Wasielewski, J. Chem. Phys., 2019, 151, 044501 CrossRef PubMed.
- V. Gray, A. Dreos, P. Erhart, B. Albinsson, K. M.-Poulsen and M. Abrahamsson, Phys. Chem. Chem. Phys., 2017, 19, 10931–10939 RSC.
- F. Zhong and J. Zhao, Dyes Pigm., 2017, 136, 909–918 CrossRef CAS.
- S. Jana, A. L. Yapamanu and S. Umapathy, Phys. Chem. Chem. Phys., 2019, 21, 14341–14349 RSC.
- M. Mitsui, Y. Kawano, R. Takahashi and H. Fukui, RSC Adv., 2012, 2, 9921–9931 RSC.
- A. Demeter, J. Phys. Chem. A, 2014, 118, 9985–9993 CrossRef CAS.
- T.-S. Fang, J. Lin, R. Schneider, T. Yamada and L. A. Singer, Chem. Phys. Lett., 1982, 92, 283–287 CrossRef CAS.
- B. Manna, A. Nandi and R. Ghosh, J. Phys. Chem. C, 2018, 122, 21047–21055 CrossRef CAS.
- Y. S. Zhao, J. Xu, A. Peng, H. Fu, Y. Ma, L. Jiang and J. Yao, Angew. Chem., Int. Ed., 2008, 47, 7301–7305 CrossRef CAS PubMed.
- S. M. Bachilo and R. B. Weisman, J. Phys. Chem. A, 2000, 104, 7711–7714 CrossRef CAS.
- F. Edhborg, A. Olesund and B. Albinsson, Photochem. Photobiol. Sci., 2022, 21, 1143–1158 CrossRef CAS PubMed.
- M. Mahboub, Z. Huang and M. L. Tang, Nano Lett., 2016, 16, 7169–7175 CrossRef CAS PubMed.
- L.-H. Jiang, X. Miao, M.-Y. Zhang, J.-Y. Li, L. Zeng, W. Hu, L. Huang and D.-W. Pang, J. Am. Chem. Soc., 2024, 146, 10785–10797 CrossRef CAS PubMed.
- D. Arima, S. Hidaka, S. Yokomori, Y. Niihori, Y. Negishi, R. Oyaizu, T. Yoshinami, K. Kobayashi and M. Mitsui, J. Am. Chem. Soc., 2024, 146, 16630–16638 CrossRef CAS PubMed.
- Y. Murakami and K. Kamada, Phys. Chem. Chem. Phys., 2021, 23, 18268–18282 RSC.
- R. Sato, H. K.-Nishioka, K. Kamada, T. Mizokuro, K. Kobayashi and Y. Shigeta, J. Phys. Chem. Lett., 2018, 9, 6638–6643 CrossRef CAS PubMed.
Footnote |
| † Electronic supplementary information (ESI) available. See DOI: https://doi.org/10.1039/d4nr01948b |
| This journal is © The Royal Society of Chemistry 2024 |

