Microkinetic modeling of the homogeneous thermal oligomerization of ethylene to liquid fuel-range hydrocarbons†
Received
23rd June 2023
, Accepted 29th January 2024
First published on 2nd February 2024
Abstract
The thermal oligomerization of ethylene is an intriguing reaction for the production of fuel-range products. Often viewed as a detrimental reaction leading to polymeric deposits in pipelines, recent work suggests that it can be exploited to convert ethylene to higher hydrocarbons in the C5–C12 range. Despite the long history surrounding this reaction, quantum chemical simulations have not been fully deployed to provide full mechanistic understanding, and kinetic models to optimize reaction conditions are lacking. In this work, a microkinetic model based on quantum chemical calculations was developed to unravel the primary drivers of initiation and understand the formation of a variety of products of different carbon number, including odd-numbered products. Through flux analysis, the main driver of initiation was identified to be hydrogen abstraction from ethylene by a 1,4-butyl diradical produced from the reaction of two ethylene molecules. As conversion increased, the primary initiation mode switched to hydrogen abstraction by a butene diradical as 1-butene began to be produced in high quantities. Odd-numbered carbon species were seen to originate from the β-scission of C8 radical species, with the radical position varied due to intramolecular hydrogen shift reactions from terminal radicals formed via radical addition reactions. The significant quantity of linear terminal olefins in the experimental product distribution was identified to originate from the formation of vinyl radicals through hydrogen abstraction reactions involving ethylene that were then propagated via radical addition reactions to ethylene. The insights from this work can aid in the development of intensified reactor systems to valorize ethane streams from shale gas production, converting waste streams directly to usable fuel products.
1. Introduction
The valorization of ethane has rapidly become a key topic for the global energy economy.1 Shale gas feedstocks are rich in excess ethane that must be disposed of, typically by flaring.2,3 Upgrading this ethane to ethylene and further oligomerizing ethylene into liquid fuel-range products at the site of production provides an opportunity for utilizing what is otherwise a direct waste stream.4 Catalytic methods of upgrading ethylene feedstocks can be effective but come with a number of drawbacks, either requiring significant surrounding architecture and capital or struggling with deactivation and lifetime.5–11 As such, thermal processes for upgrading ethylene have long been investigated, though catalytic processes still dominate industrially due to favorable selectivities towards beneficial product distributions at more mild conditions than classical thermal upgrading.12
However, a recent study has shown the potential for upgrading ethylene at milder conditions, reporting significant conversion below 500 °C.13 Interestingly, the product distribution for this reaction includes a number of odd-numbered carbon species, yet it lacks significant production of methane or ethane. There is also significant preference towards linear terminal olefins and a high concentration of 1-butene.
Despite the long history of this class of reactions and a number of proposed mechanisms,14–26 there is a notable absence of quantum chemical calculations, leading to a lack of mechanistic understanding. There has been much speculation in this area, with proposals of diradical initiation reaching as far back as the work of Hurd et al. in 1934,14 yet quantum chemical calculations have as of yet not been applied to resolve the key drivers of initiation. This recent experimental study provides the opportunity to resolve this near-century-old question through microkinetic modeling.
Microkinetic modeling, a technique for modeling reaction networks without making assumptions about rate-determining steps, has been used successfully in prior work to model ethene oligomerization on catalytic surfaces.27–30 In this work, a microkinetic model designed to unravel the growth and emergence of odd-numbered carbon species in the thermal oligomerization of ethylene with an explicit initiation scheme parameterized from density functional theory (DFT) was developed. The findings of this work can aid in the development of intensified reactor systems for the direct valorization of ethane streams from shale gas production to convert would-be waste into usable fuel products.
2. Computational methods
2.1. Microkinetic modeling
The microkinetic model was constructed based on a set of ordinary differential equations encompassing the change in concentration of gaseous species, both molecules and radicals, within the proposed mechanism, which is shown in Fig. 1. First, the equations defining the rate of each elementary step in the reaction mechanism took the form:| |  | (1) |
where ri is the rate of elementary step i, Ai is the pre-exponential factor, Ea,i is the activation energy, R is the universal gas constant, T is the temperature, and Pj is the partial pressure of reactant j. A set of ordinary differential equations spanning the gaseous species was arranged from these rates, leading to the following:| |  | (2) |
where νi,j is the stoichiometric number of species j in elementary step i, Fj is the molar flowrate of species j, and V is the volume of the system being integrated over. This set of ordinary differential equations described a plug flow reactor, which is the reactor type used experimentally in the work of Conrad et al. to which the model results were compared. The key input conditions and variables of the experiments that were modeled were: a pure feed of C2H4, a plug-flow reactor volume of 30 cm3, a constant temperature of 465 °C assuming ideal heat transfer, a feed flow of 156 sccm, and two separate constant pressure conditions of 15.0 and 25.0 bar.13
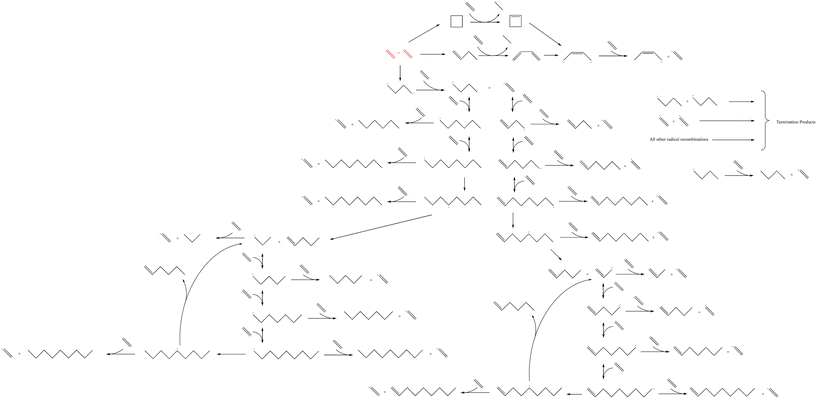 |
| | Fig. 1 The reaction mechanism for the microkinetic model of homogeneous thermal oligomerization of ethylene. Different segments of the mechanism are highlighted in Fig. 2 as well as Fig. S1–S3† for easy reference and labeling of species. | |
To parameterize the model, elementary steps were assumed to be of Arrhenius form, and the activation energies were postulated to follow the Evans–Polanyi principle, defined as:
| Ea = E0 + αΔH0rxn if ΔH0rxn > 0; |
| | | Ea = E0 + (1 − α)ΔH0rxn if ΔH0rxn < 0 | (3) |
where
Ea is the activation energy,
E0 is a reference energy for a group of similar reactions,
α is the transfer coefficient (defined in the endothermic direction) which is a measure of the similarity of a reaction's transition state to its reactant or product state with a value of 0 representing the reactant state and 1 the product state, and Δ
H0rxn is the enthalpy of reaction.
31,32 Elementary steps were grouped by similarity according to this principle into classifications known as reaction families. Each reaction family was assumed to share the parameters
E0 and
α, for use in calculating activation energy, as well as a pre-exponential factor. Calculation of the heat of formation for all species, including radical intermediates, was done through Benson's group additivity, in which a polyvalent atom comprises a group that is defined by the central atom and its surrounding atoms, which are assigned contributions to the molecule's overall heat of formation and summed.
33
For a subset of reactions, specifically the early initiation events, rate coefficients were calculated directly from DFT as described below. To account for uncertainty in parameters derived from density functional theory, including those aggregated for reaction families, activation energies or E0 values were tuned within bounds of ±6 kJ mol−1 (±1.4 kcal mol−1), which were conservative estimates based on benchmark studies of the accuracy of various DFT methods for heats of formation of organic compounds,34 as activation barriers, which are related to enthalpic barriers, are more difficult to estimate than reaction energies. The pre-exponential factors were tuned within the bounds of one order of magnitude, which is also a conservative range based on what is expected from statistical mechanics and degrees of freedom analysis.35 Optimization of parameters was done on two experimental cases simultaneously (two different pressures), using the experimental carbon selectivity and conversion to formulate an objective function based on the sum of squares error. The microkinetic model was solved using the differential-algebraic solver DDASAC,36 selected due to success in solving stiff ordinary differential equations.
2.2. Density functional theory
Density functional theory calculations were performed using the Gaussian 16 software.37 All geometries and energies were calculated using the M062X functional38 in conjunction with the Def2TZVP basis set.39 Dispersion was included in the form of Grimme's D3 correction with zero damping. Contributions to the entropy from vibrational modes below 100 cm−1 were corrected using the quasi-harmonic approach of Grimme,40 as implemented in the GoodVibes software,41 and contributions from the same low frequency modes to the enthalpy were corrected using the approach of Head-Gordon and co-workers.42 GoodVibes was further employed to scale all vibrational frequencies by a factor of 0.971, the recommended value from Truhlar et al.43 All thermodynamic values are reported at 1 atm of pressure and at 25 °C. All geometry minima were confirmed to have zero imaginary frequencies, while transition state structures showed exactly one negative frequency mode.
Temperature dependent rate constants for the forward and reverse direction of each elementary reaction were calculated using the Eyring equation, which takes the form:
| |  | (4) |
where
kB is Boltzmann's constant,
T is the absolute temperature,
h is Planck's constant,
c0 is a standard state concentration factor (1 atm in this case), and
m is the molecularity of the elementary reaction. The Δ
G≠ term is the free energy barrier of the elementary reaction in the forward or reverse direction and
R is the universal gas constant. The
κ(
T) term is the Wigner tunneling correction factor of the form:
| |  | (5) |
where
|ν| is the magnitude of the negative frequency associated with the transition state reaction coordinate.
The Arrhenius parameters of Ea and A for both the forward and reverse reactions were obtained by plotting the natural log of the rate constant at three temperatures against the reciprocal of the temperature. The y-intercept of this plot gives the value of ln(A), and the slope is equal to −Ea/R. The calculated A and Ea values are provided in Table 1 in section 3.2.
Table 1 Initial values for parameters for the reactions in Fig. 1. Reaction family parameters were taken from the literature, and the parameters for the initiation steps were derived from density functional theory calculations reported earlier
| Parameter |
A (Pa−1 s−1 or s−1) |
E
0 or Ea (kcal mol−1) |
α
|
|
Bimolecular reaction, units Pa−1 s−1.
Unimolecular reaction, units s−1.
|
| H-Abstractiona,44 |
4.48 × 101 |
12.0 |
0.5 |
| Additiona,44 |
4.69 × 100 |
11.4 |
0.24 |
| End-chain β-scissionb,44 |
1.29 × 10¹³ |
11.4 |
0.76 |
| Mid-chain β-scissionb,44 |
5.35 × 10¹⁴ |
11.4 |
0.76 |
| Recombinationa,45 |
1.63 × 101 |
1.47 |
0 |
| 1,4 H-shiftb,44 |
1.58 × 10¹¹ |
20.8 |
— |
| 1,5 H-shiftb,44 |
1.82 × 10¹⁰ |
13.7 |
— |
|
Initiation label 1
,
13
|
2.73 × 100 |
68.4 |
— |
|
Initiation label 2
,
13
|
2.05 × 100 |
67.4 |
— |
|
Initiation label 3
,
13
|
3.31 × 10³ |
67.0 |
— |
|
Initiation label 4
,
13
|
1.44 × 10⁻¹ |
42.0 |
— |
|
Initiation label 5
,
13
|
1.42 × 100 |
45.1 |
— |
|
Initiation label 6
,
13
|
1.10 × 10¹⁵ |
56.5 |
— |
|
Initiation label 7
,
13
|
1.19 × 10¹⁶ |
48.6 |
— |
2.3. Reaction mechanism
The reaction mechanism that was modeled for the homogeneous thermal oligomerization of ethylene, shown in Fig. 1, begins with two ethylene molecules following three possible bimolecular reactions: the formation of cyclobutane, the formation of 1-butene, and the formation of a C4 diradical that undergoes hydrogen abstraction to form 1-butyl radical and the vinyl radical that is key to propagation. The 1-butene path and cyclobutane path encounter similar endpoints, with ethylene participating in a concerted reaction to transfer two hydrogen atoms from either cyclobutane or 1-butene to form ethane and a resonance-stabilized 2-butenyl-1,4-diradical, which then abstracts hydrogen from ethylene to form 2-butenyl-1-radical and vinyl radical.
Propagation proceeds via the major reaction families of hydrogen abstraction and radical addition. The primary cycle begins with addition of ethylene to vinyl radical to form 1-buten-4-yl radical in chain growth in even increments of two carbon atoms. Through reaction with ethylene, the dominant species at low to moderate conversion, this 1-buten-4-yl radical can then undergo hydrogen abstraction, forming 1-butene and regenerating the vinyl radical, or undergo further radical addition to 1-hexen-6-yl radical. This pattern of hydrogen abstraction and radical addition continues through C8 radical, at which point intramolecular hydrogen shift reactions offer possibilities to generate odd-numbered carbon species. Both 1,4- and 1,5-intramolecular hydrogen shift reactions were incorporated into the mechanism.
After intramolecular hydrogen shift, β-scission of C8 radical forms 1-pentene and allyl radical. This begins a cycle of odd-carbon-number propagation, with hydrogen abstraction from ethylene reforming vinyl radical and creating odd-numbered olefins. Ethylene addition in this cycle was modeled through 1-nonen-9-yl radical, since significant quantities of C10+ were not identified in experiment, at which point intramolecular hydrogen shift can allow for β-scission to form 1-hexene and regenerate allyl radical.
An analogous series of reactions was applied to the 1-butyl radical that forms with vinyl radical when 1,4-butyl diradical abstracts hydrogen from ethylene. This results in even-numbered alkyl chain growth, modeled up through the formation of 1-octyl radical, at which point either 1,4-hydrogen shift or 1,5-hydrogen shift can form an equivalent product of 4-octyl radical. This 4-octyl radical species can undergo β-scission to form pentene and 1-propyl radical, which undergoes a similar cycle to allyl radical of odd-carbon number chain growth and hydrogen abstraction up through C9 alkyl radical. When this C9 alkyl radical undergoes hydrogen shift, it is able to undergo β-scission to form 1-hexene and regenerate 1-propyl radical. All alkyl radical species are able to abstract hydrogen from ethene, resulting in the formation of vinyl radical, which is eligible for the propagation reactions described earlier. To maintain a tractable model size, branched products were excluded from this mechanism due to their low concentration in the experimental data.13 This is also consistent with the higher stability of secondary radical species compared to primary radicals, leading to lower rates of radical addition compared to that involving primary radicals. Termination occurs through radical recombination, and all possible permutations of recombination were modeled within the mechanism.
3. Results and discussion
3.1. Comparison of model results with experimental data
As described in the Computational methods section, initial values of the kinetic parameters for all reactions were specified based on a combination of literature values, structure/reactivity correlations, and density functional theory calculations, and then parameter estimation for a subset of parameters was carried out against experimental data at two values of total pressure using the full product distribution and the conversion of the ethene reactant to formulate an objective function based on sum of squares error. The initial values for all of the kinetic parameters are shown in Table 1. Labels of the initiation steps for referencing with the parameter table are shown in Fig. 2. Additional numeric labels for reaction steps are presented in Fig. S1–S3.† Examples of reactions within each reaction family are presented in Fig. 3. As described in section 2.1, parameters were tuned within the bounds of ±1.4 kcal mol−1 for activation energies or E0 values and ±1 order of magnitude for pre-exponential factors. Note that since experimental data with detailed product distributions and excellent carbon mass balance was only available at one temperature, the final values of A and Ea (or E0) are not unique, but given the tight bounds imposed on the parameters during fitting they represent reasonable values for testing against other reaction conditions for further refinement. The final values for the parameters are shown in Table 2.
 |
| | Fig. 2 Labels for initiation steps for ease of reference. | |
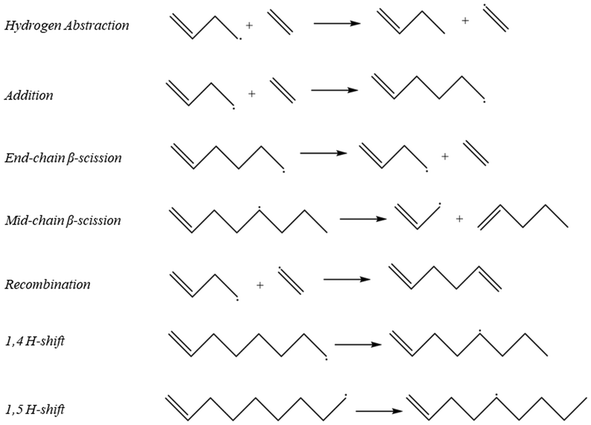 |
| | Fig. 3 Representative examples of reaction families that were used to create the full mechanism in Fig. 1. | |
Table 2 Final values of parameters based on optimization against experimental data. Pre-exponential factors were tuned with bounds of ±1 order of magnitude, whereas activation energies or E0 values were tuned within the bounds of ±1.4 kcal mol−1
| Parameter |
Original A |
Optimized A |
E
0 or Ea (kcal mol−1) |
Optimized E0 or Ea (kcal mol−1) |
|
Bimolecular reaction, units Pa−1 s−1.
Unimolecular reaction, units s−1.
E
0 values for reaction families that are the reverse of one another are equal to maintain thermodynamic consistency and are constrained accordingly during optimization.
|
| H-Abstractiona |
4.48 × 101 |
4.39 × 10² |
12.0 |
11.0 |
| Additiona |
4.69 × 100 |
4.69 × 10⁻¹ |
11.4 |
12.8c |
| End-chain β-scissionb |
1.29 × 10¹³ |
3.10 × 10¹² |
11.4 |
12.8c |
| Mid-chain β-scissionb |
5.35 × 10¹⁴ |
5.35 × 10¹⁵ |
11.4 |
12.8c |
| Recombinationa |
1.63 × 101 |
4.11 × 100 |
1.47 |
1.89 |
| 1,4 H-shiftb |
1.58 × 10¹¹ |
1.58 × 10¹² |
20.8 |
19.4 |
| 1,5 H-shiftb |
1.82 × 10¹⁰ |
1.82 × 10⁹ |
13.7 |
15.1 |
|
Initiation label 3
|
3.31 × 10³ |
3.31 × 10⁴ |
67.0 |
65.6 |
|
Initiation label 4
|
1.44 × 10⁻¹ |
1.44 × 100 |
42.0 |
40.6 |
|
Initiation label 6
|
1.10 × 10¹⁵ |
1.10 × 10¹⁴ |
56.5 |
57.9 |
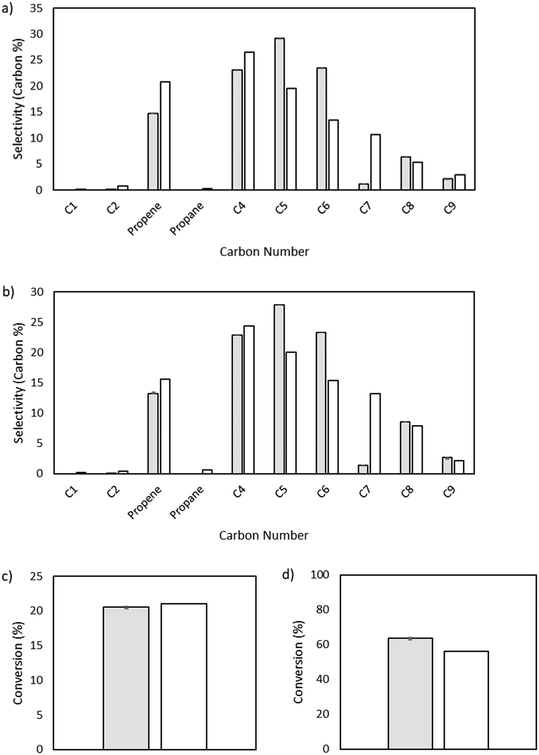
The output of the product distribution from the microkinetic model at total pressures of 15 and 25 bar is compared to the experimental data in Fig. 4. The microkinetic model results display reasonable agreement for conversion as a function of pressure as well as formation of olefins of all carbon numbers. Notably, the formation of odd-numbered carbons is generally captured well, with significant quantities of C3, C5, and C9 being observed. There is some overshoot in the prediction of C5 and C6 species, and a notable shortcoming of the model is in the undershoot of C7 formation. This undershoot is not unexpected and is a result of the truncation implemented to maintain a manageable model size. The model was truncated at C9, driven by the lack of experimentally observed C10+ species, thereby preventing the formation of high-molecular weight carbon species that could undergo favorable β-scission to form C7 product and artificially increasing the rate of formation of smaller molecules (e.g., C5 and C6) given the limited pathways involving higher molecular weight radicals.
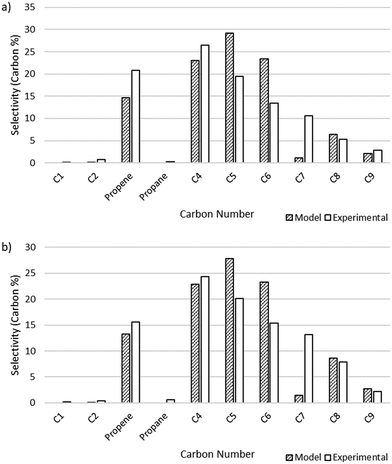 |
| | Fig. 4 Microkinetic model output showing selectivity measured by carbon percent for different carbon number species. a) Total pressure of 15 bar. Model conversion: 20.6%. Experimental conversion: 21%. b) Total pressure of 25 bar. Model conversion: 63.7%. Experimental conversion: 56%. | |
3.2. Reaction flux analysis
3.2.1. Ethylene consumption.
A comparison of all different reactions that consume ethylene is presented in Fig. S4 in the ESI,† taken at three different points along the simulated reactor: 10−10 cm3 to represent extrapolation to zero conversion, 10−1 cm3 as an early conversion point, and 30 cm3 for the reactor outlet. For the lowest conversion value analyzed at 15 bar, several trends emerge. The results are shown using a log scale, due to the large range in the order of magnitude of different reaction pathways. Ethylene is consumed by initiation reactions; specifically, hydrogen abstraction by 1,4-butyl diradical is many orders of magnitude faster than that by the butene diradical and is the fastest reaction recorded. Hydrogen abstraction from ethylene and addition to ethylene have roughly equivalent rates for a given radical (e.g., 1-hexenyl radical), and rates of a given reaction type involving either an alkenyl or alkyl radical are similar. However, as simulated volume increases, and thus conversion increases, alkenyl radicals begin to dominate, and thus, rates for a reaction of a given type (i.e., hydrogen abstraction or radical addition) of alkenyl radicals are much higher than those of alkyl radicals of the same carbon number. The concentration of vinyl radical increases disproportionately to the concentration of 1-butyl radical as the kinetic chain emerges and initiation effects are less significant. The net flux of butene diradical hydrogen abstraction begins to overtake that of the 1,4-butyl diradical hydrogen abstraction as the conversion of 1-butene to butadiene becomes a dominant reaction. At 25 bar, these trends are maintained, though the earliest conversion point is already notably approaching the pattern seen at larger reactor volumes, given that the conversion is higher at a given reactor volume when the pressure is higher.
3.2.2. Initiation flux comparison.
As seen in Fig. 2, there are distinct initiation routes that both ultimately lead to a vinyl radical. One comes from the 1,4-butyl diradical, while the other comes from the butene diradical. For the latter case, it emanates from the reaction of 1-butene with ethylene in a concerted step to form 1,3-butadiene. In the early stages of the reactor, 1-butene is formed via the initiation route shown in Fig. 2. However, 1-butene is also the product of a propagation cycle, and thus, one would expect the preponderance of the butene diradical pathway to increase as a function of conversion. To illustrate this, additional snapshots of the rates of these two reactions as a function of reactor volume are shown in Fig. 5. For the 15 bar case, in the latter two-thirds of the reactor, hydrogen abstraction from ethylene by butene diradical increases more significantly compared to hydrogen abstraction from ethylene by 1,4-butyl diradical as 1-butene is formed in meaningful quantities from propagation reactions. This trend is more notable in the 25 bar case, where conversion is over 50%. The rate of 1,4-butyl diradical hydrogen abstraction from ethylene exhibits a maximum followed by a decline while butene diradical hydrogen abstraction increases dramatically around 10−3 cm3, with the formation of 1-butene driving a switch in the primary initiation mode seen at 10 cm3 of simulated volume.
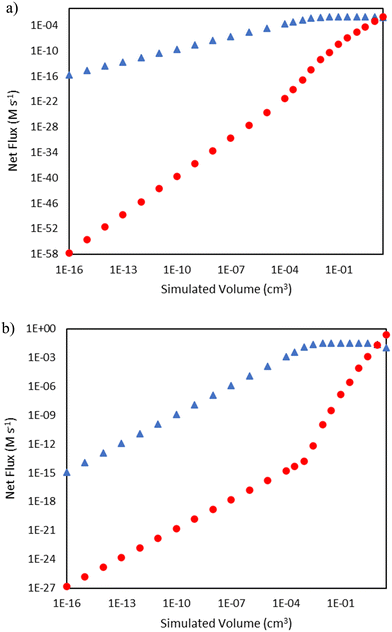 |
| | Fig. 5 Comparison of rates of hydrogen abstraction from ethylene by 1,4-butyl diradical (blue triangles  ) and butene diradical (red circles ) and butene diradical (red circles  ) as a function of reactor volume. a) Total pressure 15 bar b) total pressure 25 bar. ) as a function of reactor volume. a) Total pressure 15 bar b) total pressure 25 bar. | |
3.2.3. Comparison of 1-hexene formation by β-scission.
In the mechanism shown in Fig. 1, 1-hexene can be formed as a result of β-scission of either nonyl or nonenyl, resulting in the re-formation of propyl or allyl radical, respectively. Analysis of the trends in the fluxes of these two reactions gives insight into the dominance of the alkenyl radical chemistry (i.e., the right-hand side of Fig. 1) over the pathways carried by alkyl radicals (i.e., the left-hand side of Fig. 1) on the product distribution, e.g., the absence of propane as a major product in comparison to propene. Fig. 6 shows that for the 15 bar case, nonyl β-scission dominates only at extremely low conversions and reactor volume, with a transition to nonenyl β-scission dominance above approximately 10−4 cm3. Meanwhile, the 25 bar case, due to the higher conversion at low reactor volumes, has a higher rate of 1-hexene formation from nonenyl β-scission at all simulated volumes shown. The rates for both β-scission reactions taper as a function of reactor volume for both conditions as conversion rises, as increasing conversion reduces the concentration of ethylene available for the addition reactions key to forming larger radical species.
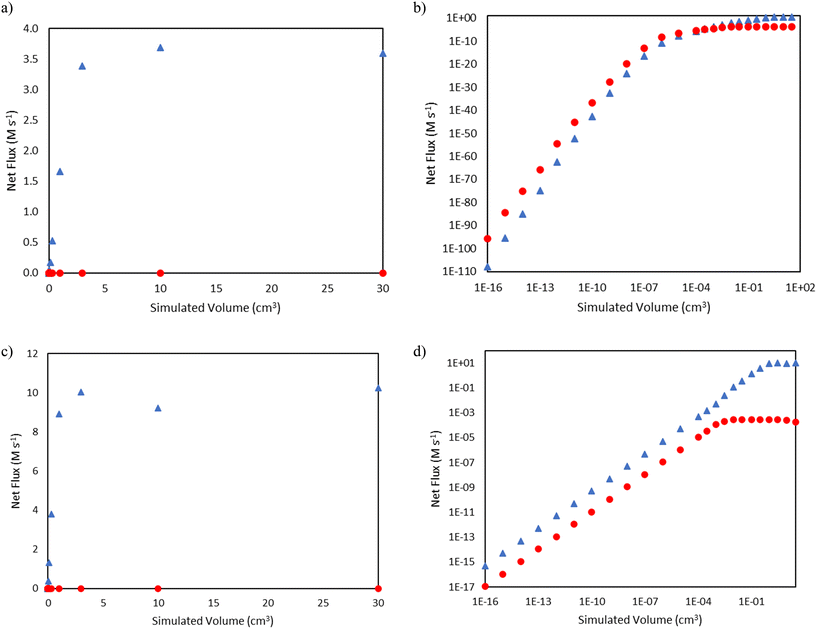 |
| | Fig. 6 Comparisons of net flux of nonenyl β-scission (blue triangles  ) and nonyl β-scission (red circles ) and nonyl β-scission (red circles  ) as a function of reactor volume. a) Total pressure 15 bar, linear scale b) total pressure 15 bar, log–log scale c) total pressure 25 bar, linear scale d) total pressure 25 bar, log–log scale. ) as a function of reactor volume. a) Total pressure 15 bar, linear scale b) total pressure 15 bar, log–log scale c) total pressure 25 bar, linear scale d) total pressure 25 bar, log–log scale. | |
3.2.4. C8 branchpoint: hydrogen abstraction versus β-scission.
C8 radical species have a major branchpoint that controls the formation of odd-numbered carbon species, as seen in Fig. 1. They can either undergo hydrogen abstraction, propagating vinyl radical while forming C8 alkane and alkene species, or they can undergo β-scission to form a C5 product and C3 radicals, kicking off formation of odd-number carbon species. Fig. 7 demonstrates how these reactions compete as a function of reactor volume. At 15 bar, the ratio of the total net rate of hydrogen abstraction by either octenyl or octyl radicals to the net rate of the same radical reacting via β-scission starts out greater than 1, but as ethene is consumed, the ratio transitions to less than 1. At 25 bar, this same transition is not evident at the reactor volumes (and thus conversion values) tallied, as β-scission has a higher net rate over all simulated volumes. The net rates of both pathways decrease at higher volumes as higher conversion values are reached, reducing the concentration of ethylene available for necessary addition reactions to generate C8 radicals.
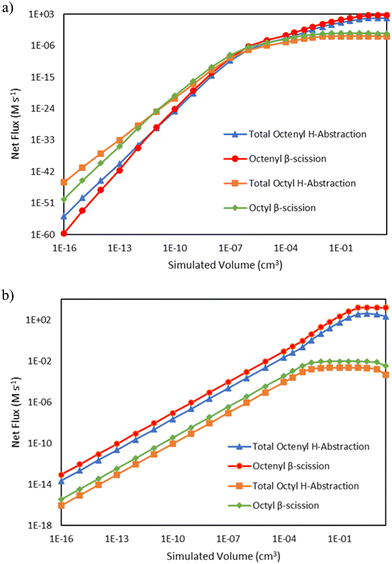 |
| | Fig. 7 Log–log comparisons of the net rates of C8 hydrogen abstraction and β-scission reactions as a function of reactor volume, including hydrogen abstraction by octenyl radical (blue triangles  ), β-scission of octenyl radical (red circles ), β-scission of octenyl radical (red circles  ), hydrogen abstraction by octyl radical (orange squares ), hydrogen abstraction by octyl radical (orange squares  ), and β-scission of octyl radical (green diamonds ), and β-scission of octyl radical (green diamonds  ). Lines are drawn to guide the eye, with markers indicating simulated output points. a) Total pressure 15 bar b) total pressure 25 bar. ). Lines are drawn to guide the eye, with markers indicating simulated output points. a) Total pressure 15 bar b) total pressure 25 bar. | |
3.3. Sensitivity analysis
Sensitivity analysis was conducted for each reaction type for which parameters were optimized as listed in Table 2 by solving the microkinetic model with each activation energy varied by ±1 kcal mol−1 from its optimized value and evaluating the impact on the final results. The results are shown below for selected reaction families in Fig. 8 through 11, with the remaining families summarized as Fig. S5–S8 in the ESI.†
Addition.
Interestingly, the model is not sensitive to changes to the base activation energy of addition, which at first may seem unexpected for a propagation reaction. As can be seen in Table S1 in the ESI,† the enthalpy for reaction of addition is strongly exothermic, and as a result, the activation energy calculated through the Evans–Polanyi approach is truncated to zero within the model. Thus, changes of ±1 kcal mol−1 in the base activation energy of addition may not be reflected in changes of ±1 kcal mol−1 for the activation energy of a specific addition reaction within the microkinetic model (Fig. 8).
 |
| | Fig. 8 Sensitivity analysis of the impact of varying the base activation energy of addition reactions by ±1 kcal mol−1. The shaded bars are the model results based on the optimized parameters in Table 2, and the sensitivity to changes in the activation energy is denoted by colored error bars. The non-shaded bars depict the experimental results. The blue error bar indicates the change resulting from increasing the base activation energy by 1 kcal mol−1, whereas the red error bar indicates the change resulting from decreasing the base activation energy by 1 kcal mol−1. a) Product selectivities at a total pressure 15 bar. b) Product selectivities at a total pressure 25 bar. c) Ethylene conversion at a total pressure 15 bar. d) Ethylene conversion at a total pressure 25 bar. | |
Hydrogen abstraction.
Given its key role in the propagation cycle that leads to a long kinetic chain, both the conversion and the product distribution are highly sensitive to the activation energy for hydrogen abstraction, with only a −1 kcal mol−1 change resulting in nearly full conversion for the 25 bar case. Hydrogen abstraction is not only one of the primary propagation steps, but it is a key reaction in the initiation cascade that leads to the creation of vinyl radical. Additionally, hydrogen abstraction competes directly with β-scission to form odd-numbered carbon species, providing control over the product selectivity profile as well (Fig. 9).
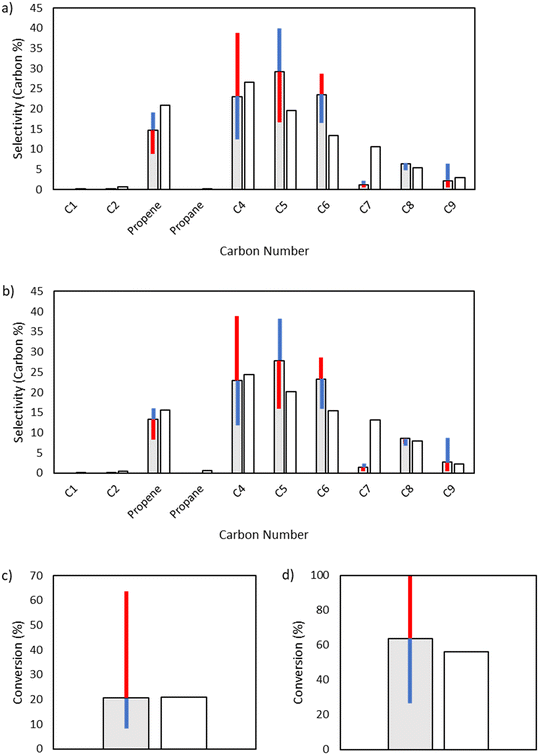 |
| | Fig. 9 Sensitivity analysis of the impact of varying the base activation energy of hydrogen abstraction reactions by ±1 kcal mol−1. The shaded bars are the model results based on the optimized parameters in Table 2, and the sensitivity to changes in the activation energy is denoted by colored error bars. The non-shaded bars depict the experimental results. The blue error bar indicates the change resulting from increasing the base activation energy by 1 kcal mol−1, whereas the red error bar indicates the change resulting from decreasing the base activation energy by 1 kcal mol−1. a) Product selectivities at a total pressure 15 bar. b) Product selectivities at a total pressure 25 bar. c) Ethylene conversion at a total pressure 15 bar. d) Ethylene conversion at a total pressure 25 bar. | |
1,4-Hydrogen shift.
Both octyl and octenyl radicals can participate in 1,4-hydrogen shift reactions and are one of the key enablers of the production of odd-numbered carbon species. As such, they have little influence over C4 and C6, but they have a significant effect on the fate of C8 radical species as well as odd-numbered carbon species (Fig. 10).
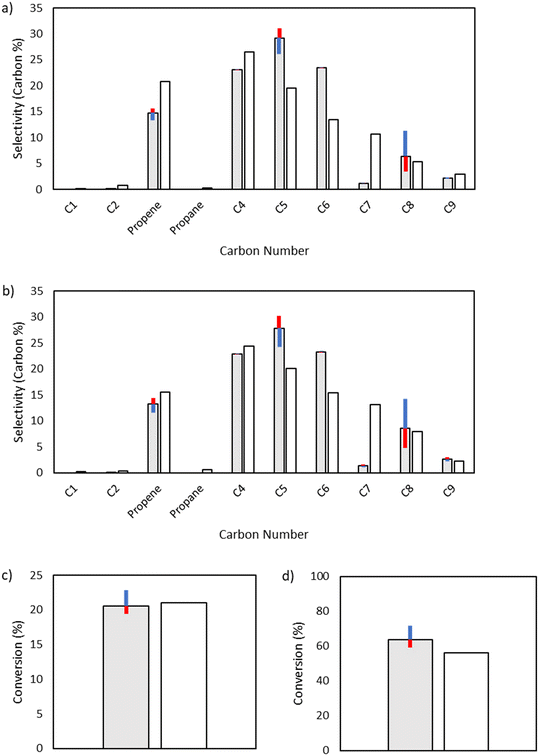 |
| | Fig. 10 Sensitivity analysis of the impact of varying the activation energy of 1,4-hydrogen shift reactions by ±1 kcal mol−1. The shaded bars are the model results based on the optimized parameters in Table 2, and the sensitivity to changes in the activation energy is denoted by colored error bars. The non-shaded bars depict the experimental results. The blue error bar indicates the change resulting from increasing the base activation energy by 1 kcal mol−1, whereas the red error bar indicates the change resulting from decreasing the base activation energy by 1 kcal mol−1. a) Product selectivities at a total pressure 15 bar. b) Product selectivities at a total pressure 25 bar. c) Ethylene conversion at a total pressure 15 bar. d) Ethylene conversion at a total pressure 25 bar. | |
Initiation label 3.
While the initiation reactions do not affect the product distribution, they have significant control over conversion, as expected due to the generation of the vinyl and butyl radicals key to consuming ethylene. From textbook Rice–Herzfeld kinetics, the rate of consumption of the substrate is increased as the rate coefficient for initiation is increased, which is what is observed here; as the activation energy for any of the initiation reactions is decreased, thereby increasing the rate coefficient for initiation, conversion is increased (Fig. 11). Additionally, the Initiation Label 4 reaction drives conversion forward once significant quantities of 1-butene have been produced within the system, which also impacts the formation of vinyl radical through the formation of a resonance-stabilized diradical in the Initiation Label 6 reaction (see ESI†).
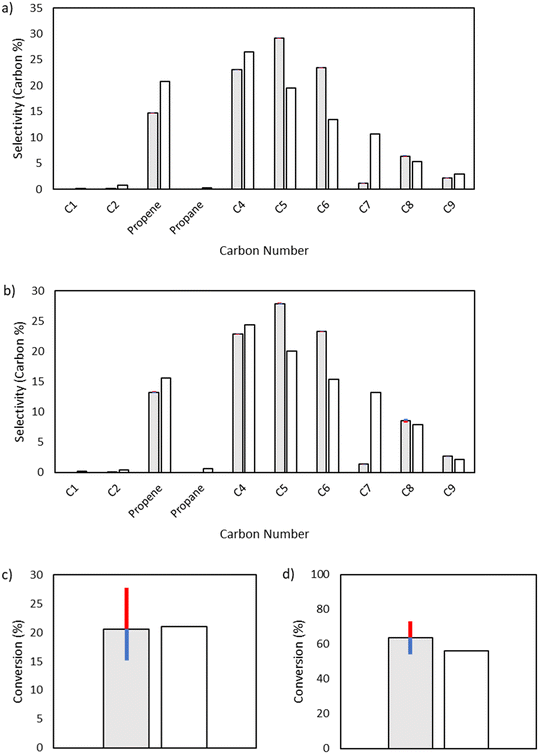 |
| | Fig. 11 Sensitivity analysis of the impact of varying the activation energy of the initiation label 3 reaction, the direct formation of 1,4-butyl diradical from two ethylene molecules, by ±1 kcal mol−1. The shaded bars are the model results based on the optimized parameters in Table 2, and the sensitivity to changes in the activation energy are denoted by colored error bars. The non-shaded bars depict the experimental results. The blue error bar indicates the change resulting from increasing the base activation energy by 1 kcal mol−1, whereas the red error bar indicates the change resulting from decreasing the base activation energy by 1 kcal mol−1. a) Product selectivities at a total pressure 15 bar. b) Product selectivities at a total pressure 25 bar. c) Ethylene conversion at a total pressure 15 bar. d) Ethylene conversion at a total pressure 25 bar. | |
4. Conclusions
In this work, a DFT-parameterized microkinetic model of the thermal oligomerization of ethylene was developed. The odd-numbered carbon species in the product distribution were identified to originate from β-scission of C8 mid-radicals that were created from hydrogen shift reactions. The significant production of linear terminal olefins is driven by consecutive radical addition reactions involving terminal 1-alkenyl radicals and ethylene, balanced by hydrogen abstraction from ethylene due to its high concentration to create the linear alpha olefin products and additional vinyl radicals that can grow again. Flux analysis identified that initiation occurs primarily through hydrogen abstraction by 1,4-butyl diradical at low conversion, and as conversion increases, the primary initiation mode switches to hydrogen abstraction by the butene diradical as 1-butene begins to be produced in significant quantities. The insights from this work can aid in the development of intensified reactor systems for the direct valorization of ethane streams from shale gas production, allowing waste streams to be converted into usable fuel products. Specifically, this work has resulted in a microkinetic model of the transition region between polymerization and thermal cracking at industrially reasonable pressures comprised of a reasonable size to embed directly into process models.
Conflicts of interest
There are no conflicts of interest to declare.
Acknowledgements
This paper is based upon work supported primarily by the National Science Foundation (NSF) under Cooperative Agreement No. EEC-1647722. Any opinions, findings, and conclusions or recommendations expressed in this material are those of the author(s) and do not necessarily reflect the views of the National Science Foundation. This work used Expanse at San Diego Supercomputer Center through allocation CTS120055 from the Advanced Cyberinfrastructure Coordination Ecosystem: Services & Support (ACCESS) program, which is supported by National Science Foundation grants #2138259, #2138286, #2138307, #2137603, and #2138296.
References
-
A. T. Bell, M. M. Alger, M. Flytzani-Stephanopoulos, T. B. Gunnoe, J. A. Lercher, J. Stevens, J. Alper and C. Tran, The Changing Landscape of Hydrocarbon Feedstocks for Chemical Production: Implications for Catalysis: Proceedings of a Workshop, National Academies of Sciences, Engineering, and Medicine, Washington, DC, 2016, DOI:10.2172/1344369.
- A. Gvakharia, E. A. Kort, A. Brandt, J. Peischl, T. B. Ryerson, J. P. Schwarz, M. L. Smith and C. Sweeney, Methane, Black Carbon, and Ethane Emissions from Natural Gas Flares in the Bakken Shale, North Dakota, Environ. Sci. Technol., 2017, 51(9), 5317–5325, DOI:10.1021/acs.est.6b05183.
- L. Höglund-Isaksson, Bottom-up simulations of methane and ethane emissions from global oil and gas systems 1980 to 2012, Environ. Res. Lett., 2017, 12(2), 024007, DOI:10.1088/1748-9326/aa583e.
- T. Ridha, Y. Li, E. Gençer, J. J. Siirola, J. T. Miller, F. H. Ribeiro and R. Agrawal, Valorization of Shale Gas Condensate to Liquid Hydrocarbons through Catalytic Dehydrogenation and Oligomerization, Processes, 2018, 6(9), 139 CrossRef CAS.
- H. Olivier-Bourbigou, P. A. R. Breuil, L. Magna, T. Michel, M. F. Espada Pastor and D. Delcroix, Nickel Catalyzed Olefin Oligomerization and Dimerization, Chem. Rev., 2020, 120(15), 7919–7983, DOI:10.1021/acs.chemrev.0c00076.
- A. Finiels, F. Fajula and V. Hulea, Nickel-based solid catalysts for ethylene oligomerization–a review, Catal. Sci. Technol., 2014, 4(8), 2412–2426 RSC.
- C. D. Chang, The New Zealand Gas-to-Gasoline plant: An engineering tour de force, Catal. Today, 1992, 13(1), 103–111 CrossRef CAS.
- R. J. Quann, L. A. Green, S. A. Tabak and F. J. Krambeck, Chemistry of olefin oligomerization over ZSM-5 catalyst, Ind. Eng. Chem. Res., 1988, 27(4), 565–570 CrossRef CAS.
- W. Garwood, Conversion of C2-C10 olefins to higher olefins over synthetic zeolite ZSM-5, ACS Symp. Ser., 1982, 218, 384–396 Search PubMed.
- E. Freitas and C. R. Gum, Shell's higher olefins process, Chem. Eng. Prog., 1979, 75, 73–76 CAS.
- E. F. Lutz, Shell higher olefins process, J. Chem. Educ., 1986, 63(3), 202, DOI:10.1021/ed063p202.
- A. Galadima and O. Muraza, Revisiting the oxidative coupling of methane to ethylene in the golden period of shale gas: A review, J. Ind. Eng. Chem., 2016, 37, 1–13, DOI:10.1016/j.jiec.2016.03.027.
- M. A. Conrad, A. Shaw, G. Marsden, L. J. Broadbelt and J. T. Miller, Insights into the Chemistry of the Homogeneous Thermal Oligomerization of Ethylene to Liquid-Fuel-Range Hydrocarbons, Ind. Eng. Chem. Res., 2023, 62(5), 2202–2216, DOI:10.1021/acs.iecr.2c02172.
- C. D. Hurd, Pyrolysis of unsaturated hydrocarbons, Ind. Eng. Chem., 1934, 26(1), 50–55 CrossRef CAS.
- M. Boyd, T. Wu and M. Back, Kinetics of the thermal reactions of ethylene. Part I, Can. J. Chem., 1968, 46(14), 2415–2426 CrossRef CAS.
- G. Dahlgren Jr. and J. E. Douglas, Kinetics of the Thermal Reactions of Ethylene, J. Am. Chem. Soc., 1958, 80(19), 5108–5110, DOI:10.1021/ja01552a028.
- M. Boyd and M. Back, Kinetics of the thermal reactions of ethylene. Part II. Ethylene–ethane mixtures, Can. J. Chem., 1968, 46(14), 2427–2433 CrossRef CAS.
- M. Halstead and C. Quinn, Pyrolysis of ethylene, Trans. Faraday Soc., 1968, 64, 103–118 RSC.
- M. Simon and M. Back, Kinetics of the thermal reactions of ethylene, Can. J. Chem., 1969, 47(2), 251–255 CrossRef.
- H. Storch, Kinetics of Ethylene Polymerization. II1, J. Am. Chem. Soc., 1935, 57(12), 2598–2601 CrossRef CAS.
- H. D. Burnham and R. N. Pease, Studies in Gaseous Hydrogenation and Polymerization Reactions1, J. Am. Chem. Soc., 1942, 64(6), 1404–1410 CrossRef CAS.
- M. Buback, The high pressure polymerization of pure ethylene, Makromol. Chem., 1980, 181(2), 373–382 CrossRef CAS.
- M. J. Dewar and S. Kirschner, Dimerization of ethylene to cyclobutane, J. Am. Chem. Soc., 1974, 96(16), 5246–5247 CrossRef CAS.
- W. Tsang, J. A. Walker and J. A. Manion, The decomposition of normal hexyl radicals, Proc. Combust. Inst., 2007, 31(1), 141–148 CrossRef.
- J. Lewis, J. Martin and L. Anderson, Gamma-activation of syntheses--poymerization of ethylene, Chem. Eng. Prog., 1954, 50, 249–255 CAS.
- D. Scelta, M. Ceppatelli and R. Bini, Pressure induced polymerization of fluid ethylene, J. Chem. Phys., 2016, 145(16), 164504 CrossRef PubMed.
- Z. Almisbaa, H. A. Aljama, K. Almajnouni, L. Cavallo and P. Sautet, Acetylene Semi-Hydrogenation on Intermetallic Ni–In Catalysts: Ni Ensemble and Acetylene Coverage Effects from a Theoretical Analysis, ACS Catal., 2023, 13(11), 7358–7370, DOI:10.1021/acscatal.3c01175.
- R. Y. Brogaard, M. Kømurcu, M. M. Dyballa, A. Botan, V. Van Speybroeck, U. Olsbye and K. De Wispelaere, Ethene Dimerization on Zeolite-Hosted Ni Ions: Reversible Mobilization of the Active Site, ACS Catal., 2019, 9(6), 5645–5650, DOI:10.1021/acscatal.9b00721.
- E. Koninckx, R. Gounder, J. W. Thybaut and L. J. Broadbelt, Kinetic Modeling of Ethene Oligomerization on Bifunctional Nickel and Acid β Zeolites, Ind. Eng. Chem. Res., 2022, 61(11), 3860–3876, DOI:10.1021/acs.iecr.1c04105.
- K. Toch, J. W. Thybaut, M. A. Arribas, A. Martínez and G. B. Marin, Steering linear 1-alkene, propene or gasoline yields in ethene oligomerization via the interplay between nickel and acid sites, Chem. Eng. Sci., 2017, 173, 49–59, DOI:10.1016/j.ces.2017.07.025.
- R. Vinu and L. J. Broadbelt, Unraveling Reaction Pathways and Specifying Reaction Kinetics for Complex Systems, Annu. Rev. Chem. Biomol. Eng., 2012, 3(1), 29–54, DOI:10.1146/annurev-chembioeng-062011-081108.
- M. G. Evans and M. Polanyi, Inertia and driving force of chemical reactions, Trans. Faraday Soc., 1938, 34, 11–24, 10.1039/TF9383400011.
- S. W. Benson, F. Cruickshank, D. Golden, G. R. Haugen, H. O'neal, A. Rodgers, R. Shaw and R. Walsh, Additivity rules for the estimation of thermochemical properties, Chem. Rev., 1969, 69(3), 279–324 CrossRef CAS.
- Y. Minenkov, H. Wang, Z. Wang, S. M. Sarathy and L. Cavallo, Heats of Formation of Medium-Sized Organic Compounds from Contemporary Electronic Structure Methods, J. Chem. Theory Comput., 2017, 13(8), 3537–3560, DOI:10.1021/acs.jctc.7b00335.
-
J. W. Moore and R. G. Pearson, Kinetics and Mechanism, Wiley, 1981 Search PubMed.
-
M. Caracotsios, W. E. Stewart and L. Petzold, DDASAC, Double-Precision Differential or Algebraic Sensitivity Analysis, Nuclear Energy Agency of the OECD (NEA), 1997 Search PubMed.
-
M. J. Frisch, G. W. Trucks, H. B. Schlegel, G. E. Scuseria, M. A. Robb, J. R. Cheeseman, G. Scalmani, V. Barone, G. A. Petersson, H. Nakatsuji, X. Li, M. Caricato, A. V. Marenich, J. Bloino, B. G. Janesko, R. Gomperts, B. Mennucci, H. P. Hratchian, J. V. Ortiz, A. F. Izmaylov, J. L. Sonnenberg, D. Williams-Young, F. Ding, F. Lipparini, F. Egidi, J. Goings, B. Peng, A. Petrone, T. Henderson, D. Ranasinghe, V. G. Zakrzewski, J. Gao, N. Rega, G. Zheng, W. Liang, M. Hada, M. Ehara, K. Toyota, R. Fukuda, J. Hasegawa, M. Ishida, T. Nakajima, Y. Honda, O. Kitao, H. Nakai, T. Vreven, K. Throssell, J. A. Montgomery Jr. , J. E. Peralta, F. Ogliaro, M. J. Bearpark, J. J. Heyd, E. N. Brothers, K. N. Kudin, V. N. Staroverov, T. A. Keith, R. Kobayashi, J. Normand, K. Raghavachari, A. P. Rendell, J. C. Burant, S. S. Iyengar, J. Tomasi, M. Cossi, J. M. Millam, M. Klene, C. Adamo, R. Cammi, J. W. Ochterski, R. L. Martin, K. Morokuma, O. Farkas, J. B. Foresman and D. J. Fox, Gaussian 16, Revision C.01, Gaussian Inc., Wallingford CT, 2016 Search PubMed.
- Y. Zhao and D. G. Truhlar, The M06 suite of density functionals for main group thermochemistry, thermochemical kinetics, noncovalent interactions, excited states, and transition elements: two new functionals and systematic testing of four M06-class functionals and 12 other functionals, Theor. Chem. Acc., 2007, 120(1–3), 215–241, DOI:10.1007/s00214-007-0310-x.
- F. Weigend and R. Ahlrichs, Balanced basis sets of split valence, triple zeta valence and quadruple zeta valence quality for H to Rn: Design and assessment of accuracy, Phys. Chem. Chem. Phys., 2005, 7(18), 3297–3305, 10.1039/b508541a.
- S. Grimme, Supramolecular binding thermodynamics by dispersion-corrected density functional theory, Chemistry, 2012, 18(32), 9955–9964, DOI:10.1002/chem.201200497.
- G. Luchini, J. V. Alegre-Requena, I. Funes-Ardoiz and R. S. Paton, GoodVibes: automated thermochemistry for heterogeneous computational chemistry data, F1000Research, 2020, 9 DOI:10.12688/f1000research.22758.1.
- Y.-P. Li, J. Gomes, S. Mallikarjun Sharada, A. T. Bell and M. Head-Gordon, Improved Force-Field Parameters for QM/MM Simulations of the Energies of Adsorption for Molecules in Zeolites and a Free Rotor Correction to the Rigid Rotor Harmonic Oscillator Model for Adsorption Enthalpies, J. Phys. Chem. C, 2015, 119(4), 1840–1850, DOI:10.1021/jp509921r.
-
H. Yu, J. Zheng and D. G. Truhlar, unpublished data, 2015, https://comp.chem.umn.edu/freqscale/version3b2.htm.
- S. E. Levine and L. J. Broadbelt, Detailed mechanistic modeling of high-density polyethylene pyrolysis: Low molecular weight product evolution, Polym. Degrad. Stab., 2009, 94(5), 810–822, DOI:10.1016/j.polymdegradstab.2009.01.031.
- J. Pfaendtner and L. J. Broadbelt, Mechanistic Modeling of Lubricant Degradation. 1. Structure−Reactivity Relationships for Free-Radical Oxidation, Ind. Eng. Chem. Res., 2008, 47(9), 2886–2896, DOI:10.1021/ie0714807.
Footnotes |
| † Electronic supplementary information (ESI) available: Heats of reaction used in Evans–Polanyi correlations for specific reactions and representative reactions for certain reaction families. Labels for the reaction mechanism for ease of reference. Figures plotting ethylene consumption rates. Computer specifications. Results of sensitivity analysis for selected reaction families. See DOI: https://doi.org/10.1039/d3re00347g |
| ‡ Present Address: Shell Technology Center, 3333 S Texas 6, Houston, TX 77082, USA. |
|
| This journal is © The Royal Society of Chemistry 2024 |
Click here to see how this site uses Cookies. View our privacy policy here.  Open Access Article
 b and
Linda J.
Broadbelt
 *a
*a


