Understanding the effects of forced and bubble-induced convection in transport-limited organic electrosynthesis†
Casey K.
Bloomquist
 a,
Melisa
Dogan
a,
James S.
Harris
a,
Benjamin D.
Herzog
b,
William J.
Tenn III
b,
Eray S.
Aydil
a,
Melisa
Dogan
a,
James S.
Harris
a,
Benjamin D.
Herzog
b,
William J.
Tenn III
b,
Eray S.
Aydil
 *a and
Miguel A.
Modestino
 *a
*a
aTandon School of Engineering, Department of Chemical and Biomolecular Engineering, New York University, 6 Metrotech Center, Brooklyn, NY, USA. E-mail: modestino@nyu.edu
bINVISTA, 2760 FM 1006, Orange, TX 77630, USA
First published on 8th January 2024
Abstract
Organic electrosynthesis offers a sustainable path to decarbonize the chemical industry by integrating renewable energy into chemical manufacturing. However, achieving the selectivity and energy efficiency required for industrial applications is challenging due to the inherent mass transport limitations of most electro-organic reactions. Convection can mitigate mass transport limitations, but its impact on organic electrochemical processes remains poorly understood. Here we show that the Sherwood number—the ratio of convective mass transport to diffusive mass transport—is a crucial metric to characterize mass transport, determine reactor performance, and enable effective scale-up. We investigate the interplay between mass transport and electrochemical reaction rates under convective flows in the context of the electrosynthesis of adiponitrile, one of the largest organic electrochemical processes in the industry. We use experiments and data-driven predictive models to demonstrate that forced liquid convection and bubble-induced convection produce nearly equivalent mass transport conditions when the corresponding Sherwood numbers are equal. This conclusion shows that the Sherwood number characterizes the mass transport condition independent of the underlying convection mechanism. Moreover, we show that the faradaic efficiency (i.e., the electrochemical selectivity) scales with the Sherwood number for a given current density and reactant concentration. This scalability enables performance to be predicted irrespective of the convection mode employed to enhance mass transport. Our results provide guidelines for the design and selection of convection methods, from lab to industrial scale, and contribute to the development of more sustainable chemical manufacturing processes.
Introduction
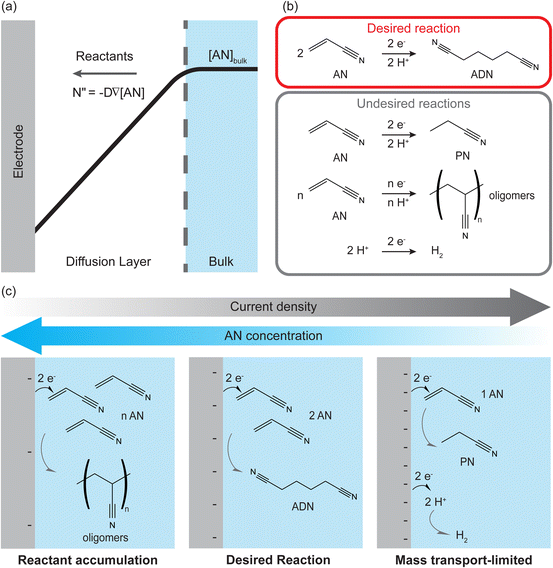
The chemical industry is one of the major sources of energy-derived industrial CO2 emissions because fossil-fuel combustion is widely used to power thermochemical reactions and separation processes. A paradigm shift is needed to transition towards emissions-free chemical production. Electrochemical processes can use electricity from renewable sources to drive reactions and reduce emissions,1,2 but they face challenges with scalability, production rates, and energy efficiency.3,4 Organic electrochemical processes have the potential to decarbonize over 75% of chemical products, but industrial implementation has been limited due to low reactant solubility in aqueous electrolytes and multiple reactant pathways that makes selective production of a desired chemical difficult.5–9 Low solubility leads to mass transport limitations in organic electrosynthesis as slow reactant diffusion rates across boundary layers to the electrode, coupled with the high electrochemical reaction rates required for industrial applications, lower the reactant concentration near the electrode (Fig. 1(a)). This limits the maximum attainable production rates and affects the product distribution. Overcoming this obstacle requires an understanding of the balance between mass transport and electrochemical rates in organic electrochemical systems with low reactant solubility and multiple reactant pathways.Mass transport limitations in electrochemical systems have been studied extensively, commonly using limiting current techniques.10 In limiting-current measurements, current density increases with applied potential when diffusion rates supply reactants to keep up with reaction rates at the electrodes. Eventually, the current density plateaus, reaching the limiting-current, when diffusion of reactants to the surface becomes the rate-limiting factor. These techniques are effective for quantifying mass transport coefficients but only for model reactions with high solubility reactants, well-characterized reaction kinetics, and well-defined reactor geometries and hydrodynamics. However, they have limited effectiveness in studying industrially relevant organic electrochemical processes involving multiple reaction pathways, multiphase electrolytes, and high current densities. In such reactions, where limiting-current measurements are ineffective, the electrochemical selectivity (i.e., faradaic efficiency) can be used to describe the effect of mass transport on the product distribution.
Our group recently investigated the influence of electrochemical and transport processes in one of the largest organic electrosynthesis processes in the industry: the electrohydrodimerization of acrylonitrile (AN) to adiponitrile (ADN).11 The electrochemical reactions of AN in an aqueous electrolyte yield multiple products (as shown in Fig. 1(b)), including hydrogen, propionitrile (PN), ADN, and AN-derived oligomers. The study found that product selectivity (i.e., faradaic efficiency) and production rate are strongly influenced by mass transport, and the results are graphically summarized in Fig. 1(c). At very low current density and high AN concentration, the formation of oligomers and polymers is favored as the diffusion of reactant to the electrode far outstrips the reaction rate. The desired reaction, ADN formation, is favored when there is a balance between diffusion and electrochemical rates at low current densities and moderate AN concentration. As current density increases further, the AN concentration near the electrode decreases, as shown in Fig. 1(a), and the formation of the main side-product, PN, and hydrogen evolution are favored. Here, faradaic efficiency reflects the mass transport conditions and the balance between diffusion and reaction rates. However, ADN production rates increased as a function of total current density, indicating the tradeoff between faradaic efficiency and production rate imposed by mass transport limitations. Herein, we extend this work by investigating how convection can mitigate mass transport limitations.
Forced liquid convection is widely used in industrial processes, including ADN electrosynthesis, to enhance mass transport, reaction selectivity, and production rates.12 However, the effectiveness of forced convection is constrained due to the small interelectrode spacing required for energy-efficient electrochemical reactions. This limitation results in low Reynolds numbers (Re), often leading to laminar flow even with high pumping rates. Turbulence can be achieved at even higher flow rates, but this increases energy demands, requires a reactor design that can handle high-pressure operation, and decreases single-pass conversion. As reported for ADN electrochemical production, static mixing elements can promote turbulence but may lead to drawbacks such as solids buildup and increased pressure drop across the reactor.13,14
Bubble-induced convection provides another approach to mitigating mass transport limitations. Many electrochemical systems involve multiphase (gas/liquid) flows due to the use of gas reactants (e.g., CO2 reduction, alkene oxidation) or from the production of gaseous products (e.g., hydrogen, oxygen, chlorine). Bubbles, either when electrogenerated on a gas-evolving electrode or externally introduced, can enhance mass transport by providing turbulent mixing.15–21 However, bubbles can also negatively affect energy conversion efficiency, blocking catalytic sites and ion-conduction pathways. Understanding this tradeoff is critical to implementing effective bubble-induced convection to enhance the performance of complex electrochemical reactions.22
In this study, we aim to understand the impacts of forced liquid convection and bubble-induced convection on organic electrochemical reactions and to elucidate fundamental relationships between electrochemical rates, mass transport rates, and reaction performance metrics (e.g., selectivity, production rates, and energy efficiency). Our study uses ADN electrosynthesis as a model for complex organic electrochemical reactions, but the methodology and findings can be extended to other reactions. Given that several parameters control the reaction performance, we developed an augmented experimental methodology that leverages pseudorandom sampling techniques and probabilistic regression methods to build high-fidelity surrogate models across a wide range of reaction conditions. We then use these surrogate models to infer general scaling relationships using mass transport correlations that explain the connection between convection conditions and reaction performance for both forced-liquid and bubble-induced convection modes.
Results and discussion
Building data-driven reactor models to study convection effects
The first step in our study was to build predictive surrogate models of the reactor performance under varying mass transport and electrochemical reaction conditions, which are dictated by three parameters: the imposed current density (j), the bulk concentration of reactants ([AN]), and the convection rate—quantified by the superficial liquid velocity (usl) in the case of liquid-forced convection, or the superficial gas velocity (usg) in the case of bubble-induced convection. As discussed above, faradaic efficiency is used as the key metric to assess the mass transport conditions and their effect on the product distribution. In our reactor, cell potential is linked directly to current density, and linear sweep voltammetry (LSV) measurements are shown in the ESI.† Additionally, production rate and energy efficiency will be analyzed and discussed in later sections.Common grid-sampling approaches typically require combinatorically selecting sets of reaction parameters and performing experiments at those conditions. However, achieving complete spatial sampling becomes experimentally unfeasible as the number of parameters increases. In the case of this study, exploring at least 10 different conditions in each of the 3 parameters would have resulted in 1000 experiments required for each of the convection modes and up to 3000 with triplicate measurements to ensure reproducibility—a prohibitively high number of experiments inaccessible by our experimental technique. To overcome this limitation, we designed an experimental methodology that leverages pseudorandom sampling techniques to survey the parameter space and select experimental conditions effectively. Subsequently, we applied probabilistic regression techniques to build surrogate models from the experimental data. With this strategy, we could reduce the number of experiments by an order of magnitude, creating high-fidelity surrogate models with fewer than 100 experiments.
To collect the experimental data and study the interplay between j, [AN], and convective rates (usl or usg), we developed a custom electrochemical flow reactor with well-defined geometry and hydrodynamics, shown in Fig. 2. The reactor consists of a vertical rectangular channel with the working electrode (cadmium) and counter electrode (stainless steel) affixed to opposing sides. The reactor operated in forced convection mode with flow generated by a peristaltic pump at usl from 0.07–5.3 cm s−1 corresponding to Re = 8–600. For bubble-induced convection, a porous frit replaced the solid gasket, and a mass flow controller flowed argon gas into the reactor at usg from 0.013–0.3 cm s−1. The liquid electrolyte flow was kept at 0.13 cm s−1 during the bubble-induced convection experiments to maintain reactant flow into the reactor. Additional reactor details are included in the ESI.† Aqueous electrolytes with 0.1–1.0 M AN flowed through the reactor, and experiments were conducted under constant charge conditions by changing the experiment duration while applying constant DC current. Experiment durations ranged from 4–60 minutes for current densities from 20–300 mA cm−2, yielding theoretical AN conversions under 15%. At these low conversions our experiments approximate pseudo-steady-state conditions. After each experiment, the organic phase was extracted with toluene using liquid–liquid separation and analyzed using gas chromatography-mass spectrometry (GC-MS) to quantify the reaction products and determine the faradaic efficiency (FE) towards each product. Further experimental details and FE calculations are included in the ESI.†
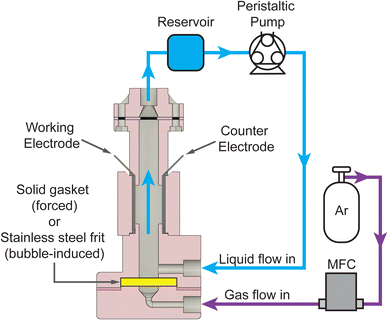 | ||
| Fig. 2 Schematic of the two-electrode reactor configuration used for electrochemical flow reactions. The working electrode (cadmium) and counter electrode (stainless steel) were inserted on either side of a rectangular channel. For forced convection, a solid gasket was used at the bottom of the reactor, and the electrolyte was pumped through the reactor with a peristaltic pump. A stainless steel frit replaced the gasket for the experiments with bubble-induced convection, and argon gas was introduced into the reactor using a mass flow controller (MFC). Additional reactor details are included in the ESI.† | ||
Fig. 3 shows the process for building data-driven surrogate models. To sample the parameter space effectively, we implemented a Latin hypercube sampling (LHS) method, a pseudorandom sampling technique that creates near-random parameter samples to provide variability and even distribution, which has been used in reaction engineering studies.23–27Fig. 3(a) illustrates using LHS to select 50 experimental conditions distributed across each variable's range. In addition to the 50 experimental conditions, we also collected experimental data at boundary conditions on the edges and faces of the hypercube. After we selected the experimental conditions and performed experiments where we characterized the FE towards major products (Fig. 3(b)), we interpolated the experimental data points into a surrogate model that spanned the parameter space using Gaussian process regression (GPR) (Fig. 3(c)), a nonparametric, probabilistic method effective for small datasets.28,29 GPR provides uncertainty on the predicted values (Fig. 3(d)), so we could perform single-run experiments but still obtain information about uncertainty.
Model uncertainty and prediction errors are presented as absolute errors on the FE [%] value. A standard deviation of 5% refers to a variation of 5% faradaic efficiency, not 5% of the measured value. For clarity, changes in FE and errors in FE presented in this way will be followed by “(absolute)”. For our models, the average standard deviation of the FE predictions across the entire parameter space was 9.8% (absolute) for forced convection and 9.3% (absolute) for bubble-induced convection. The root mean squared error (RMSE) of the predictions compared to the experimental data points was ∼5% (absolute) for both convection modes, which matches our experimental uncertainty, which ranged from ∼5–10% (absolute). The data presented in the remainder of this study consists of predicted values based on the GPR regression models built on experimental data at conditions selected by LHS, as detailed above.
Forced and bubble-induced convection effects on electrochemical reactor performance
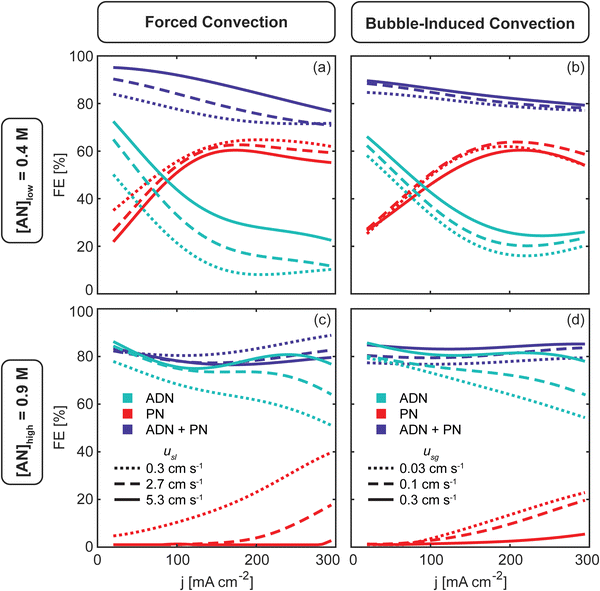
The effects of forced (Fig. 4(a and c)) and bubble-induced (Fig. 4(b and d)) convection on electrochemical production in ADN electrosynthesis are presented together in Fig. 4, though it was not initially obvious that the different convection methods would lead to nearly equivalent trends.At [AN]low = 0.4 M (Fig. 4(a and b)), the reaction is mass transport limited for both convection methods, indicated by low (<60%) FE towards ADN (FEADN) and high (>30%) FE towards PN (FEPN), even at low current density (j < 50 mA cm−2). As j increases and mass transport limitations increase, FEADN decreases while FEPN increases. As j continues to increase, the overall FE towards the measured AN-derived products (FEADN+PN) decreases as the hydrogen evolution reaction (HER) is expected to increase when the interfacial [AN] is low and j is high. While the HER competes with AN reactions and affects FEADN+PN, it may also help to mitigate transport limitations as hydrogen (H2) gas bubbles evolve and induce convection near the electrode. Our results show that FEADN and FEPN plateau when j >150 mA cm−2, possibly due to bubble-induced convection from the increased hydrogen generation rate.
Similar trends are observed but with slight shifts as the respective convection rates are increased by imposing higher electrolyte flow rates (usl) in the case of forced convection and higher gas flow rates (usg) in the case of bubble-induced convection. For forced convection, FEADN increases with usl by 15–25% (absolute) while FEPN decreases by 5–15% (absolute), and FEADN+PN increases in the usl range shown (0.3–5.3 cm s−1). For bubble-induced convection, when usg increases, FEADN increases by 5–10% (absolute) as FEPN decreases slightly, and FEADN+PN increases in the usl range shown (0.03–0.3 cm s−1). At [AN]low, we observe that both convection methods do not completely overcome the mass transport limitations, particularly at high j, but convection does increase the selectivity of ADN with respect to PN by increasing the AN concentration at the electrode-electrolyte interface.
Convection has a more pronounced effect on ADN production at [AN]high (Fig. 4(c and d)), where the mass transport limitation is weaker. When convection rates are low, FEADN decreases with increasing current density as PN formation becomes favorable at high j for both convection methods. As the convection rates increase, FEADN and FEADN+PN increase while FEPN decreases. For forced convection (Fig. 4(c)), PN formation is completely suppressed at high usl, and FEADN increases by 20–30% (absolute) at high j (200–300 mA cm−2). At the highest usl shown, FEADN remains close to 80% for all j, suggesting that the increased forced convection has overcome the mass transport limitations. It is worth noting that AN-derived oligomers and side products not quantified in this study can be formed at high [AN], and their formation may partly be responsible for the decrease in FEADN+PN when usl is increased. Similarly, for bubble-induced convection (Fig. 4(d)), the increased convection (usg >0.3 cm s−1) suppresses PN formation and enhances ADN formation, keeping FEPN near zero and increasing FEADN by 17–24% (absolute) at high j (>200 mA cm−2). Above usl = 0.3 cm s−1, FEADN remains close to 80% for all j.
Using scaling relationships to understand the effects of convection on electrochemical performance
Our findings demonstrate that forced and bubble-induced convection have similar effects on ADN electrosynthesis performance, suggesting that equivalent AN transport rates and local microenvironments at the electrode/electrolyte interface are achieved with both convection modes. This happens even though the superficial gas velocities used to produce bubble-induced turbulence are significantly lower than the superficial liquid velocities used to produce laminar flows with forced convection. To directly compare forced convection and bubble-induced convection, we estimated the Sherwood number (Sh) for each convection condition and developed scaling relationships between convection rates and electrochemical performance. Sh is a dimensionless number that characterizes the ratio between mass transport due to convection and diffusion, defined as, | (1) |
For forced convection, Shforced was calculated using a correlation developed for flows in rectangular channels formed by electrodes on opposing walls,10,30
 | (2) |
 | (3) |
 | (4) |
For bubble-induced convection, Shbubble can be calculated from an empirical mass transfer correlation under turbulent multiphase gas/liquid flows,19
 | (5) |
 | (6) |
 | (7) |
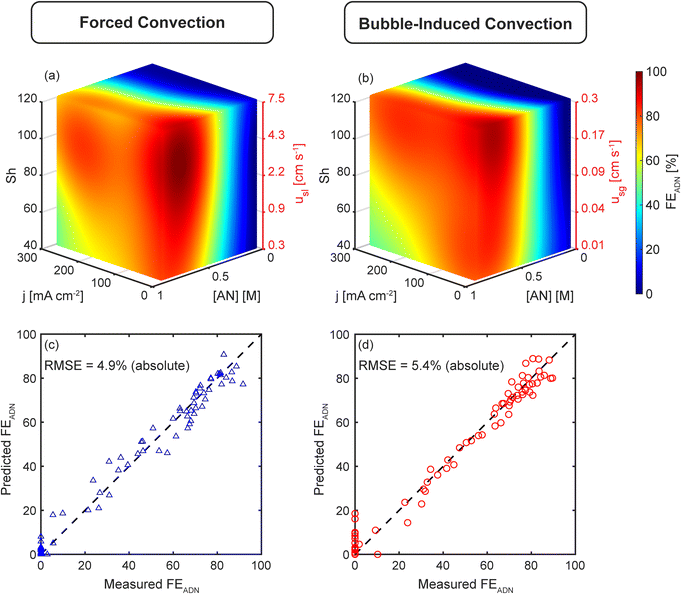
Using these correlations, we calculate Shforced and Shbubble, and build surrogate models using the Sherwood number instead of superficial liquid and gas velocities as the variables that quantify the strength of convection. Fig. 5(a and b) shows the FEADN prediction model for forced and bubble-induced convection as a function of j, [AN], and Sh. The associated superficial velocity (usl or usg) is also shown, highlighting the large difference between the gas and liquid superficial velocities required to achieve the same Sh for the different convection modes. The models demonstrate the expected trends in transport-limited electrochemical reactions. First, there is an increase in FEADN with increasing [AN] for all j and Sh, as higher [AN] mitigates mass transport limitations by increasing the diffusive flux to the electrode surface. Second, FEADN decreases with increasing j as the electrochemical consumption dominates, and the reaction becomes increasingly mass transport limited. In this reaction, the side reactions (particularly PN and HER) increase as j increases, contributing to the decrease in FEADN. Finally, FEADN increases with increasing Sh as mass transport is improved through convection.
Both models demonstrate excellent accuracy when comparing the predicted and experimentally measured FEADN values, shown in Fig. 5(c and d). The RMSE between predicted and measured FEADN is 4.9% (absolute) for forced convection and 5.4% (absolute) for bubble-induced convection. Further, when FEADN is plotted using the Sh, the two models are quantitatively equivalent with an RMSE between the models of 4.75% (absolute), commensurate with experimental errors.
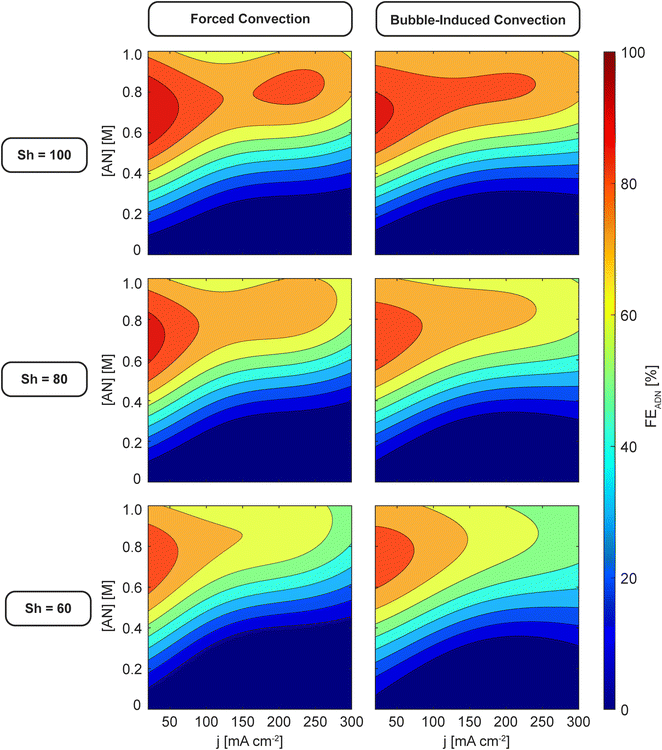
Finally, Fig. 6 shows 2D slices of the 3D maps at three values of Sh and further demonstrates the similar effect that the different convection modes have on reactor performance at the same Sh. Notably, FEADN at high j and high [AN] increases from ∼50% to ∼70% when Sh is increased from 60 to 100, and both convection modes exhibit a maximum FEADN at low j (20–30 mA cm−2), moderate [AN] (0.6–0.8 M), and large Sh (>100).
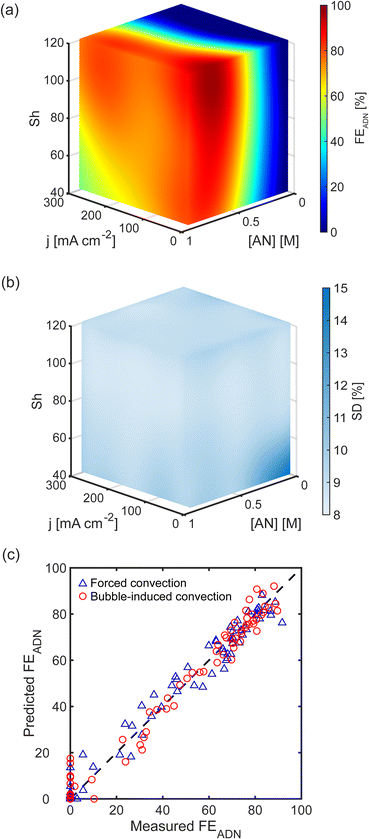
Discovering that the Sherwood number is a convection figure of merit that consolidated the experimental results of both forced and bubble-induced convection experiments suggested that a unified surrogate model can be constructed in which Sh, j, and [AN] are the independent variables. We built such a unified model for ADN electrosynthesis by combining data from forced and bubble-induced convection experiments, and the predictions of this model are shown in Fig. 7(a). FEADN scales with Sh for a given [AN] and j, independent of the convection mode. Fig. 7(b) shows the standard deviation of the predictions across the parameter space for the unified model. The standard deviation is nearly uniform, with an average standard deviation of 9.3% (absolute), indicating a robust model. There is an increase in the standard deviation at low j, [AN], and Sh, where FEADN is expected to be below 20%. However, this is likely due to measurement uncertainty at low FEADN (<20%), where the ADN concentration is near the detection limit of the GC-MS. Notably, the model performs particularly well in the high j and [AN] conditions relevant to industrial applications. We also evaluated the unified model by comparing experimentally measured and predicted FEADN, shown in Fig. 7(c). The predictions agree well with the experimental values, with an RMSE of 5.2% (absolute).
Implications for electrochemical performance
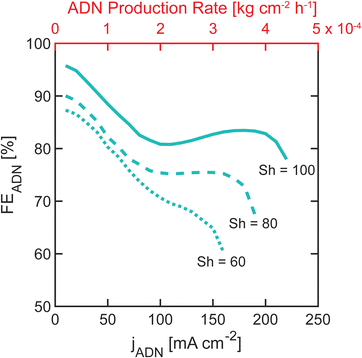
The industrial viability of organic electrochemical processes depends on a balance between FE and production rates or partial ADN current densities, jADN. Practical electrochemical devices must operate under conditions that achieve optimal tradeoffs between these competing metrics. To understand the optimal tradeoffs for flow ADN electrosynthesis devices, we implemented a Pareto analysis, where we identified optimal achievable combinations of FE and ADN production rate at several values of Sh. The Pareto fronts shown in Fig. 8 represent the maximum FE that can be obtained at a given production rate. These fronts can be used to guide the operation of the device and demonstrate that increasing Sh numbers can lead to higher device performance, underscoring the need to mitigate mass transport limitations. The effect of Sh is smaller at low jADN (<100 mA cm−2) where mass transport is not limiting. As jADN increases (>100 mA cm−2) and mass transport becomes limiting, increasing Sh dramatically improves the maximum FEADN at high production rates. For example, when Sh = 60, FEADN >80% at jADN <50 mA cm−2. However, when the convection conditions are increased to Sh = 100, FEADN >80% can be achieved at jADN up to 200 mA cm−2, increasing production rates by more than four times.In addition to high production rates and FE, industrial manufacturing requires high energy efficiency. Our analysis demonstrates multiple ways to achieve the same Sh and, consequently, the same production rates and FEs. Convection modes and reactor designs that achieve the highest Sh with the least energy should be favored. For instance, in our reactor geometry, reaching Sh = 100 through forced convection requires more than five times the energy than through bubble-induced convection (energy estimations are detailed in the ESI†). Achieving a particular Sh number ultimately depends on the technical complexity and energy demands inherent in the reactor design and reaction characteristics. Various reactor geometries and operating conditions will follow distinct Sh number dependencies, resulting in different energy requirements. Notably, bubble-induced convection can introduce complexities in practical systems, particularly when dealing with reactions involving gaseous products. In such cases, separation of products and recompression of gases would be necessary. Additionally, the choice of alternative flow geometries, such as horizontal or serpentine designs, may favor forced convection over bubble-induced convection, as the flow direction may be orthogonal or opposite to the natural trajectory of the bubbles, resulting in different mass transport effects.
Conclusions
In this study, we investigated the impact of forced and bubble-induced convection on mass transport limitations in organic electrochemical reactions and explored extensively the effects of reaction conditions (i.e., j, [AN], and convective conditions), enabled by developing predictive surrogate models that unveiled quantitative relationships between these conditions and the reaction performance. The results demonstrate that both forced liquid convection and bubble-induced convection can produce quantifiably similar mass transport conditions, with equivalent Sh, and consequently control the microenvironment composition at the electrode/electrolyte interface that ultimately dictates performance metrics. Furthermore, we demonstrated that FEADN scales with Sh, j, and [AN], regardless of convection mode. This fundamental insight can be broadly implemented in electrochemical ADN process design, scale-up, and operation. While our study used ADN electrosynthesis as a model reaction, the results are relevant for other mass transport-limited electrochemical reactions. We highlight the important role that convective transport plays in controlling performance in electrochemistry, which underscores the importance of characterizing Sh numbers to understand the interplay between transport, electrolyte, and catalytic properties affecting the reaction. Developing organic electrochemical reactions for industrial applications involves optimizing the faradaic efficiency, production rate, and energy efficiency, and these performance metrics can all be improved by increasing Sh numbers. Therefore, optimal energy efficiency and performance can be achieved by minimizing the energy required to attain a particular Sh number. Due to the unique characteristics of different organic electrochemical reactions and reactor geometries, different convection modes may provide energy and operational advantages. However, the findings presented in this study provide guidelines to allow for a nuanced selection of convection mode based on the specific demands of a given process, contributing to the development of scalable organic electrochemical processes that can help decarbonize chemical production.Author contributions
Casey K. Bloomquist: conceptualization, formal analysis, investigation, methodology, software, visualization, writing – original draft; Melisa Dogan: investigation; James S. Harris: investigation; Benjamin D. Herzog: conceptualization, funding acquisition; William J. Tenn III: conceptualization, funding acquisition; Eray S. Aydil: conceptualization, funding acquisition, methodology, project administration, supervision, writing – review & editing; Miguel A. Modestino: conceptualization, funding acquisition, methodology, project administration, supervision, writing – review & editing.Conflicts of interest
MAM is a co-founder and has a financial interest in Sunthetics, Inc., a start-up company in the machine learning optimization space.Acknowledgements
We thank INVISTA, NYU Tandon School of Engineering, and the National Science Foundation for their generous financial support. This material is based upon work supported by the National Science Foundation under grant no. 1943972. Helpful discussions with Sudhir N. V. K. Aki are acknowledged. We also thank Benjamin Leong for assistance with the initial experiments.Notes and references
- D. S. Mallapragada, Y. Dvorkin, M. A. Modestino, D. V. Esposito, W. A. Smith, B.-M. Hodge, M. P. Harold, V. M. Donnelly, A. Nuz, C. K. Bloomquist, K. Baker, L. C. Grabow, Y. Yan, N. N. Rajput, R. L. Hartman, E. J. Biddinger, E. S. Aydil and A. D. Taylor, Joule, 2023, 7, 23–41 CrossRef CAS.
- G. G. Botte, Electrochem. Soc. Interface, 2014, 23, 49 CrossRef.
- Z. J. Schiffer and K. Manthiram, Joule, 2017, 1, 10–14 CrossRef.
- P. De Luna, C. Hahn, D. Higgins, S. A. Jaffer, T. F. Jaramillo and E. H. Sargent, Science, 2019, 364, eaav3506 CrossRef CAS.
- D. S. P. Cardoso, B. Šljukić, D. M. F. Santos and C. A. C. Sequeira, Org. Process Res. Dev., 2017, 21, 1213–1226 CrossRef CAS.
- M. Yan, Y. Kawamata and P. S. Baran, Chem. Rev., 2017, 117, 13230–13319 CrossRef CAS PubMed.
- D. E. Blanco and M. A. Modestino, Trends Chem., 2019, 1, 8–10 CrossRef CAS.
- E. J. Biddinger and M. A. Modestino, Electrochem. Soc. Interface, 2020, 29, 43 CrossRef CAS.
- R. Mathison, A. L. R. Figueroa, C. Bloomquist and M. A. Modestino, Annu. Rev. Chem. Biomol. Eng., 2023, 14, 85–108 CrossRef CAS.
- J. R. Selman and C. W. Tobias, in Advances in Chemical Engineering Volume 10, 1978, pp. 211–318 Search PubMed.
- D. E. Blanco, A. Z. Dookhith and M. A. Modestino, React. Chem. Eng., 2019, 4, 8–16 RSC.
- T. Noël, Y. Cao and G. Laudadio, Acc. Chem. Res., 2019, 52, 2858–2869 CrossRef.
- F. B. Leitz and L. Marinčić, J. Appl. Electrochem., 1977, 7, 473–484 CrossRef CAS.
- D. E. Danly, J. Electrochem. Soc., 1984, 131, 435C CrossRef.
- D. J. Economou and R. C. Alkire, J. Electrochem. Soc., 1985, 132, 601 CrossRef CAS.
- O. N. Cavatorta and U. Böhm, J. Appl. Electrochem., 1987, 17, 340–346 CrossRef CAS.
- S. Piovano, O. N. Cavatorta and U. Böhm, J. Appl. Electrochem., 1988, 18, 128–133 CrossRef CAS.
- L. J. J. Janssen, J. Appl. Electrochem., 1987, 17, 1177–1189 CrossRef CAS.
- A. Shah and J. Jorne, J. Electrochem. Soc., 1989, 136, 144 CrossRef CAS.
- A. Shah and J. Jorne, J. Electrochem. Soc., 1989, 136, 153 CrossRef CAS.
- J. K. Novev and R. G. Compton, Curr. Opin. Electrochem., 2018, 7, 118–129 CrossRef CAS.
- A. Angulo, P. van der Linde, H. Gardeniers, M. Modestino and D. Fernández Rivas, Joule, 2020, 4, 555–579 CrossRef CAS.
- M. D. McKay, R. J. Beckman and W. J. Conover, Technometrics, 1979, 21, 239–245 Search PubMed.
- R. L. Iman and W. J. Conover, Communications in Statistics - Simulation and Computation, 1982, 11, 311–334 CrossRef.
- B. A. Rizkin, A. S. Shkolnik, N. J. Ferraro and R. L. Hartman, Nat. Mach. Intell., 2020, 2, 200–209 CrossRef.
- D. McIntyre, A. Lashkaripour, P. Fordyce and D. Densmore, Lab Chip, 2022, 22, 2925–2937 RSC.
- K. E. Konan, A. Senthil Vel, A. Abollé, D. Cortés-Borda and F.-X. Felpin, React. Chem. Eng., 2023, 8, 2446–2454 RSC.
- D. Frey, K. C. Neyerlin and M. A. Modestino, React. Chem. Eng., 2023, 8, 323–331 RSC.
- D. Frey, J. H. Shin, A. Akin, X. Zhang and M. A. Modestino, AIChE J., 2022, 68, e17930 CrossRef CAS.
- D. J. Pickett and B. R. Stanmore, J. Appl. Electrochem., 1972, 2, 151–156 CrossRef CAS.
Footnote |
| † Electronic supplementary information (ESI) available. See DOI: https://doi.org/10.1039/d3re00579h |
| This journal is © The Royal Society of Chemistry 2024 |

