 Open Access Article
Creative Commons Attribution 3.0 Unported Licence
Hydrothermal liquefaction integrated with wastewater treatment plants – life cycle assessment and technoeconomic analysis of process system options†
Paraskevi
Karka
 *ab,
Ib
Johannsen
c and
Stavros
Papadokonstantakis
d
aDepartment of Space, Earth and Environment, Division of Energy Technology, Chalmers University of Technology, Hörsalsvägen 7B, 41296 Gothenburg, Sweden
bEngineering and Technology Institute Groningen (ENTEG), University of Groningen, Nijenborgh 3, Groningen, 9747 AG, The Netherlands. E-mail: p.karka@rug.nl
cAarhus University, Department of Biological and Chemical Engineering, Hangøvej 2, 8200 Aarhus C, Denmark
dInstitute of Chemical, Environmental and Bioscience Engineering, Vienna University of Technology (TU Wien), Getreidemarkt 9/166, 1060 Vienna, Austria
First published on 17th May 2024
Abstract
The purpose of this study is the formulation of various scenarios based on two different conceptual design configurations for a sewage sludge-to-fuel pathway via HTL, co-located with a wastewater treatment plant (WWTP), and biocrude upgrading. The first concept refers to decentralized HTL plants assessed for three scenarios of different aqueous phase treatment technologies, coupled with two scenarios of technologies for hydrogen production and a centralized biocrude upgrading plant for diesel and gasoline production. The second concept refers to a decentralized HTL plant followed by a first step of hydrodeoxygenation to stabilize and transfer the treated biocrudes in a central oil refinery for further treatment (e.g., at the FCC cracking units). All cases are assessed with respect to their environmental impacts and their economic profile using the Life Cycle Assessment (LCA) methodology and technoeconomic analysis (TEA). The impact assessment was based on the eighteen mid- and the three endpoint categories of the ReCiPe method. The Global Warming Potential metric ranges between 0.3 and 2.5 kg CO2-eq. per kg biofuel blend corresponding to GHG emission savings of 35% to 90% compared to fossil diesel. TEA results show production costs of 60–80 € per MW h product. Analysis of results provides background information for design specifications targeting improvement of the environmental and economic performance and, thus, highlighting opportunities for biofuel production and synergies with existing fossil fuel infrastructures.
Introduction
The transport sector is responsible for more than 25% of the EU's greenhouse gas (GHG) emissions and it still remains dependent on oil-derived products for nearly 95% of its final energy consumption.1,2 While light duty vehicles could benefit from electrification, for aviation, shipping, and long-haul road transportation which are strongly linked to fossil fuels, biofuels can be considered as an alternative promising option for decarbonization of the future energy economy.3 Among the technologies that produce advanced liquid biofuels which are suitable for long-haul applications are gasification, pyrolysis and hydrothermal liquefaction (HTL), the common characteristic of which is the production of intermediate biocrudes needing further upgrading. HTL is a promising thermochemical process that converts biomass into liquid fuels using hot, pressurized water (sub- and supercritical conditions) to break down the solid biopolymeric structures.4 It is advantageous compared to the other thermochemical technologies as it can be applied to a wide range of wet biomass feedstocks (lignocellulosic, algae, sewage sludge) avoiding costly energy requirements for the drying step of the feedstock. It produces four primary products with yields (%wt with respect to dry sewage sludge) as follows: biocrude (72–77%), solid residue (2–3%), aqueous phase (5–12%), and gaseous phase (2–5%).5 Regarding their potential co-processing with petroleum refinery processes, biocrudes are characterized by their high heteroatom content, which makes them immiscible with typical petroleum oils and incompatible for direct mixing.In addition, the high heteroatom content of raw HTL affects the process and catalysts used for denitrogenation/desulfurization and catalytic cracking of petroleum crude oils. For example, nitrogen in biocrude interacts with degradation products and forms solid deposits, whereas sulfur produces SOx and causes air pollution, increased equipment wear and deposit formation.36 A solution to this problem might be a degree of hydrotreatment and especially hydrodeoxygenation (HDO) that improves co-processing performance in FCC and hydrotreating unit miscibility and reduces the negative effects of oxygen species on refinery catalysts. A number of studies with biocrudes from pyrolysis and HTL have shown that HDO improves co-processing performance in FCC and hydrotreating units.35,37
Additionally, the HTL process due to the use of wet feedstocks typically generates more H2O-soluble oxygenates that end up in the aqueous phase compared to other liquefaction techniques that produce higher amounts of light hydrocarbon gases. Thus, the valorization of the aqueous phase organics is interesting although challenging in terms of the recovery of these oxygenates. The properties of the HTL aqueous phase are highly dependent on the type of feedstock and the reaction conditions applied during the HTL reaction.
Sewage sludge treatment is an option for the efficient conversion of the organic fraction into biocrude and subsequently into liquid biofuels.7 From a wider perspective the treatment of sewage sludge stream of a WWTP on a municipality scale is related to costs due to the management and disposal of waste residuals. Therefore, potential options for alternative exploitation and valorization of these streams would be an incentive for reducing sludge management and disposal costs and in parallel producing added-value products such as biofuels via new technologies.
Various studies have investigated environmental and economic dimensions and the technical feasibility of HTL systems, showing a variation of results due to the selection of system boundaries and process specifications. Lozano et al. (2022)7 used technoeconomic analysis and Life Cycle-GHG emission assessment to investigate various system configurations of HTL integrated with WWTP and fossil refineries using the Netherlands as a case study. Nie and Bi (2018)8 focused only on the assessment of Life Cycle-GHG emissions for various process configurations of a hypothetical HTL plant investigating the abundantly available forest residues in British Columbia and Moser et al. (2023)9 in the assessment of the Life Cycle GHG emissions for a future commercial HTL plant in Germany using cattle manure. Other studies focus on testing of feedstock potentials other than sewage sludge, e.g., rice straw10 and the recovery of by- or co-products and further processing of the aqueous stream, for instance with anaerobic digestion or catalytic hydrothermal gasification using technoeconomic and LCA methods.11–13 Other studies such as that of Del Alamo et al. (2023) focus only on technoeconomic analysis of the production of biofuels via HTL.31
The purpose of this study is the formulation and comparison of various scenarios of design configurations based on two different concepts for a sewage sludge-to-fuel pathway via HTL and biocrude upgrading: in the first concept biofuels are produced without integrating HTL in existing oil refinery infrastructures, while the second concept considers the production of hydrodeoxygenated (HDO) biocrude of an appropriate quality for mixing in an oil refinery.
The analysis is based on primary information found in flowsheet models obtained from the literature15 for biofuel production from sewage sludge via HTL and builds a background of a set of alternative scenarios referring to the two concepts investigating the treatment of the aqueous phase of HTL (e.g., using anaerobic digestion for treatment of the aqueous phase),12 opportunities for on-site bioenergy production or synergies with existing fossil fuel infrastructures. The analyzed alternative technologies also refer to hydrogen production with electrolysis instead of steam reforming of natural gas considering various options for electricity mix. In addition, the case of HTL biocrude production using only a “green” electricity mix instead of natural gas for the heating needs is also investigated.32–34
The comparison of the respective scenarios is performed using cradle-to-gate life cycle assessment (LCA) for the eighteen environmental metrics on the midpoint level and the three endpoint metrics of the ReCiPe 2016 V1.07 hierarchist perspective method14 and cradle to grave impact assessment for the LCA-GWP savings. A technoeconomic analysis including operating (OPEX), capital investment (CAPEX) and total production costs is also provided based on reference values found in the literature15 and a sensitivity of the operating costs with respect to the regional variation of the electricity prices is also discussed.
The analysis and the results of this study provide a first level of information about design specifications (foreground data) and input and output flows that are associated with the background systems of the described scenarios which can be used for the development of prospective LCA studies and technology learning analysis for investigation of the future viability and commercialization opportunities of HTL plants.
Materials and methods
Formulation of scenarios
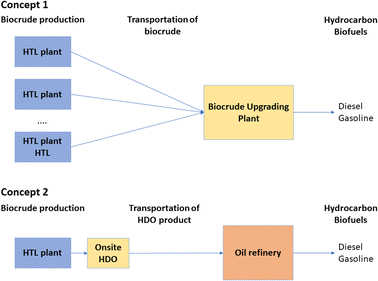
The analysis is developed on two basic concepts for a sewage sludge-to-fuel pathway via HTL, co-located with a WWTP, and biocrude upgrading (Fig. 1). The first concept refers to decentralized HTL plants assessed for three scenarios of different aqueous phase treatment technologies, coupled with two scenarios of technologies for hydrogen production and a centralized biocrude upgrading plant for diesel and gasoline production. The second concept refers to a decentralized HTL plant followed by a first step of hydrodeoxygenation to stabilize and transfer the treated biocrudes in a central oil refinery for further treatment (e.g., at the FCC cracking units).The purpose of this analysis is to highlight ways of production of biofuels by addressing the challenges of biofuel production at large enough scales and economically competitive prices.
Co-processing of biogenic feedstocks with petroleum streams as presented in Concept 2 is an alternative pathway in renewable fuel production by leveraging the existing infrastructures of a refinery. Biocrude upgrading through catalytic hydrotreatment is promising for the conversion of polar compounds into hydrocarbon-rich mixtures with fewer heteroatom-containing species. Various studies have shown that intermediate hydrotreatment can be a promising approach to effectively deoxygenate HTL biocrude to achieve a hydrotreated biocrude compatible for co-processing at a refinery via catalytic hydrodeoxygenation, hydrodesulfurization, and hydrodenitrogenation to remove the high oxygen (5–18 wt%), sulfur (0.5–1.0 wt%), and nitrogen contents (0.3–8 wt%).6
The methodology includes the application of Life Cycle Assessment (LCA) according to ISO 14040 to estimate the environmental impacts and the analysis of CAPEX and OPEX data for both concepts. Primary information of mass and energy balances from simulation results was obtained by the study of Snowden-Swan et al. (2017)15 which was used as a basis for the development of the baseline and the alternative scenarios.
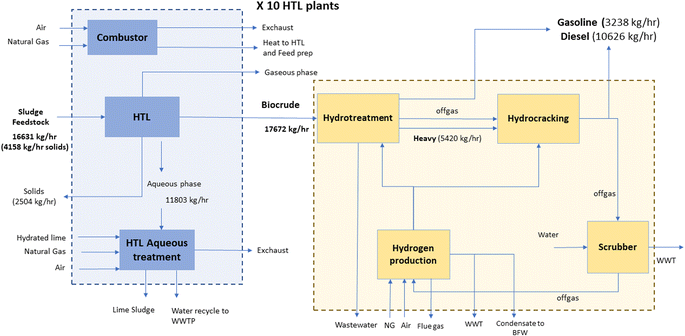
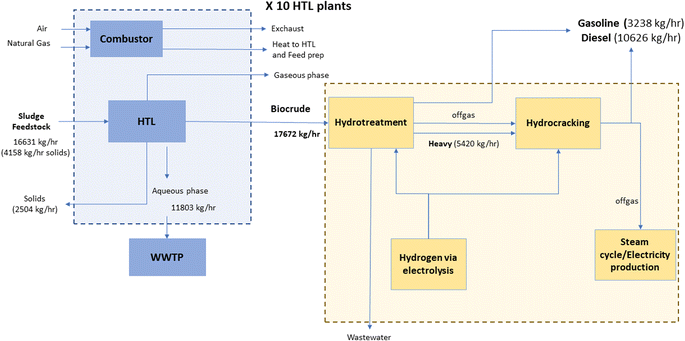
The conceptual representation of the baseline scenario (Scenario 1a of Concept 1) of the HTL plant and biocrude upgrading process that is analysed in the current study is presented in Fig. 2; then the formulation of various alternative scenarios regarding design alternatives is investigated in order to study the sensitivity of the system's performance based on the LCA and economic metrics. The HTL plant is assumed to be fed with sewage sludge by a co-located WWTP or lying within a reasonable radius (e.g., of a few km) so as to be economically feasible for transportation to the HTL plant. The HTL process produces biocrude, a solid stream, a gaseous phase and an aqueous stream that is highly concentrated in nutrients and should be treated before recycling back to the WWTP. The biocrude is then transported to a centralized upgrading plant and it is converted to diesel and naphtha (gasoline blendstock) according to the distillation fractions provided by the flowsheet models in the study of Snowden-Swan (2017). The upgrading plant is assumed to receive biocrude from 10 HTL plants (producing 14 million kg of biocrude each) and produces 109 million kg of fuel. Data of production rates of each HTL plant and for the centralized biocrude upgrading plant are given in Tables 1 and 2.
| Stream | Million kg per year |
|---|---|
| Dry sludge (15% ash) feed | 33.1 |
| Dry, ash-free sludge feed | 28.1 |
| Total slurry feed (25% solids) | 131.7 |
| HTL biocrude product | 14.0 |
| HTL aqueous phase | 93.5 |
| HTL solids (dry) | 19.8 |
| HTL gas phase | 4.4 |
| Stream | Million kg per year |
|---|---|
| Biocrude feed | 140.0 |
| Hydrotreated oil | 110.1 |
| Hydrogen consumption | 7.1 |
| Natural gas in hydrogen production | 9.26 |
| Diesel blendstock | 83.4 |
| Naphtha (gasoline blendstock) | 25.7 |
The HTL system boundaries of Scenario 1a include (i) the HTL reactor and the four-phase separation (organic, aqueous, gas and solids), (ii) the combustor and heat transfer circulation oil, fed by fuel gas (i.e., the gas phase) produced in the HTL and by additional natural gas providing heat back to the HTL, and (iii) the HTL treatment aqueous phase unit. The biocrude upgrading system boundaries include (i) the hydrotreatment upgrading plant leading to a mixture of paraffins, olefins, naphthenes and aromatics that lie within the gasoline, jet and diesel boiling ranges, (ii) the hydrocracking upgrading plant where the heavy cut from the hydrotreater is cracked to produce additional naphtha and diesel range products, (iii) the ammonia scrubber that removes ammonia from the off-gases produced by hydrotreatment and hydrocracking which then enters the hydrogen production unit via steam reforming; (iv) the hydrogen plant based on steam reforming and (v) the steam system that provides steam to the hydrogen production unit and receives recovered heat from steam reforming and from hydrotreatment and hydrocracking and the cooling water system.
The scenarios developed under the two basic concepts are as follows:
Concept 1: decentralized HTL with a centralized biocrude upgrading to diesel and gasoline.
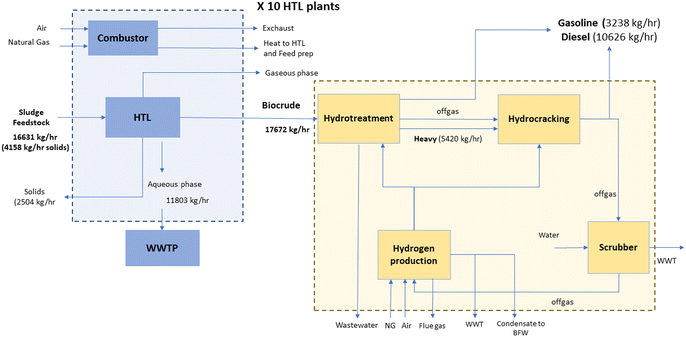
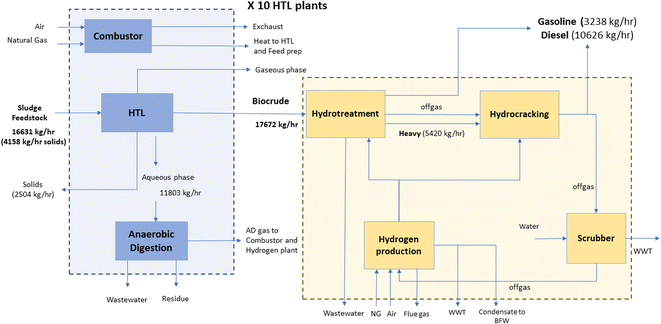
• Scenario 1: hydrogen is produced onsite in the upgrading plant via steam reforming (Fig. 2, 3, and 4). Scenario 1a refers to the treatment of the aqueous phase by an ammonia stripping unit using lime for pretreatment, Scenario 1b refers to the direct recycling of the aqueous phase to the WWTP without on-site treatment. Scenario 1c refers to the treatment of the aqueous phase by an Anaerobic Digestion (AD) unit. Thus, Scenario 1a refers to the “worst” case, in terms of costs and environmental impacts, where the composition of the aqueous phase (i.e., mainly its ammonia content) is considered harmful for mixing with other streams in the WWTP without prior treatment, while Scenario 1c refers to the “best” case where on-site energy production and recovery take place.
• Scenario 2: hydrogen is produced through electrolysis using the default (average) European electricity mix according to the Ecoinvent database (Fig. 5) V3.8 (ref. 16) for electric power generation, transmission and distribution. In this scenario it is assumed that hydrogen is produced via a number of small capacity electrolysis plants the total production of which provides the needed hydrogen for hydrotreatment and hydrocracking of the central upgrading plant. The design and sizing of them is not part of the current analysis.
• Scenario 3: hydrogen is produced through electrolysis using a «greener» European electricity mix according to the Ecoinvent database V3.8 (ref. 16) (Fig. 5). Electric power generation, transmission and distribution are defined by the GWP metric, which, according to the ReCiPe method, is lower than the metric of the European electricity. All other design characteristics of Scenario 3 are similar to those of Scenario 2.
• Scenario 4: hydrogen for biocrude upgrading is produced through electrolysis using a «greener» European electricity mix, similar to Scenario 3 (Fig. 5). Heating needs of HTL biocrude production are covered by electricity instead of natural gas which is the case of Scenarios 1, 2 and 3.
Concept 2, Scenario 5: decentralized HTL with a first step of HDO for mixing the treated biocrude in a second step in the oil refinery (Fig. 6).
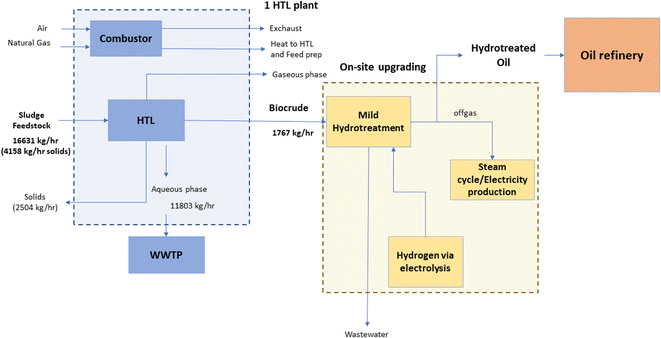 | ||
| Fig. 6 Concept 2, Scenario 5: decentralized biocrude production from 1 HTL plant and an HDO plant. HTL aqueous treatment is based on an average WWTP model and hydrogen production via electrolysis. | ||
The LCA methodology
The environmental impact assessment was implemented by developing the life cycle models of the scenarios in Simapro software Version 9.4.17 Cradle to gate assessment was done for the eighteen midpoint and three endpoint metrics using the ReCiPe 2016 method. Especially, for one of the eighteen midpoint metrics, the GWP metric cradle-to-grave Life Cycle Assessment (LCA) was applied to evaluate the emission savings both from the production and end-use (combustion) stages of fuels compared to the fossil based equivalent (fossil diesel). For the biofuels, the biogenic emissions during biofuel production and end-use in the corresponding engines (e.g., light and heavy duty vehicles, marine and aviation accepting biofuels as drop-in or as pure fuels) are not accounted for, assuming a net zero cycle of biogenic carbon. To compare these values with the fossil-based equivalent fuels and calculate the corresponding environmental impact savings, the emissions of the fossil-based fuels in the corresponding engines are accounted for.The LCA methodological framework is based on the steps of the ISO standard 14040 including the goal and scope definition, the life cycle inventory analysis, the life cycle impact assessment and the interpretation of the results. Although these steps are systematized for the LCA framework, similar steps are followed for the economic assessment.
The goal of the analysis is the environmental impact assessment and technoeconomic analysis of biofuel blends derived by hydrotreated HTL products and their comparison with the respective fossil-based fuels. The scope of the analysis is the investigation of various scenarios based on alternative system configurations of biofuel blends via HTL biocrude production and their upgrading using the LCA methodology and an economic analysis based on capital expenditure (CAPEX) and operating expenditure (OPEX) metrics.
The functional unit is 1 kg of biofuel blend produced from the upgrading stage of HTL that is 1 kg of diesel and gasoline for Concept 1 or hydrotreated bio-oil for Concept 2.
Process input streams (raw materials and chemicals), output streams (main or co-products, byproducts and waste streams) and utility needs (electricity, fuels) were balanced from simulation results.15 Data for upstream process models, which represent processes which are outside of system boundaries (background system) and correspond to flows which supply the study systems with raw materials and energy (e.g., such as electricity generation, natural gas, production of chemicals, etc.) or correspond to the way that waste streams are handled when leaving system boundaries such as average models for wastewater treatment, were obtained from the Ecoinvent Database V3.8 (ref. 16) (Table A15 in the ESI†). In particular, for the case of wastewater treatment of the aqueous phase of the HTL, the air stripping method has been considered as it was part of the baseline case design (Scenario 1a), whereas an average model for treating this stream in a WWTP has also been applied from Ecoinvent database V3.8 in order to provide the option of alternative treatment possibilities. Some HTL plants may be able to recycle the HTL aqueous stream directly back to primary or secondary treatment without pre-treatment. This would represent cases with lower contents of ammonia in the aqueous phase of HTL or regions with less stringent effluent requirements and is used to show how much the contribution to GWP may vary according to the wastewater treatment option. For this reason, another scenario (Scenario 1b) is the replacement of the particular waste treatment technology with a WWTP model provided by the Ecoinvent database that is named “treatment of wastewater, average, capacity 1.1 E10l per year CH”. In addition, all wastewater streams generated by the processes of the scenarios (e.g., wastewater from the AD unit, hydrotreatment, hydrogen production via steam reforming) are assumed to be treated by the same type of treatment facility. In addition, processes for the solid phase disposal have also been obtained from the process inventories provided by the Ecoinvent V3.8.
Regarding Scenario 1c, the model of the aqueous phase treatment via AD has been based on the study of Tews et al. (2014).18
The feedstock stream used in the current study is the sludge coming from primary and secondary treatment of a WWTP. The analysis is based on average performance assuming that there are no significant variations in the quality and properties of the sludge feedstock. The study of Snowden-Swan (2021)23 tests four types of feedstock (50/50 mix of primary/secondary sludge, 100% pure primary sludge, cow manure and biosolids from anaerobic digestion) with respect to wt% biocrude yields showing a range between approx. 31% (for biosolids and cow manure with 6 and 10 wt% oxygen contents respectively) and 44% (for 50/50% mixed feedstock coming from primary/secondary sludge with 5 wt% oxygen content). However, the effect of using different feedstocks is not further investigated in this study.
Given that it is a waste stream and not a marketable product, from LCA perspective the impacts associated with a waste or by-product stream, i.e., with its production from an upstream process, can be assumed equal to zero. The only impact associated with a waste stream in LCA is the treatment method that is selected in order to process it before releasing it to the environment. In the current analysis a waste sludge stream produced from a WWTP would alternatively undergo incineration treatment. This case can be represented by a process model from the Ecoinvent database (“Digester sludge {GLO}| treatment of digester sludge, municipal incineration | APOS, U” model). This model represents an avoided process if we assume system expansion for the WWTP by-products. This process model corresponds, for the GWP metric, to 0.05 kg CO2-eq. per kilogram of treated sludge and from a systems perspective, this impact could be abstracted from the results of the current study if we want to widen system boundaries in our analysis, i.e., including the WWTP in the system. For the current analysis, it is assumed that the mixed sludge is intercepted and mechanically dewatered to the target solid content of 25%. In order to give a more realistic approach and attribute environmental impacts and the cost associated with the supply of feedstock in the HTL process, the use of polymers for dewatering has been taken into account in the analysis corresponding to the LCA impacts for the production of a polymer and the market price of this polymer, respectively.
The interpretation of results is based on the comparison of various scenarios with respect to their performances in the GWP indicator on cradle-to-grave and on 18 mid- and 3 endpoint metrics on cradle-to-gate and the identification of dominant factors for the environmental profile of each scenario.
All assumptions for this LCA study are listed in the ESI† in more detail.
Cost data
The economic information is based on the capital and operating costs provided in the study of Snowden-Swan et al. (2017)15 and it is provided in Tables A7–A14 of the ESI.† For the CAPEX and OPEX values of the equipment and flows that participate in the alternative scenarios, e.g., for the case of electrolysis, CAPEX values were obtained from the literature selecting a type of electrolysis technology such as alkaline electrolysis for the purpose of the current study (Brynolf et al., 2018).19 OPEX values were based on the prices of the report of Snowden-Swan et al. (2017)15 or from other literature sources such as in the case of the wastewater treatment in a WWTP in the case of direct recycling of the aqueous stream (Rerat et al., 2013). The values were adjusted to the year 2018 or scaled to the appropriate capacity if needed (e.g., for the purpose of scaling down hydrotreatment in Concept 2). In order to adjust costs between different currencies that is U.S. $ (2014) to Euro (2014), purchasing power parity (PPP) rates were used.20 For the conversion of CAPEX and OPEX values from a quoted year to a reference year 2018, chemical engineering plant cost index (CEPCI) was used21 and the producer price indices (PPIs) to convert the prices of raw materials and energy streams22 were used, respectively.Results
Life cycle impact assessment
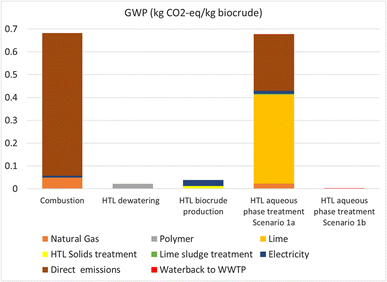
The results of the LCA methodology for the two concepts and their respective scenarios are provided in a decomposed format of the total impacts with respect to their corresponding system boundaries, namely per kg of the main corresponding output (biocrude, hydrotreated biocrude and biofuel blend, respectively). In addition, results for all scenarios are also provided for all the eighteen metrics of the ReCiPe LCIA method and an analysis of the GHG emission savings when fossil-based diesel is replaced by biobased diesel and gasoline using the GWP metric is also provided.The analysis of Scenario 1a shows that the aqueous phase treatment with ammonia stripping makes a significant contribution to the environmental profile of the HTL step as expressed by the GWP LCA metric (Fig. 7). This is mainly (65%) due to lime production used in this step because of the pH adjustment requirement. The pH adjustment is necessary to shift ammonia to the gas phase, which is achieved with the addition of lime with severe greenhouse gas emissions and also results in the generation of lime sludge as a waste. This finding verifies the statement of the study of Snowden-Swan (2021)23 about the impacts of lime. Generally, it is anticipated that effluent limits will become increasingly stringent and nutrient recovery will become more important for WWTPs in the future. For this reason, HTL plants might have to treat this aqueous stream to reduce loads on the plant because the high ammonia content could cause problems at some plants, such as toxicity impacts and/or pass through to the WWTP's discharge to the environment.
All the other unit operations for Scenarios 1a and 1b (i.e., combustion, sludge dewatering and HTL reactor) have the same impacts as shown in Fig. 7.
In addition, the aqueous phase contains high chemical oxygen demand (COD) and significant levels of organics are removed along with ammonia in the air stripping process, which leads to an impure ammonia stream and the stripped ammonia and organics must be destroyed in a thermal oxidation unit, which requires natural gas for heat and represents wasted carbon and nitrogen. And lastly, significant COD remains in the aqueous phase after stripping, which could potentially impact the WWTP's biological operations, depending on the compounds still remaining. These points indicate that other options such as thermochemical or biological can be investigated regarding their environmental performance and economic profitability.
The aqueous phase, alternatively, can be treated in an anaerobic digestion (AD) reactor (Scenario 1c) according to the study of Tews et al. (2014),18 the gas product of which is sent to the hydrogen plant where it is used as feedstock to the steam reforming unit as well as fuel gas for the combustor of the HTL unit. Conversion factors of the organic content of the aqueous phase (25% of the inlet aqueous phase to the AD unit) towards gas (23%), wastewater treatment (76%, which is assumed to be sent to a central WWTP) and AD residue (1%, which is assumed to be directed to landfilling) have been obtained from the same study. The gas product includes mainly carbon dioxide (CO2), methane (CH4), and small quantities of hydrogen (H2) and other light hydrocarbon gases (ethane, propane, butane). Given that the AD gas product is used in the hydrogen plant it is assumed that the upgrading plant is close to the HTL units, in contrast to the Scenarios 1a and 1b where the connection between the biocrude production and the upgrading step is achieved via transportation (however, transportation impacts are not included in the study).
Other proposed technologies according to the study of Snowden-Swan (2021)23 (i.e., catalytic hydrothermal gasification, steam phase-catalytic reduction of wastewater and aqueous phase catalytic upgrading) are out of scope for this study as they require more detailed design based on the specifications of the waste stream composition.
Scenarios 2 and 3 refer to the replacement of steam reforming for hydrogen production by electrolysis. Hydrogen production based on renewable sources can be achieved by electrolysis using the sodium chloride cycle via the membrane cell, diaphragm cell and mercury cell using wind and solar energy. From the perspective of sustainability, the comparison of steam reforming based H2 production versus various other technologies based on electrolysis coupled with renewable electricity production, has been presented in the literature such as in the study of Suleman et al. (2016).24 Scenario 4 also refers to the case of hydrogen production for biocrude upgrading via electrolysis considering that heating needs are covered exclusively by electricity in the biocrude production process.
In the current analysis, the model for electricity production based on electrolysis is obtained using the Ecoinvent database. The process “Hydrogen, liquid {RER} | chlor-alkali electrolysis, diaphragm cell | APOS, U” was used as a representative dataset which refers to the main process that produces chlorine and sodium hydroxide by chloralkali electrolysis using a diaphragm cell. The consumed electricity to produce 1 kg of liquid hydrogen is 22 kW h referring to the medium voltage and to the average electricity mix of Europe (Scenario 2) whereas Scenario 3 and Scenario 4 refer to electrolysis using a “greener” electricity mix such as those of Denmark that is characterized by lower impacts in terms of the GWP metric. The value of electricity consumption is the result of allocation of the multi-output process producing chlorine, hydrogen, and sodium hydroxide. CAPEX values for electrolysis were obtained from the study of Brynolf et al. (2018),19 where, for the case of the alkali process, cost data for the selected process obtained from the Ecoinvent database were not available.
More specifically, in terms of environmental impacts the production of hydrogen corresponds to 12.5 kg CO2-eq. per kg of hydrogen of which 8.9 kg CO2-eq. corresponds to the life cycle impacts for the electricity production if an average electricity mix is used whereas the contribution in the case of the Danish electricity mix is approximately 5.3 kg CO2-eq.
Retrofitting of the baseline system for the purpose of scenario formulation considers the replacement of the steam reforming unit, which uses process off-gas from hydrotreatment and hydrocracking and additionally purchased natural gas from hydrogen production based on electrolysis. Thus, the off-gas is assumed to be directed to combustion which then provides heat to the steam cycle that now stops receiving heat from the hydrogen plant (steam reforming). In addition, in the baseline scenario steam reforming via heat recovery produced steam that was used for the needs of the reaction and electricity. For the purpose of the current analysis it is assumed that the steam cycle is redesigned so as to produce only electricity from the combustion of the off-gases.
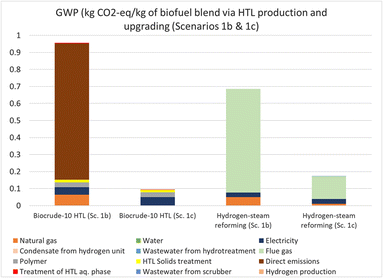
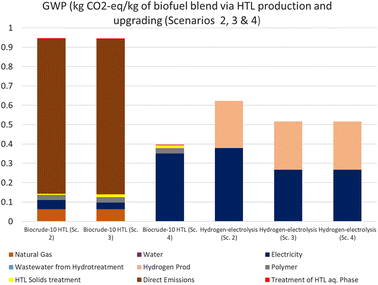
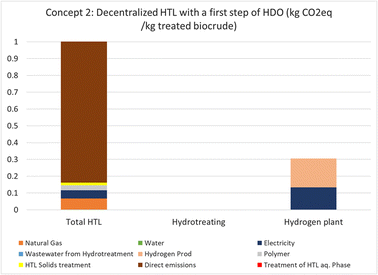
Fig. 8 and 9 present the total impacts of the whole system of HTL production and upgrading according to Scenarios 1, 2, 3 and 4. The analysis shows that hydrogen production via steam reforming in Scenario 1b (Fig. 8) has higher impacts compared to electrolysis for Scenarios 2, 3 and 4 as shown in Fig. 9. This high value is mainly dependent on the contribution of direct impacts of flue gases produced from steam reforming which are mainly fossil based due to the use of natural gas. The total indirect impacts of steam reforming consisting of electricity production and natural gas supply in the biocrude upgrading plant are lower compared to the indirect impacts due to the electricity production of Scenarios 2, 3 and 4 for electrolysis. An even “greener” or 100% renewable electricity mix may lower the impact on climate change, accordingly, making hydrogen production via electrolysis a more environmentally profitable option. Of course, this indirect contribution of electricity mix indicates the importance of locating this HTL based technologies or at least the biocrude upgrading technologies to regions with a “greener” electricity mix. In addition, if an additional potential of heat integration could exist, this would reduce and eliminate heat demand in the HTL plant and therefore the use of natural gas.
A decomposition of impacts for the case of HTL production and upgrading for Scenario 1c is also presented in Fig. 8. A remarkable reduction of impacts compared to the other Scenarios is due to the on-site use of natural gas produced via the AD unit and used in steam reforming and combustor, whereas the respective CO2 emissions of these operation units are biogenic and therefore do not count in the assessment of the GWP metric.
This configuration is based on the same design for the HTL based biocrude whereas the upgrading step includes a hydrotreatment (HDO) step without hydrocracking and hydrogen produced by electrolysis. In this case the HTL part remains the same as that of Scenario 1b. Regarding the upgrading step, the hydrotreatment unit should be designed in order to cover the appropriate degree of deoxygenation and denitrification whereas the electrolysis should also be adjusted to the appropriate capacity. The oil yield of the hydrotreatment step is based on the study of Heider et al. 2020 (ref. 25) where it was presented that it is dependent on the temperature of the hydrogenation reaction and experimental results of one and two stage hydrogenation reactions for spirulina and sewage sludge types of feedstock.25
In particular, Concept 2 is based on the following assumptions:
Untreated bio-crude production costs remain the same.
The quantity of hydrogen consumed for the HDO is based on the findings of the study of Heider et al. 2020,25 where a two-stage batch hydrotreatment was adopted. This approach consists of performing a mild hydrotreatment (in 310 °C, 330 °C and 350 °C) batch experiment (first stage), collecting the produced upgraded oil (excluding the water-phase) and using it for a subsequent severe hydrotreatment experiment at 400 °C (second stage). The overall H2 consumption after the second stage was estimated to be 35–37 gr H2 per kg of untreated biocrude leading to a final 85–100% deoxygenation and 75–92% denitrification level.
For the current analysis the yield was selected equal to 70% for the 1767 kg of untreated bio-crude based on findings of the study of Haider et al. (2020)25 on the oil yield ranging between 65% and 73% for two stage hydrotreatment and temperatures varying between 310 °C and 350 °C for the first stage and a temperature of 400 °C for the 2nd stage.
Capital cost for alkaline electrolysis is in the range of 1100 (600–2600) (€ 2015 per kW of electricity consumed).19
In this concept we assume that there is no stream reforming unit that would fit the purpose of smaller decentralized biocrude upgrading plants. Therefore, all relevant streams associated with this unit are omitted from Concept 2.
The ReCiPe 2016 V1.07 method/hierarchist perspective at the midpoint level was applied to assess a wide range of impacts, via a set of eighteen metrics covering a wide range of environmental aspects, such as climate change, ecotoxicity, eutrophication, resource depletion (fossil resources, water consumption, etc.), etc. Metrics produced from the assessment procedure fall into various environmental categories and therefore cannot be presented on the same scaling system. For this reason, the values of each LCA metric for each scenario were normalized against the maximum value among the scenarios. The values of each indicator were normalized to 1, meaning that each metric value of each scenario is divided by the maximum of all scenarios. Thus, the scenario with the higher score gets 1 and the others get accordingly lower scores.
Fig. 11 presents the normalized values of all scenarios and all metrics. Results show that scenarios including the option of hydrogen production via electrolysis (Scenarios 2, 3, 4 of Concept 1 and Scenario 5, Concept 2) have higher values for the majority of indicators compared to those scenarios referring to hydrogen production via steam reforming (especially for the GWP and fossil resource scarcity (FFP) metrics which are related to fossil fuel consumption and declare the contribution of natural gas use in the hydrogen production via steam reforming). These higher values are due to the contribution of the hydrogen production that is used in biocrude upgrading to the impacts expressed by these metrics and the respective contribution of electricity and sodium chloride which are input flows in the production of hydrogen via chlor-alkali electrolysis.
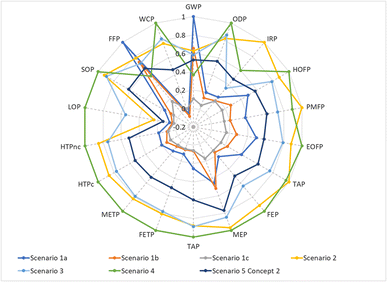 | ||
| Fig. 11 LCA metrics of all scenarios using the RECIPE 2016 V1.1 LCIA method for midpoint impact categories. | ||
Recipe 2016 V1.07 Endpoint, hierarchist perspective is also selected as it facilitates the ranking of each scenario in a normalized aggregated form. Results are basically differentiated due to the variation of the contribution of the human health impact category, which is the outcome of the aggregation of impacts such as global warming, stratospheric ozone depletion, ionizing radiation, ozone formation, particulate matter formation, etc. on the midpoint level (Fig. 12).
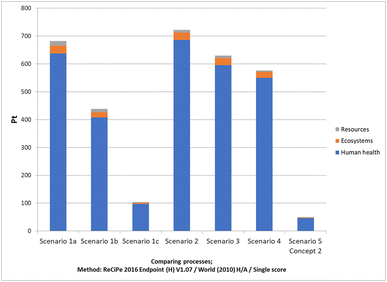 | ||
| Fig. 12 LCA metrics of all scenarios using the ReCiPe 2016 V1.07 LCIA method for endpoint impact categories. | ||
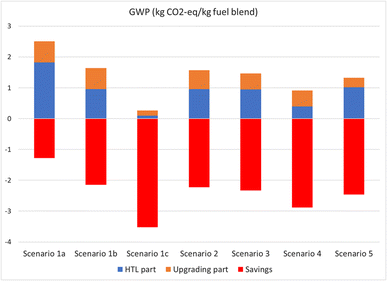
Fig. 13 summarizes the GWP metric for all Scenarios and the achieved LCA-GWP savings that range from 34% for Scenario 1a to 93% for Scenario 1c. GHG savings are defined as the difference of the biofuel GWP metric from that of the fossil diesel (≈3.8 kg CO2 per kg diesel)26 including their production and tailpipe use which in the case of the biofuel is (assumed to be) zero.
Technoeconomic analysis
Reference values for capital and operating costs were obtained by the study of Snowden-Swan et al. (2017)15 and refer to Scenario 1a which is the reference scenario on the basis of which the other Scenarios were developed. The alternative scenarios describing the changes in costs associated with the installation of the electrolysis unit, the exclusion of the steam reforming unit or the replacement of the ammonia stripping unit for aqueous phase treatment with direct recycling and AD unit/AD unit are also provided. All this information is included in Tables A8–A14 of the ESI.† It should be noted that these values refer to the year 2018 with a level of normal market conditions and not to present values when unforeseeable conditions affect market balance.In particular, for cost assessment of Scenario 5 (Concept 2), CAPEX for the HTL unit remains the same and a scale down approach is applied for the case of the partial hydrotreatment. The scaled costs were estimated based on the new flow units, i.e. the capacities based on one tenth of the case presented in the base line scenario using scaling exponents in the study of Snowden-Swan et al. (2017).15 The information was scaled down for each unit operation, and the monetary transformation for the study year and in euro was applied.
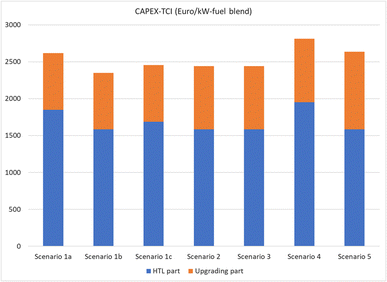
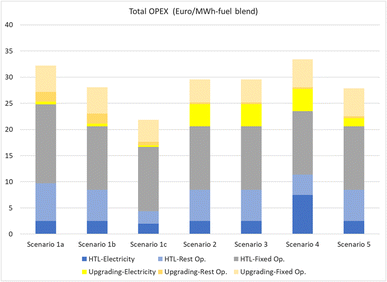
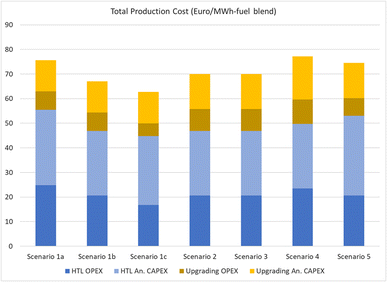
Fig. 14, 15 and 16 present a summary of CAPEX values, OPEX values and total production costs for all scenarios, respectively, both on HTL biocrude production and upgrading steps (detailed information for cost values per step is provided in Tables A7 and A12 in the ESI† for Concepts 1 and 2). CAPEX values for the biocrude production step range from 1551 to 1914 Euro per kW biocrude (for 15 MW of biocrude produced) and OPEX between 16 and 25 Euro per MW h (for 138, 147 MW h biocrude per year) for both Concepts. For Concept 1, regarding the upgrading step, CAPEX values range between 2349 and 2810 Euro per kW biofuel blend (for 149 MW of biofuels produced and including the HTL step) and OPEX from 21 to 34 Euro per MW h-biofuels including the production cost of biocrude (total operating cost that was estimated in the HTL bio-oil production step, for 1, 313, 888 MW h biofuels per year). For Concept 2 that produces 14 MW of treated bio-oil and 128![[thin space (1/6-em)]](https://www.rsc.org/images/entities/char_2009.gif) 000 MW h treated bio-oil per year the respective values are 2634 Euro per kW for CAPEX and 27.8 Euro per MW h for OPEX.
000 MW h treated bio-oil per year the respective values are 2634 Euro per kW for CAPEX and 27.8 Euro per MW h for OPEX.
Production costs vary between 60 and 80 Euro per MW h product as shown in Fig. 16. For the estimation of the production cost, annualized CAPEX was estimated assuming 15 years project lifetime, 10% annual interest rate and 7920 annual operating hours. This range lies between the range of production costs of estimations for the demonstration plant, and assessments for commercial-scaled-up unit gasification plants which varies between 50 and 100 Euro per MW h.27
Regarding the effect of energy prices, a disaggregation of the operating cost shows the contribution of the electricity costs to the operating production costs. In Fig. 15 it is shown that the contribution of the electricity cost in the total operating cost ranges from 9% for Scenario 1a up to 35% for Scenario 3 where heating requirements are covered purely by electricity. The particular price for electricity that was used for the TEA is equal to 0.07 $ per kW h (2014$) which after the conversion to Euro (2018) is equal to 0.06 Euro per kW h which is the equivalent US electricity price expressed in Euros.15 From a temporal perspective, the development of average EU electricity prices for non-household consumers was 2008–2023 between 0.10 Euro per kW h and 0.21 Euro per kW h (Eurostat data).39 The regional variation of the electricity prices for the most recent data for non-household consumers, for the first half of 2023, was highest in Romania (€ 0.33 per kW h) whereas the lowest prices were observed in Finland and Portugal (€ 0.10 per kW h). The EU average price in the first half of 2023 was € 0.21 per kW h (Eurostat data).39 The respective values for 2018 were € 0.05 per kW h (Ireland) and € 0.25 per kW h (Denmark). This variation corresponds to a reduction of 11% and increase by 356% of the electricity cost.
Production costs constitute a critical parameter for the viability and commercialization of advanced biofuels with CAPEX making the highest contribution together with the feedstock cost.29 In particular, CAPEX is basically related to the design configurations and the potential technical challenges of the biofuel production processes whereas feedstock cost is mainly affected by logistics costs. On the other hand, operating costs are driven by exogenous market conditions. Regarding technological maturity, HTL is still a technology under development, and scale-up to pilot and demonstration plants has been implemented.3,28 Challenges are related to feed pretreatment, heat recovery, and HTL reactor design to maximize yield and overall reaction performance, separation techniques for solid removal including salts/ash in HTL reaction products and crude bio-oil processing and upgradation methods.3 These technological challenges give a space for potential improvement and subsequently for future CAPEX reduction induced by technological learning, which is assumed to improve the performance of the new technology by gaining more experience. Several studies have presented a potential cost reduction for biofuel production via biochemical and thermochemical production pathways ranging from 10% to 50% depending on the technological maturity and the number of plants installed.29,30
Conclusions
Various configuration schemes of HTL for biocrude production and upgrading for the production of biofuels were assessed with respect to their economic and environmental performance. Results of the analysis reveal that HTL can be a valuable option for development close to oil refineries and benefits from the existing infrastructures. Production costs varying between 60 and 80 € per MW h-product look promising (e.g., similar to biomass gasification demonstration plants). This range corresponds to 0.6 to 0.8 € per L of diesel or gasoline produced via Scenarios 1 to 4 assuming an average lower calorific value (LHV) of 34 MJ L−1.38 Comparing this value range with the wholesale prices of diesel and gasoline without taxes found in the European Commission, it can be inferred that a certain degree of competitiveness could be claimed.40 In the overall production cost, biocrude production cost plays an essential role in the scaling up and full commercialization of the technology, incorporating as well the aspect of biocrude transportation which is a matter of optimization. The achieved LCA-GWP savings ranging from 40% to 90% are similar to other biofuel production technologies (also including HTL of lignocellulosic biomass waste). For both LCA and TEA the “fate” of the HTL water phase can play an important role whereas more research is needed on alternative technological options in treating the water phase and utilizing the organic content. Sustainability performance could be favored as much as if the electricity generation for hydrogen production would be 100% renewable and at prices 50% lower than 2020 levels.Sewage sludge management can be implemented via thermochemical and biochemical processes producing fuel and chemicals, such as pyrolysis, hydrothermal gasification, hydrothermal liquefaction, hydrothermal carbonization, and anaerobic digestion.41 These technologies tend to replace the traditional ways of landfilling due to low energy recovery and incineration which is popular in reducing waste volume but has high operating costs for the drying process. Anaerobic digestion is more efficient than incineration in energy recovery, but with low efficiency and high capital costs.43
HTL can achieve a high biocrude yield and energy recovery without energy-intensive drying, e.g., compared to pyrolysis. Therefore, HTL is a particularly suitable alternative for sewage sludge treatment compared to other technologies.44
HTL as a waste-to-energy technology has the potential to pursue goals seven (Affordable and Clean Energy) and eleven (Sustainable Cities and Communities) of the Sustainable Development Goals of the United Nations.42 In the particular case of municipal sewage sludge treatment, the HTL technology could enhance the decentralized biofuel production and alter the existing urban waste management practices.
Based on the presented results, prospective Life Cycle Assessment can be applied to assess the future environmental performance of existing and upcoming technological options in the biocrude production. Cost reductions due to the learning curve methodology can be coupled with the prospective LCA in an aggregated framework to assess the potential evolution of the described systems under various future conditions.
Author contributions
Paraskevi Karka: data curation, methodology, conceptualization, writing – original draft. Stavros Papadokonstantakis: supervision, methodology, conceptualization, writing – review & editing. Ib Johanssen: conceptualization, methodology, writing – review & editing.Conflicts of interest
There are no conflicts to declare.Acknowledgements
This work has received funding from European Union's Horizon 2020 research and innovation programme under Marie Skłodowska-Curie RISE action, grant agreement no. 778332, project RENESENG II.References
- EEA, https://www.eea.europa.eu/publications/transport-increasing-oil-consumption-and, accessed, August 2023.
- International Energy Agency (IEA), https://www.iea.org/energy-system/transport, accessed August 2023.
- R. Ghadge, N. Nagwani, N. Saxena, S. Dasgupta and A. Sapre, Design and scale-up challenges in hydrothermal liquefaction process for biocrude production and its upgradation, Energy Convers. Manage.: X, 2022, 14, 100223 CAS.
- E. Tito, G. Zoppi, G. Pipitone, E. Miliotti, A. Di Fraia, A. M. Rizzo, R. Pirone, D. Chiaramonti and S. Bensaid, Conceptual design and techno-economic assessment of coupled hydrothermal liquefaction and aqueous phase reforming of lignocellulosic residues, J. Environ. Chem. Eng., 2023, 11(1), 109076 CrossRef CAS.
- D. Castello, M. S. Haider and L. A. Rosendahl, Catalytic upgrading of hydrothermal liquefaction biocrudes: Different challenges for different feedstocks, Renewable Energy, 2019, 141, 420–430 CrossRef CAS.
- J. M. Jarvis, K. O. Albrecht, J. M. Billing, A. J. Schmidt, R. T. Hallen and T. M. Schaub, Assessment of Hydrotreatment for Hydrothermal Liquefaction Biocrudes from Sewage Sludge, Microalgae, and Pine Feedstocks, Energy Fuels, 2018, 32(8), 8483–8493, DOI:10.1021/acs.energyfuels.8b01445.
- E. M. Lozano, S. Løkke, L. A. Rosendahl and T. H. Pedersen, Production of marine biofuels from hydrothermal liquefaction of sewage sludge. Preliminary techno-economic analysis and life-cycle GHG emissions assessment of Dutch case study, Energy Convers. Manage.: X, 2022, 14, 100178 CAS.
- Y. Nie and X. Bi, Life-cycle assessment of transportation biofuels from hydrothermal liquefaction of forest residues in British Columbia, Biotechnol. Biofuels, 2018, 11, 23, DOI:10.1186/s13068-018-1019-x.
- L. Moser, B. W. Portner, C. Penke, K. Ebner and V. Batteiger, Life-cycle assessment of renewable fuel production via hydrothermal liquefaction of manure in Germany, Sustainable Energy Fuels, 2023, 7, 4898–4913 RSC.
- H. Chen, C. Zhang, Y. Rao, Y. Jing, G. Luo and S. Zhang, Methane potentials of wastewater generated from hydrothermal liquefaction of rice straw: focusing on the wastewater characteristics and microbial community compositions, Biotechnol. Biofuels, 2017, 10, 140 CrossRef PubMed.
- H. Chen, S. Hao, Z. Chen, S. O-Thong, J. Fan, J. Clark, G. Luo and S. Zhang, Mesophilic and thermophilic anaerobic digestion of aqueous phase generated from hydrothermal liquefaction of cornstalk: Molecular and metabolic insights, Water Res., 2020, 168, 115199 CrossRef CAS PubMed.
- Y. Zhu, S. B. Jones, A. J. Schmidt, K. O. Albrecht, S. Edmundson and D. B. Anderson, Techno-economic analysis of alternative aqueous phase treatment methods for microalgae hydrothermal liquefaction and biocrude upgrading system, Algal Res., 2019, 39, 101467 CrossRef.
- J. Watson, T. Wang, B. Si, W.-T. Chen, A. Aierzhati and Y. Zhang, Valorization of hydrothermal liquefaction aqueous phase: pathways towards commercial viability, Prog. Energy Combust. Sci., 2020, 77, 100819 CrossRef.
- M. A. J. Huijbregts, Z. J. N. Steinmann, P. M. F. Elshout, G. Stam, F. Verones, M. Vieira, M. Zijp, A. Hollander and R. van Zelm, ReCiPe2016: a harmonised life cycle impact assessment method at midpoint and endpoint level, Int. J. Life Cycle Assess., 2017, 22, 138–147 CrossRef.
- L. J. Snowden-Swan et al. , Conceptual Biorefinery Design and Research Targeted for 2022: Hydrothermal Liquefaction Processing of Wet Waste to Fuels, Technical Report, Pacific Northwest National Laboratory, Richland, Washington, 2017 Search PubMed.
- Ecoinvent Centre, 2023, http://www.ecoinvent.org, accessed, August 2023.
- Pré, https://pre-sustainability.com/solutions/tools/simapro/, accessed August 2023.
- I. J. Tews, et al., Biomass Direct Liquefaction Options. TechnoEconomic and Life Cycle Assessment, 2014, DOI:10.2172/1184983, https://www.osti.gov/biblio/1184983.
- S. Brynolf, M. Taljegard, M. Grahn and J. Hansson, Electrofuels for the transport sector: A review of production costs, Renewable Sustainable Energy Rev., 2018, 81(Part 2), 1887–1905 CrossRef.
- OECD, Purchasing power parities, National currency units/US dollar, https://data.oecd.org/conversion/purchasing-power-parities-ppp.htm#indicator-chart, accessed August 2023.
- Towering Skills, https://toweringskills.com/financial-analysis/cost-indices/#cepci-2001-to-present, accessed August 2023.
- OECD, Producer price indices. National currency units/US dollar, https://data.oecd.org/price/producer-price-indices-ppi.htm, accessed August 2023.
- L. Snowden Swan et al. , Wet Waste Hydrothermal Liquefaction and Biocrude Upgrading to Hydrocarbon Fuels: 2020 State of Technology, Pacific Northwest National Laboratory, Richland, Washington, 2021 Search PubMed.
- F. Suleman, I. Dincer and M. Agelin-Chaab, Comparative impact assessment study of various hydrogen production methods in terms of emissions, Int. J. Hydrogen Energy, 2016, 41(19), 8364–8375 CrossRef CAS.
- M. S. Haider, D. Castello and L. A. Rosendahl, Two-stage catalytic hydrotreatment of highly nitrogenous biocrude from continuous hydrothermal liquefaction: A rational design of the stabilization stage, Biomass Bioenergy, 2020, 139, 105658 CrossRef CAS.
- EU Joint Research Center, Well-to-wheels analysis of future automotive fuels and powertrains in the European context, Well-to-Tank Report - Appendix 1, 2011.
- H. Thunman, C. Gustavsson, A. Larsson, I. Gunnarsson and F. Tengberg, Economic assessment of advanced biofuel production via gasification using cost data from the GoBiGas plant, Energy Sci. Eng., 2019, 7, 217–229, DOI:10.1002/ese3.271.
- R. de Souza Deuber, D. S. Fernandes, J. M. Bressanin, J. Watson, M. F. Chagas, A. Bonomi, L. V. Fregolente and M. D. B. Watanabe, Techno-economic assessment of HTL integration to the Brazilian sugarcane industry: An evaluation of different scenarios, Ind. Crops Prod., 2021, 173(1), 114139 CrossRef.
- P. Karka, F. Johnsson and S. Papadokonstantakis, Production costs of advanced biofuels using a multi-component learning curve model, Comput.-Aided Chem. Eng., 2021, 50, 1937–1942, DOI:10.1016/B978-0-323-88506-5.50300-4.
- K. Vasilakou, P. Nimmegeers, G. Thomassen, P. Billen and S. Van Passel, Assessing the future of second-generation bioethanol by 2030 – A techno-economic assessment integrating technology learning curves, Appl. Energy, 2023, 344, 121263 CrossRef.
- G. Del Alamo, M. Bugge, T. Helmer Pedersen and L. Rosendahl, Techno-Economic Analysis of the Production of Liquid Biofuels from Sewage Sludge via Hydrothermal Liquefaction, Energy Fuels, 2022, 37(2), 1131–1150 CrossRef PubMed.
- https://circlianordic.com/our-product/ .
- https://circlianordic.com/brochure/ .
- I. Johannsen, B. Kilsgaard, V. Milkevych and D. Moore, Design, Modelling, and Experimental Validation of a Scalable Continuous-Flow Hydrothermal Liquefaction Pilot Plant, Processes, 2021, 9, 234, DOI:10.3390/pr9020234.
- S. Badoga, A. Alvarez-Majmutov, J. K. Rodriguez and J. Chen, Upgrading of Hydrothermal Liquefaction Biocrude from Forest Residues Using Solvents and Mild Hydrotreating for Use as Co-processing Feed in a Refinery, Energy Fuels, 2023, 37, 13104–13114 CrossRef CAS.
- C. Li, J. E. Aston, J. A. Lacey, V. S. Thompson and D. N. Thompson, Impact of feedstock quality and variation on biochemical and thermochemical conversion, Renewable Sustainable Energy Rev., 2016, 65, 525–536 CrossRef CAS.
- S. van Dyk, J. Su, J. McMillan and J. Saddler, Potential synergies of drop-in biofuel production with further co-processing at oil refineries, Biofuels, Bioprod. Biorefin., 2019, 13, 760–775, DOI:10.1002/bbb.1974.
- Fuels - Higher and Lower Calorific Values, https://www.engineeringtoolbox.com/fuels-higher-calorific-values-d_169.html.
- Eurostat - Statistics Explained/non household consumers, https://ec.europa.eu/eurostat/statistics-explained/index.php?title=Electricity_price_statistics#Electricity_prices_for_non-household_consumers.
- European Commission, Weekly Oil Bulletin, https://energy.ec.europa.eu/data-and-analysis/weekly-oil-bulletin_en Search PubMed.
- M. Hu, Z. Ye, H. Zhang, B. Chen, Z. Pan and J. Wang, Thermochemical conversion of sewage sludge for energy and resource recovery: technical challenges and prospects, Environ. Pollut. Bioavailability, 2021, 33(1), 145–163, DOI:10.1080/26395940.2021.1947159.
- N. AlQattan, M. Acheampong, F. M. Jaward, F. C. Ertem, N. Vijayakumar and T. Bello, Renew. Energy Focus, 2018, 27, 97–110 CrossRef.
- H. Liu, N. Lyczko, A. Nzihou and C. Eskicioglu, Incorporating hydrothermal liquefaction into wastewater treatment – Part II: Characterization, environmental impacts, and potential applications of hydrochar, J. Cleaner Prod., 2023, 383, 135398, DOI:10.1016/j.jclepro.2022.135398 , hal-03888501..
- I. A. Basar, H. Liu, H. Carrere, E. Trably and C. Eskicioglu, A review on key design and operational parameters to optimize and develop hydrothermal liquefaction of biomass for biorefinery applications, Green Chem., 2021, 23, 1404–1446, 10.1039/D0GC04092D.
Footnote |
| † Electronic supplementary information (ESI) available. See DOI: https://doi.org/10.1039/d3se01211e |
| This journal is © The Royal Society of Chemistry 2024 |

