 Open Access Article
The value of ammonia towards integrated power and heat system decarbonisation†
Georgios L.
Bounitsis
and
Vassilis M.
Charitopoulos
 *
*
The Sargent Centre for Process Systems Engineering, Department of Chemical Engineering, UCL (University College London), Torrington Place, London WC1E 7JE, UK. E-mail: v.charitopoulos@ucl.ac.uk
First published on 8th May 2024
Abstract
As the United Kingdom (UK) is legally bound to Net Zero goals, deep decarbonisation of wide power and heat systems constitutes a focal point of research. With heat being the biggest energy consumer in the UK, sector coupling emerges as imperative towards cost-efficient decarbonisation. Pathways including dense energy carriers, which can store excessive intermittent renewable energy, offer alternative options for optimal system operation. In this work, the role of hydrogen and ammonia as energy vectors in Great Britain's (GB) power system planning is examined. Dense energy carriers' pathways are modelled to offer additional energy storage, transport and electricity generation options for the system. A spatially explicit snapshot model is developed, whose temporal resolution captures the short- and long-term dynamics of demands and renewable sources through a novel chronological clustering method. Ultimately, integrated capacity planning and operational optimisation in GB is conducted for a target year via the snapshot model. Regional power and heat demands are determined as the heat fuel consumption mix is optimised. Key findings include that under various scenarios up to 80% heat electrification can be cost effectively achieved through the flexibility offered by up to 6 TW h of ammonia storage for annual inter-seasonal storage.
1 Introduction
1.1 Motivation of the study
According to Net Zero goals, the UK aims to radically reduce its carbon emissions by 2050. The successful transition to a net zero energy system is a challenging problem as the decarbonisation of a range of services and processes is necessary.1 In particular, the fulfilment of the UK's power system goals in the future requires the transition from its current carbon-intensive state (169.9 kgCO2 MW h−1 in 2020 according to National Grid ESO2) while honouring carbon emission goals, affordability and reliability.3 This problem requires sector coupling investigations, since different sectors, like heat and domestic transport, are highly energy consuming and carbon-intensive.4 Technological developments in electricity generation, energy storage, heating systems and carbon capture and storage (CCS) technologies offer a wide variety of options to empower sector coupling, heat electrification and decarbonisation towards Net Zero. In particular, renewable energy sources (RES) are crucial for such a power system as they provide zero-carbon electricity generation and lead to sharp reduction of marginal cost in power markets.5 Nevertheless, their integration into the power grid warrants judicious planning and additional flexibility options; otherwise they can have adverse economic effects, as in the UK in 2021 curtailment costs exceeded £500 million.6 Due to RES intermittency, a lot of research effort is put into the efficient storage and transportation of energy. Battery energy storage systems (BESS) have rapidly evolved during the last few decades and transmission expansion of networks has been studied in parallel with the systems' planning.7,8 Despite the importance of the latter for the power system, the short-term duration of BESSs (low ratio of its energy storage capacity to its power rating capacity) and the increased volatility within the power grid hinder the efficient exploitation of the increasing RES generation.9 Thus, recent efforts have resorted to alternative options for efficient integration of the excessive RES. These include storage through dense energy carriers (DEC), such as hydrogen and ammonia.10,11 As hydrogen is a challenging DEC due to the cost and safety considerations regarding its storage and transportation handling, this work further incorporates ammonia, which has emerged as a promising alternative for cost-effective hydrogen-based energy storage.12,13 For the sake of clarity, it is mentioned that even though ammonia's handling is safer than hydrogen's (e.g., no high pressure or cryogenic conditions during ammonia's storage), there are still serious safety and health concerns for ammonia, as in the case of hydrogen.12,14 Ammonia could be produced in the future by using low-carbon hydrogen and electricity through the well-established Haber–Bosch (HB) process, leading to a low-carbon alternative option for hydrogen-based energy storage.15 The ultimate goal of this work is to formulate a capacity planning and operational optimisation spatially explicit snapshot model for nationwide coupled power and heat systems in order to evaluate the role of both hydrogen and ammonia for energy storage and transport.1.2 Existing literature
Energy systems modelling for the optimisation of future decarbonisation strategies constitutes a challenging problem.16 Such problems can also be categorised under the family of Capacity Expansion Planning (CEP) problems and aim to optimise the structure and operation of power systems and networks in the future.3,8 Simplified versions of a CEP problem can consider a single time stage planning (also denoted as snapshot problems). However, long-term planning that spans multiple time stages is the standard version of such problems and they may also be mentioned as evolution models.17 CEP problems can determine the optimal capacity mix of generation technologies, their locations and their operation while minimising the total cost considering a complex set of constraints. Typical constraints include restrictions such as technical, operational, economical, and environmental as well as constraints that account for complementary sectors. Depending on the scope of the modelling approach, CEP can be extended to include additional sets of constraints, which can help to model in detail some specific aspects of the system. Some examples of the latter are: (i) decarbonisation constraints, (ii) transmission expansion modelling, (iii) power and other sector codependency, (iv) stability and security of the system, (v) energy storage, and (vi) short-term unit commitment integrated into long-term CEP.3 As the power system evolves towards deep decarbonisation, more studies consider the integration of RES into the CEP problem.5,18 The same holds for integrated power, gas and hydrogen systems and finally for the integration of energy storage options into CEP problems.19,20Depending on modelling assumptions and goals, the choice of an appropriate system and time representation is essential. The computational complexity of CEP problems, including coupling considerations along with integrated planning and operational optimisation, is further exacerbated depending on the selected temporal resolution for each time stage.21 Thus, a wide variety of time aggregation methodologies have been proposed to compress a full-year temporal resolution according to the needs of the problem and to mitigate computational limitations.22,23 Widely used methodologies include the generation of representative days to emulate the full-year resolution of available data profiles and consequently of the system's operation. Poncelet et al.24 proposed an optimisation-based approach for representative day selection that minimises the approximation errors to the original duration curves. In the work by Tso et al.,25 representative days are chosen using an agglomerative hierarchical clustering approach to optimise energy systems with storage. However, while the latter approaches significantly reduce the computational burden, they may lead to approximate solutions to CEP problems compared to the problems using full-year data.26,27 In contrast, the chronological time-period clustering (CTPC) approach can enhance performance in solving CEP and capture the value of long-term storage, while honouring chronology and short-term dynamics. In particular, CTPC was introduced by Pineda and Morales17 and uses Ward's hierarchical clustering to reduce the number of time periods while keeping the chronological order of the original data.28
Recent works regarding energy systems modelling indicating basic concepts that are progressively considered in the problem statements are outlined as follows. Koltsaklis et al.29 proposed a spatially explicit Mixed-Integer Linear Programming (MILP) model integrating CO2 emission constraints for Greece. Lara et al.30 proposed an MILP model and a nested Benders decomposition algorithm for capacity expansion planning in Texas. Heuberger et al.31 modelled the capacity expansion problem considering endogenous technology cost reduction and implemented it in GB's power system. The aforementioned studies focused on the planning and operation of wide power systems without considering power and heat sector coupling. A combined gas and power network expansion problem for GB has been presented by Chaudry et al.32 Charitopoulos et al.4 formulated a capacity expansion planning MILP model coupling power and heat sectors in order to study the cases of heat electrification in GB. Finally, Hoseinpoori et al.33 proposed a single node MILP model for integrated power, heat and gas systems in GB considering hydrogen production for heat satisfaction in order to investigate heat electrification and decarbonisation strategies for buildings.
Capacity expansion problems with high penetration of renewable generation necessitate the efficient exploitation of excessive renewable energy towards decarbonisation.7 The optimisation of the location, sizing and operation of storage systems is challenging as BESSs are appropriate only for short-term energy storage.34 Thus, dense energy carriers (such as hydrogen and ammonia) or pumped storage systems are imperative for the efficient mid- or long-term storage of excessive renewable energy.13,35 Focusing on DECs, while hydrogen has been demonstrated to have competitive advantages over battery storage, ammonia further enhances hydrogen-based storage.10,13 Ganzer et al.36 employed the relaxed Linear Programming (LP) version of the capacity expansion model of Heuberger et al.31 integrating the power-to-gas storage pathway and employing full-year hourly resolution in order to evaluate the role of inter-seasonal storage for GB's power system. They selected methane for storage and showcased that inter-seasonal storage provides value to the system despite its high cost and low round-trip efficiency.
Focusing on hydrogen-led decarbonisation studies, He et al.37 investigated the integration of hydrogen production for electricity-grid storage in the United States Northeast region and highlighted the role of hydrogen in deep decarbonisation scenarios. Other studies have also highlighted the role of hydrogen for storage in power systems towards decarbonisation.38,39 Furthermore, research studies delved into the hydrogen network expansion in the UK or the United States considering detailed storage, transport and renewable generation.40–44 Finally, heat decarbonisation in the UK via hydrogen pathways has been investigated by Sunny et al.45
Beyond hydrogen, ammonia's optimal production constitutes a focal point of research. Ammonia's conventional production is a power and carbon-intensive process (8.6 EJ power consumption and 450 Mt CO2 in 2020), which was mainly used during the last century for fertiliser production.46 Ammonia as a fertiliser is expected to play a more significant role globally in the future as estimations for up to 40% NH3 production increase and the need for 41 Mt H2 in 2050 are reported. Moreover, the direct CO2 emissions from NH3 production can be reduced by over 70% with the installation of over 110 GW electrolyser capacity.47 However, ammonia has also emerged as a promising dense energy carrier as its benefits for energy systems can be twofold: (a) its long-term storage and transportation are inexpensive and safe compared to other alternatives, and (b) the stored energy can be consumed in a subsequent time period or be transported to a different geographical region.12,14 Particularly, renewable-based green ammonia on a large scale could be a potentially valuable asset towards a future decarbonised system.46,48 Therefore, research studies on the scheduling, planning and optimal operation of energy systems have recently included both renewable-based ammonia production and ammonia-to-power pathways in their considerations.49–51 Palys and Daoutidis52 proposed a capacity planning and scheduling MILP model in order to minimise the levelised cost of ammonia in specific locations. Moreover, techno-economic analyses have forecasted the levelised cost of ammonia to be lower than $400/t by 2040, which could enable the cost-efficient use of ammonia fuel for electricity generation.53–55 While several studies focused on islanded ammonia production (without electricity grid connection) or fixed electricity prices, Salmon and Bañares-Alcántara12 studied how grid connections can assist to reduce infrastructure costs and consequently the levelised cost of ammonia production. Regarding supply chain optimisation, Allman et al.56 examined the impact of renewable ammonia as a means for demand satisfaction in the ammonia supply chain. Finally, ammonia has also been considered within the context of whole-system energy carrier supply chain optimisation.57
Ammonia is studied for a plethora of planning, scheduling and supply chain optimisation problems. However, the integration of ammonia into a country's power system planning and operational optimisation problem remains largely unexplored. The evaluation of ammonia's role as a spatial energy vector and energy carrier for inter-seasonal storage in a nationwide coupled power and heat system has not been studied yet.
1.3 Contributions
This work aims to present a snapshot spatially explicit LP model for capacity planning and operational optimisation towards Great Britain's power and heat sector decarbonisation in a future target year. The main contributions of this work include:• Selection of fine-grained spatial and temporal representations for detailed operational optimisation.
• A novel chronological time-period clustering approach to better capture both renewable sources and demand variability.
• Determination of power system demand by optimizing the heat fuel consumption mix considering heat electrification, natural gas and hydrogen options.
• Integration of hydrogen and ammonia pathways to offer alternative options for energy storage and transport.
• Assessment of the role of ammonia for long-term energy storage over a number of scenarios regarding technological build rates, biomass availability and renewable source efficiency.
The remainder of the article is organised as follows: in Section 2 the superstructure of the problem is presented and in Section 3 mathematical developments are outlined. In Section 4, the detailed case study results and different scenarios are discussed to elucidate the impact of different factors on the problem. Finally, conclusions and future directions are drawn in Section 5.
2 Problem description
2.1 Summary
This work aims to investigate the role of hydrogen and ammonia as energy vectors in a nationwide power system when the integrated power and heat sectors' decarbonisation is pursued. A spatially explicit snapshot model for planning and operational optimisation for GB's power system decarbonisation is formulated. In parallel, heat demand's breakdown is optimised, as it typically constitutes a significant component of the total energy demand and an important source of CO2 emissions.4 Towards the investigation of a future decarbonised power system, several crucial components should be taken into consideration, such as:• Power and heat demand.
• Electricity generation and energy carrier production technologies.
• Heat end-use options such as heat pumps, natural gas and hydrogen boilers.
• Renewable technology penetration into systems along with their availability profiles.
• Supply chain aspects such as storage and transmission/transportation of electricity or DECs.
• Electricity transmission to/from interconnected countries.
• Regulations to secure the adequacy of the power system.
• Technological build rates and land availability for RESs.
• Statutory policies and goals regarding carbon emissions.
Given the relevant inputs and technological or physical limits of the system, a snapshot model is proposed to optimise the planning and operation of the integrated heat and power system in a future target year. Regarding planning the model determines: (i) the investments in capacity expansion of generation and storage technologies and (ii) transmission expansion, while using the current infrastructure of the system (for the year 2020) as an initial point. The optimisation of the system's operation includes the decisions for generation, resources' transportation and storage for the target year. Ultimately, the model's output decisions include:
• Optimal heat fuel consumption mix breakdown.
• Optimised peak demand for the power system.
• Power system's capacity mix integrating conventional technologies, RESs, DECs and alternative pathways.
• Optimal operation of the system including generation, storage, transportation and interconnections towards decarbonisation.
Various aspects of the problem statement are presented in detail in the following sections.
2.2 Spatio-temporal analysis
In this work, we focus on GB's power system using a fine-grained spatial analysis, as this is considered to be imperative for the energy planning of the whole country's power system. To this end, GB is divided into 13 regions (g ∈ G) according to the Local Distribution Zones (LDZs) of the gas network as shown in Fig. 1a. Thus, both real-world profiles of several input parameters (e.g., demands and availability of RESs) and consequently the corresponding decisions are region-specific. Moreover, bidirectional interconnection capability for electricity transmission between GB and interconnected countries (i ∈ I) is set. This can be considered as an extension to the spatial resolution, as the exact connections of a region (LDZs, g ∈ G) to an interconnected country (i ∈ I) are specified for the future.58 Ultimately, the fine-grained spatial resolution is adopted not only to capture the geographical variation of power demand, heat requirements and RES availability but also to gain valuable insight regarding the energy resources' transportation between the LDZs and between GB and the interconnected countries in the results.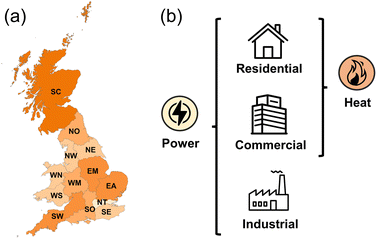 | ||
| Fig. 1 Basic components of the problem statement: (a) Local Distribution Zones (LDZ) of Great Britain, (b) investigated systems and sectors of energy demand. | ||
Regarding the temporal resolution, the power system's planning and operation is optimised for a certain year in the future. It can be stated that it is a single stage capacity expansion planning problem or alternatively a snapshot problem.17 As a snapshot problem that aims at operational optimisation, a full-year time horizon is employed. Using full-year hourly profiles of demand and climate data (1 year = 8760 hours), the operational decisions are taken on this time horizon (more information regarding demand and climate data is provided in Section 4.1 and in the ESI†). In particular, according to Poncelet et al.21 the employment of a full-year horizon is ideal when solving the CEP problem including long-term inter-seasonal storage. A full-year approach is able to capture in detail the long-term dynamics regarding RES generation, which displays seasonality, and the long-term energy storage, which may also display seasonality patterns. However, a full-year hourly resolution might lead to computationally intractable optimisation problems, as the problem's complexity increases significantly. Thus, Gonzato et al.27 suggested the solution of such problems with the use of CTPC and the inclusion of as many representative periods as possible. According to the findings in the literature, this work insists on the preservation of a detailed temporal resolution. The computational drawbacks of the full-year problem are dealt with exploring CTPC methods, which reduce the number of time periods employed and preserve the chronology of the original full-year hourly input time series. In particular, this work proposes a novel version of CTPC in Section 3.2 and its accuracy compared to a full-year problem is investigated in Section 4.2.
Further discussion on the variation of demand and climate data of the problem on the spatio-temporal scale is provided in Sections 2.1 and 2.2 of the ESI,† respectively.
2.3 Ammonia as a DEC for long-term energy storage
Hydrogen may be a challenging carrier for long-term energy storage not only due to safety and practical reasons but also because of storage and transport cost considerations. Hence, the ammonia pathway could be an alternative option for cost-effective hydrogen-based storage in the studies of energy systems planning.11 The advantages of ammonia for long-term storage include its high volumetric density (3.53 kW h L−1 for liquid NH3 compared to 2.35 kW h L−1 for liquid H2) and its cheaper storage and transportation costs compared to hydrogen.12,13 However, ammonia does not constitute the only choice for cost effective long-term storage of hydrogen-based energy.12 Liquid organic hydrogen carriers (LOHCs) are considered another promising category of carriers, which operate as “liquid hydrogen batteries”. In other words, these are liquid or low-melting solid organic compounds that can be reversibly hydrogenated or dehydrogenated at high temperatures and in the presence of catalysts in order to store or release hydrogen, respectively.59–62For the sake of comparison between ammonia and LOHCs, several aspects regarding energy storage on these are analysed as follows. Firstly, ammonia offers a relatively high energy density of 3.52 kW h L−1, while LOHCs achieve slightly lower energy densities, between 1.8 and 3.3 kW h L−1, depending on the chemical compound.60 Regarding the maturity of technologies, ammonia has been produced on a large scale for over a century through the Haber–Bosch process, which is considered optimised. The technology of LOHCs has also existed for many decades, as several aromatics have been hydrogenated or dehydrogenated in oil refineries for decades. However, research on chemical compounds, catalysts and processing conditions is necessary to further improve the energy efficiency, flexibility and market competitiveness of LOHC technology for hydrogen storage.63 Moreover, supply chain considerations are positive for both LOHCs and ammonia. LOHCs are considered compatible with existing fuel infrastructure, while for ammonia global supply chain infrastructure and even pipeline systems exist due to its importance for fertilizer production.14 Focusing on the behaviour of LOHCs and ammonia as fuels, LOHCs are also considered as environmentally friendly carbon-free fuels, as they do not emit CO2 upon combustion. LOHCs retain their initial structure after the release of stored hydrogen.59 In contrast, ammonia is typically combusted as a whole, which leads to NOx (nitrogen oxides) emissions.14 Finally, LOHCs present similar environmental and safety risk levels to conventional fuels. Ammonia is a toxic compound and consequently safety regulations for its handling and transportation are well established.61
According to this comparison analysis, both LOHCs and ammonia theoretically constitute promising options for long-term energy storage in the future. However, comparative economic assessment by Hank et al.64 indicates that NH3 displays 20% lower production and shipping costs than LOHCs and consequently the ammonia pathway may be more cost-efficient for long-term energy storage than LOHCs.65 Thus, this work accounts for the ammonia pathway in the investigated CEP problem. Besides, the ammonia pathway is selected as the concept of low-carbon ammonia production has been studied in a plethora of techno-economical studies in the literature.49,51,53,54
Beyond all the advantages of ammonia as a DEC, its combustion for electricity generation is also a very challenging research objective.66–68 The main challenges include the unstable combustion and the relatively high NOx emissions upon combustion.69 The mitigation of the latter constitutes the most vital problem towards the establishment of ammonia as an environmentally friendly fuel. Several studies and practical applications in the literature focus on the reduction of NOx emissions upon ammonia combustion. For instance, Somarathne et al.70 investigated the performance of an ammonia combustor using a turbulent premixed flame at various pressures to reduce both NOx emission and unburned ammonia. Ultimately, they indicated an ideal operating point for the implementation of a selective catalytic reduction (SCR) system in the exhaust of an ammonia combustor. Moreover, Somarathne et al.71 proposed a two-stage combustion of ammonia using a rich mixture in the first stage and a lean mixture in the second stage in order to suppress NOx emissions. Beyond lean ammonia combustion, Hussein et al.72 presented that combustion of mixtures of ammonia with hydrogen can lead to reduced NOx emissions in the exhaust.
Based on the research advancements in ammonia combustion, manipulation of operating conditions, use of ammonia as co-firing fuel and two-stage combustion are the realistic options for low-NOx combustion of ammonia at this moment. However, researchers are optimistic that using the knowledge of the dynamics and the chemistry of combustion the challenges can be overcome and dedicated ammonia combustion without NOx emissions will be available in the future.67,68 A significant role in achieving this goal can be played by the development of either a technology for catalytic combustion of ammonia or an efficient system for selective catalytic reduction using unburned ammonia in the exhaust of the combustor in order to remove NOx emissions.12,68 The latter is similar to ammonia's use in de-NOx processes for the control of NOx emissions in the exhaust of diesel combustion engines.68 Alternatively, the development of proton conducting electrolyte-based solid oxide fuel cells (SOFC-H) using ammonia could enable electricity generation without NOx emissions.73
Finally, the most encouraging results come from an initiative by Mitsubishi Heavy Industries,74 which has developed 40 MW ammonia-fueled gas turbines. In their official statement, they mention successful testing on an ammonia burner with stable operation and limited NOx emissions. Further results could constitute a turning point towards the deployment of large scale power generation using ammonia. Similar results and suppression of NOx emission have been officially stated by IHI Corporation75 for a 2 MW ammonia-fueled gas turbine and by a consortium including MAN Energy Solutions and BUTTING76 for the first-ever SCR system deployment in ammonia-fueled marine engines.
Ultimately, ammonia is selected as a DEC for long-term energy storage in this study due to its advantages regarding cost-effectiveness, renewable-based production, global supply chain infrastructure and well-established safety regulations. Moreover, based on the recent developments from the aforementioned industrial initiatives, we consider that NOx emissions mitigation technologies will be available in the near future and consequently we assume that ammonia's combustion does not emit greenhouse gases in the target year of the CEP problem.
2.4 System superstructure
Electricity, hydrogen and ammonia systems' planning is integrated into our proposed model to elucidate the complementarity and competition resulting from their integration. As the proposed model aims to determine the mix of technologies and optimise the operation of the power supply chain in a future year, the demand mix of the heat supply chain is concurrently optimised. Decisions on the latter are taken into consideration due to its high energy requirements and consequent carbon intensity.4 We note that due to the technology uptake complexities of industrial heat we do not consider this as part of the study and aim to address this issue in future work. The investigated systems along with the sectors of demand can be envisaged in Fig. 1.Regarding decisions on the GB's infrastructure, the status of existing technologies' (j ∈ J) generation and storage capacities as well as transmission capabilities is considered. Focusing on electricity generation technologies, they can be categorised into: (i) conventional and (ii) renewable technologies. Moreover, DECs, i.e., H2 and NH3, are included in this problem statement introducing alternative electricity generation ways, energy storage and transportation alternatives towards decarbonisation. In the problem statement, no classification of electricity based on carbon intensity is assumed. Hence, the study does not focus on exclusive green hydrogen or green ammonia production using solely low-carbon renewable energy.48 In contrast, all generation technologies contribute to the electricity grid. Then, electricity can be exploited either to satisfy demand or by certain technologies for storage and the production of dense energy carriers like hydrogen (via water electrolysis). Consequently, carbon-based discretisation is employed neither for hydrogen nor for ammonia. Instead, a system-wide carbon goal is set.
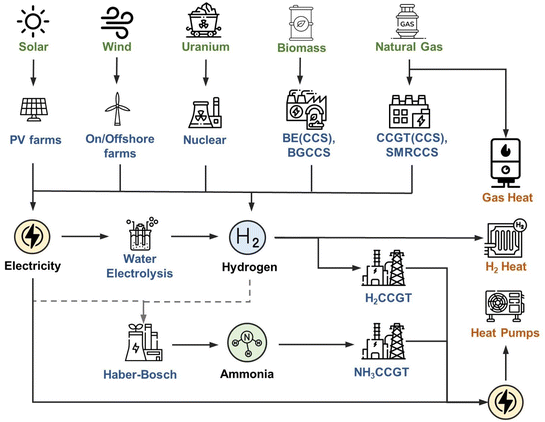
A summary of all electricity generation, DEC production and end-use heat technologies is given below. The superstructure of the network for the problem can also be visualised in Fig. 2. First, generation technologies that consume conventional fuels are considered as they play a vital role in the system's adequacy.77 Combined Cycle Gas Turbines (CCGTs) and nuclear power plants can generate electricity by consuming natural gas and uranium, respectively. Coupling conventional processes with CCS systems is also considered towards the reduction of net carbon emissions.78–80 Regarding CCS systems, several efficient large-scale technologies for CO2 capture exist (e.g., technologically ready oxyfuel systems with TRL = 8–9) and we assume unlimited available storage capacity for the captured CO2. Thus, CCGTCCS is included and then Steam Methane Reforming with CCS (SMRCCS) is added for hydrogen production from natural gas. However, coal-based technologies are neglected as their usage in GB already declines (9.7% load factor in 2020) and schemes to phase out existing unabated coal plants are established.81
As for renewable energy sources, solar farms and wind farms (both offshore and onshore) constitute participants in the current GB's system and are predicted to grow in the future.82–84 Furthermore, electricity generation from existing hydroelectric plants is considered but investments in these are neglected. Finally, biomass-fueled plants, which can be coupled with CCS systems, are taken into consideration, as they provide negative emissions. In this work, biomass for electricity generation (BE and BECCS) or gasification (BGCCS) for hydrogen production is considered.85–88
Considering hydrogen, beyond SMRCCS and BGCCS it can be produced via Water Electrolysis (WE).88,89 Regarding WE, a plethora of literature studies investigate its operation consuming electricity exclusively from RESs.90 Moreover, Supercritical's “GreenNH3” project for green ammonia production in the UK investigates green hydrogen production using wind energy through a power purchase agreements.91 However, in this work it is assumed that WE consumes electricity from the power grid. Produced hydrogen can be stored and then it can be consumed in three main pathways: (i) for ammonia production in the Haber–Bosch process, (ii) to contribute electricity back to the system by its combustion in hydrogen-fueled gas turbines (H2CCGTs) or (iii) by its combustion to end-use heaters to satisfy heat requirements.
Ammonia's role as a DEC for a future power system is similar to hydrogen's, but its storage and distribution are considered more cost-effective.92 NH3 can be produced using H2 and electricity as initial flows to the Haber–Bosch process. In particular, Haber–Bosch constitutes the traditional process to produce ammonia on a large scale and can be exploited in the future for low-carbon ammonia production.15 In this work, HB's techno-economic parameters are re-estimated in order to adopt the costs for the accompanied air separation units (ASUs) for the necessary nitrogen production.51 Produced ammonia can be stored and energy can be contributed back to the system for electricity generation in NH3 gas turbines, which directly use ammonia (NH3CCGTs). Even though technologies like H2CCGTs and NH3CCGTs are not yet commercially available for large-scale employment (TRL = 7 according to the Reiner Lemoine Institut report93), technological developments and predictions from world organisations allow the assumption for their availability in the next few decades.47,48,54,94,95 Moreover, based on the discussion in Section 2.3, NH3CCGTs are assumed to be coupled with SCR systems for NOx emission reduction and this is reflected in the higher CAPEX of NH3CCGTs compared to conventional CCGTs.
Among the various prospective means towards heat decarbonisation, natural gas, hydrogen and electricity are considered in this study to fulfill the total heat demand. The main goal is to determine the heat fuel mix breakdown towards a carbon-budget compliant and flexible system and elucidate the complementarities of alternative energy vectors, which can facilitate a cost-effective energy transition. We consider that a main type of technology is included for each type of fuel in the superstructure (j ∈ Jhs). Thus natural gas (NG) boilers, hydrogen boilers and heat pumps are considered respectively. Hydrogen-fueled boilers are assumed to be similar in terms of operation to conventional natural gas boilers.96,97 Moreover, the availability of fully hybrid heat technologies (in terms of flexible fuel consumption during operation and demand side management) is assumed for the future.4 Practically, hybrid systems consuming more than one type of resource could enhance the flexibility and efficiency of the system. In this way, a main type of heating fuel could satisfy a certain part of demand, while the rest of the fuels may intervene in periods of higher demand.
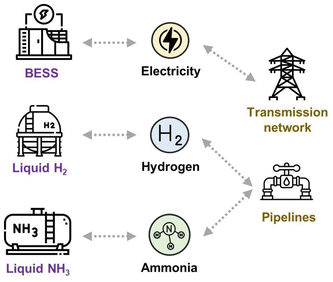
Apart from generation and direct satisfaction of demands, options for storage and transportation of resources are considered. Overall, electricity, hydrogen and ammonia (a ∈ A = {Elec, H2, NH3}) constitute the energy carriers of the investigated problem. For the sake of complexity reduction, one storage technology is selected for each resource. BESSs are considered for electricity storage in the grid and liquid storage tanks are considered for DECs. Regarding BESSs, lithium-ion technology is considered as it demonstrates competitive techno-economic specifications for the UK.98 Hydrogen storage requires cryogenic conditions (−253 °C and standard atmospheric pressure), which lead to a stored density that is appropriate for large-scale storage.62,99 Large-scale liquid ammonia storage is considered in the problem statement, where ammonia is stored at −33 °C and standard atmospheric pressure.92 Electricity consumption for both liquefaction (during storage charging) and refrigeration (of the stored hydrogen) is taken into consideration.100,101 We note that the thermal energy storage (TES) option is not considered for the heat sector. In particular, a specific configuration of the heat system is adopted for this case study and investigation of various heat system configurations and TESs can be found in the studies by Charitopoulos et al.4 and Hoseinpoori et al.33
Similarly to storage options, transportation modes between the regions are available for all energy carriers (a ∈ A = {Elec, H2, NH3}). In particular, electricity is considered to be transmitted through GB's transmission network and so GB's electricity network capacities as for 2020 are used as the initial point for the model (see the ESI†).102 Moreover, the proposed model includes the capability for further investments regarding the transmission expansion planning of GB's electricity network in the future target year.103 Regarding hydrogen and ammonia, transportation via pipelines is considered. Pipeline infrastructure for hydrogen is a topic of interest in the energy system literature, while ammonia pipelines already exist worldwide in order to transport ammonia for agricultural reasons.41,92 Storage technologies and transportation means for considered resources are visualised in Fig. 3.
Finally, GB's existing and future interconnectors to third countries are considered active for electricity imports and exports offering flexibility to all participants.58 The energy system of the interconnected countries is not modelled in detail, but real-world time series regarding day-ahead energy prices of the base year and projections for the future year are utilised.104,105 Finally, no capability for hydrogen or ammonia outsourcing from third countries is taken into account.
2.5 Summary of assumptions regarding Great Britain's power system
In this section, we summarise some characteristics of GB's power system and modelling assumptions. We discuss some of the strategies and policies that not only affect the construction of the problem's superstructure in Section 2.4 but also direct the modelling and the conducted analysis in this work.These characteristics of the UK's power system affect both the considerations on superstructure and some special modelling features. Given the problem statement, the modelling approaches and methodologies for an efficient solution are presented in the next section.
3 Methodology
3.1 Optimisation snapshot model description
This work proposes a spatio-temporal LP optimisation snapshot model for the planning and scheduling of GB's power system in the future target year. Thus, full-year hourly data are considered (h ∈ H, |H| = 8760). It is a spatially explicit model as GB is discretised into 13 regions (g ∈ G) as shown in Fig. 1a. The formulation of the model is mainly based on the model OPHELIA proposed by Charitopoulos et al.4 Power and heat demands are set and the mathematical model minimises the total system's cost composed of capital and operational costs. For the capital costs, decisions on capacity expansion and transmission expansion planning are provided, considering the power system's infrastructure as the initial point (generation capacities and electricity transmission network). In parallel, the operation of the system including generation, storage, distribution and interconnections is optimised. All decisions also refer to hydrogen and ammonia pathways, if applicable. The heat fuel consumption mix is optimised in parallel due to its high energy consumption and carbon intensity. Hence, the coupled system adheres to Net Zero carbon goals. In summary, the decisions of the optimisation model are:• Heat fuel consumption mix consisting of natural gas, electricity and hydrogen.
• Peak demand for the power systems considering the heat electrification ratio.
• Capacity expansion decisions for all generation and storage technologies.
• Electricity transmission expansion.
• Hourly dispatch decisions.
• Hourly storage and distribution operation.
• Hourly bidirectional interconnection flows with third countries.
These decisions are taken for each region (LDZ), if they are applicable. Moreover, decisions must be taken while accounting for the system's flexibility, adequacy and goals for carbon emissions. These concepts are incorporated into the optimisation problem though constraints concerning:
• Ramping of thermal generation plants in different modes.
• Peak demand honouring a security capacity margin.
• Build rates of considered technologies and RES land availability.
• Availability of fuels (limited biomass feedstock availability, see Table S11 in the ESI†).
• System's carbon emissions for power and heat sectors towards Net Zero.
As a first step towards the efficient solution of the LP problem, a novel version of chronological time-period clustering is proposed to significantly reduce the computational burden in Section 3.2. Time resolution compression is imperative for the solution of the problem in reasonable execution times and consequently the proposed LP model is reported in the time-adaptive representation in Section 3.3.
3.2 Novel priority-based chronological time period clustering
Time aggregation methodologies are widely used when dealing with complex energy system models in order to mitigate the computational burden and enhance the efficiency of solution.22 Clustering is used to merge similar elements into the same subset instead of merging them into other less similar subsets. This reduced number of generated subsets or clusters is eventually selected as the representative time period (expressed in hours, days or weeks), which encloses the information of the original dataset. The hierarchical clustering methods, which allow the inclusion of additional conditions during the merging of clusters, are of particular interest to this work. Our target is to propose an agglomerative hierarchical clustering and compress the full-year hourly time resolution capturing the long-term dynamics and maintaining the chronology of the time series. Pineda and Morales17 introduced Chronological Time-Period Clustering, which is based on Ward's method28 and recursively merges adjacent time periods (in chronological order), resulting in variable-length consecutive clusters. Ward's method merges a pair of clusters at each iteration based on the minimum dissimilarity measure (DMh) between adjacent clusters h ∈ H.CTPC has been demonstrated to outperform other clustering techniques in terms of average approximation error by capturing both short and mid-term dynamics. García-Cerezo et al.115 further enhanced the performance of CTPC by incorporating priority rules in hierarchical clustering. Priority Chronological Time-Period Clustering (PCTPC) classifies the clusters of the original input data depending on their priority and assigns the values to new clusters according to priority-based rules. In particular, priority definitions and the corresponding rules enforce the representation of certain features as extreme cases. Overall, the modified PCTPC is indicated to further reduce the approximation errors in the investigated case studies. Last but not least, PCTPC combined with reasonable priority rules can provide a conservative investment plan for a system, honouring its peak demand and security.
In this work, a further modification of the chronological clustering method is proposed. This work proposes new priority chronological time-period clustering (denoted as NPCTPC) that is also based on Ward's agglomerative hierarchical clustering and incorporates priority rules to merge clusters. The novelty lies in the definition and implementation of the priority rules. While PCTPC defines priority levels specifically for the clusters, NPCTPC enforces parameter-specific priority rules, i.e., different priority rules for the extreme events of each parameter of the time series are defined. The parameters are denoted as n ∈ N. Thus, NPCTPC merges adjacent clusters honouring different priority rules for different parameters n ∈ N of the time series while updating the values of the new clusters. Then, in the modified hierarchical clustering, when two clusters are merged, a duration is defined for the new cluster, but the different priority levels impose different rules for the update of values for each parameter n ∈ N. In the investigated problem, time series for 82 parameters are clustered and these refer to:
(1) Power demand for the wide system.
(2) Heat demand per 13 regions (g ∈ G).
(3) Solar availability per 13 regions (g ∈ G).
(4) Wind onshore availability per 13 regions (g ∈ G).
(5) Wind offshore availability per 13 regions (g ∈ G).
(6) Ambient temperature per 13 regions (g ∈ G).
(7) Interconnection prices per 5 third countries (i ∈ I).
In terms of mathematical notation, CTPC reduces the |H| original time periods of a dataset XH to |H′| representative variable-length time periods. For PCTPC, the original time periods of the whole dataset XH are additionally classified based on 3 priority levels (i.e., expressed by subsets Xhigh, Xmid, and Xlow). Then, different merging rules are imposed for the merged cluster depending on the subsets to which they belong. In this demonstration for NPCTPC, the original time series XH is represented by their realisations xnh in order to indicate the consideration of each parameter n ∈ N. In parallel, the parameter PLnh is defined to capture the information regarding the priority levels and consequently the extreme events of each parameter n ∈ N separately. Specifically, only two discrete priority levels are defined:
(1) Value “1” is assigned to PLnh for high-priority events regarding parameter n in the original time period h (high-priority events are considered the minimum and maximum daily power and heat demands and the maximum daily solar irradiation).
(2) Value “0” for all the rest of the low-priority events correspondingly.
As time periods are reduced from |H| to |H′|, time series realisation values xnh are updated for the reduced set and updated durations, th, are defined for clusters. The steps of the proposed procedure are reported in the following algorithm.
1. Initialise NC = |H| keeps track of the cluster number.
2. Define original cluster durations: th = 1, ∀h ∈ H.
3. Enforce priority rules: PLnh ∈ [0, 1].
4. Initialise dissimilarity measurement:
5. If NC > |H′|:
Else:
Go to step 9;
6. For (n ∈ N): If (PLn,hmin = PLn,hrem):
Else if ((PLn,hmin = 0)∧(PLn,hrem = 1)):
x n,hmin = xn,hrem;
PLn,hmin = PLn,hrem;
7. Update thmin = thmin + threm;
Delete xn,hrem, threm;
Update DMhmin−1, DMhmin (as in step 4);
Update NC = NC − 1;
8. Go to step 5;
9. Resulting time series of |H′| time periods with duration th (xnh, ∀n ∈ N, h ∈ H′).
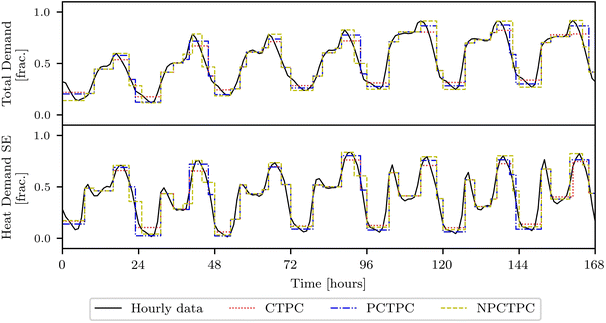
By implementing the three alternative chronological clustering methods on the original data, a reduced time series and duration of clusters are obtained. Detailed information regarding the original hourly data and their sources is provided in Section 4.1. In Fig. 4 clustered weekly demand profiles for a time compression from 8760 hours to 2190 time periods are presented.
Results from Fig. 4 indicate that the proposed NPCTPC captures more accurately peaks for 2 different parameters in parallel. Even though NPCTPC seems to generate clustered profiles that match original profiles well, we further scrutinise its approximation performance in Section 4.2.
3.3 Mathematical modelling – LP snapshot model
A brief discussion of the model is presented in this section and a more detailed presentation is provided in Section 1 of the ESI.†The presented snapshot model aims to optimise the planning and operation of the integrated power and heat system in a future target year. Regarding planning, the model determines investments for: (i) capacity expansion of generation and storage technologies and (ii) transmission expansion of the electricity network, while using initial infrastructure as a starting point. The optimisation of the system's operation includes the decisions for generation, resources' transportation and storage for the target year.
| Minimise TSC = TotCAPEX + TotOPEX | (1) |
As indicated by eqn (2) fixed capital costs include investments in generation and storage technologies (Capnewjg) as well as investments in the transmission and transportation infrastructure of the considered resources  . These costs are discounted by the capital recovery factors of each technology j ∈ J or transportation modes r ∈ R.
 | (2) |
The operating costs are presented in eqn (3). The total operating costs include the variable costs of generation and storage charging (Cvarj), storing energy carriers (Cstorj), fuel consumption (Cfuelf), interconnection imports (or exports as earnings for the system) (Cicih), curtailment costs (Ccurt) and the value of the lost load (VoLL) (CVoLL). Moreover, yearly costs regarding the carbon taxes (CCO2) and the O&M costs (COM,techj) of infrastructure are included as follows:
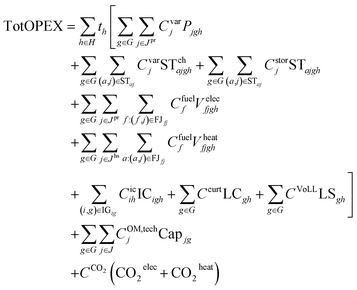 | (3) |
![[D with combining macron]](https://www.rsc.org/images/entities/i_char_0044_0304.gif) heatgh and can be satisfied by available heat fuels/resources. These resources are electricity, hydrogen and natural gas (Ahs = {Elec, H2, NG}). Thus, the breakdown of the heat requirements is determined by eqn (4):
heatgh and can be satisfied by available heat fuels/resources. These resources are electricity, hydrogen and natural gas (Ahs = {Elec, H2, NG}). Thus, the breakdown of the heat requirements is determined by eqn (4): | (4) |
The efficiencies of the end-use heat technologies determine the required net demands for the corresponding resources. For instance, the efficiency of natural gas-fueled or future hydrogen-fueled technologies (ηheatj) is assumed to be constant and equal to 90%.116 In contrast, the coefficient of performance of heat pumps (COPgh, dimensionless quantity), which consume electricity, can be estimated beforehand based on real-world data of the ambient temperature (ATgh in °C) using eqn (5) obtained by Vorushylo et al.:117
| COPgh = 0.0541ATgh + 2.6674, ∀g ∈ G h ∈ H | (5) |
(1) Production/generation: the energy content of a resource is produced/generated (Pjgh) by appropriate technologies or can be consumed by other technologies towards their conversion to other resources.
(2) Storage: a resource can be charged into the appropriate storage tank (STchajgh) and discharged out of it (STdisajgh).
(3) Distribution: bidirectional transmission or transportation of resources between the geographical regions (TRargg′h) is modelled. Interconnections to third countries (ICigh) are also considered only for electricity transmission.
Moreover, options such as RES load curtailment (LCgh) and load shedding (LSgh) are taken into consideration for the power system towards electricity demand satisfaction. Hence, a generalised formulation for the energy carriers' balances is presented in eqn (6):
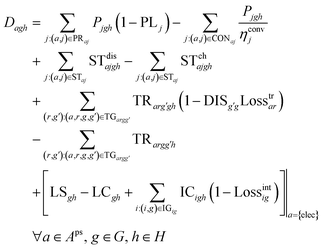 | (6) |
Particularly, sets PRaj and CONaj contain the information regarding the production or consumption of a resource a ∈ Aps from a process j ∈ Jps respectively. A visualisation of the process network is provided in Fig. 5.
![[D with combining macron]](https://www.rsc.org/images/entities/i_char_0044_0304.gif) elecgh) and the electricity towards heat requirements (Qajgh). The total demand is further increased by a fraction of distribution losses (DL), which quantifies the intrinsic losses in the distribution system. So, the net demand is defined in eqn (7):
elecgh) and the electricity towards heat requirements (Qajgh). The total demand is further increased by a fraction of distribution losses (DL), which quantifies the intrinsic losses in the distribution system. So, the net demand is defined in eqn (7): | (7) |
As solely heat requirements (Qajgh) may be satisfied by hydrogen, hydrogen's demand is defined as in eqn (8). Nonetheless, zero demand is defined for ammonia (eqn (9)), as its role pertains to assisting the system's optimal operation as an energy storage and transportation alternative.
 | (8) |
| Dagh = 0, ∀a ∈ {NH3}, g ∈ G, h ∈ H | (9) |
 | (10) |
Considering the de-rating factors of interconnection lines (DFinteri) and generation and storage technologies (DFj), the total de-rated capacity must exceed the system's peak increased by a capacity reserve margin factor (RM) as in eqn (11). In this work, as operating reserve modelling is neglected, a higher de-rated capacity margin equal to 7% is adopted.
 | (11) |
4 Case study: power and heat decarbonisation of the UK in 2040
4.1 Data preparation
The proposed model is tested for the planning of GB's energy system in the target year 2040 using real-world data profiles as for the year 2015 and information regarding the installed infrastructure as for the year 2020. The profiles of electricity demands for GB can be derived from the historical data of National Grid and the allocation of electricity demand to the local distribution zones is estimated via statistical data by DUKES.2,108 Additional profiles of heat demand are based on hourly natural gas consumption data obtained from GB's gas distribution companies and Charitopoulos et al.4 Both demands for the target year 2040 are calculated by projecting the data of the base year to the predicted demand values by National Grid Future Energy Scenarios (FES).118 In particular, the “System Transformation” scenario is employed. The total annual electricity demand is predicted to be 345 TW h and the total annual heat requirement is predicted to be 526 TW h according to estimations using data from CCC,97,112 and National Grid ESO118 while hourly profiles are adapted from Charitopoulos et al.4 Moreover, according to historical data, the level of distribution losses is set equal to 6.5% (DL = 0.065).108 Regarding RES availability (wind and solar) profiles, the Renewables.Ninja platform is employed to construct region specific datasets.119 Finally, profiles for the interconnected electricity prices are obtained by ENTSO-E and are projected to the target year using the corresponding scenario assumptions.105,120Regarding the initial infrastructure of the system, the capacities of generation, storage and electricity transmission technologies of the system are set as calculated for the year 2020 by BEIS.108 Moreover, the electricity interconnection capacities for 2040 are set according to existing and planned electricity interconnection lines between GB and interconnected countries, as found by Pöyry.58 As mentioned in Section 2.5, the adequacy of the power system could be satisfied with a reserve margin of de-rated electricity generation, storage and interconnection capacity. According to the sources, a capacity reserve margin factor of 7% is employed (RM = 0.07).77
Moreover, as the problem statement focuses on the system's decarbonisation, carbon goals for the future are calculated based on data from the UK's Sixth Carbon Budget report taking into consideration all involved sectors.112 Predictions on the related fuels' prices and carbon taxes are also reported in FES by National Grid ESO.118 While the availability of fuels is considered limitless, an upper bound is set only for the biomass feedstock according to CCC.114 The year 2015 is adopted as the climate basis year for the calibration of the model. The proposed model is implemented for the year 2015 taking account of the aforementioned datasets on the real GB power system with 2015 infrastructure data estimated by BEIS.108 The calibration of the model assists in the correction of parameters towards a flawless simulation of the real operation of 2015's power system. Thus, RES availability and interconnection availability are calibrated towards a perfect simulation of 2015 power system operation.
In the ESI† further discussion regarding the demand data (Section 2.1), spatio-temporal climate data (Section 2.2) and techno-economic data (Section 2.3) can be found.
4.2 Comparison of clustering approaches
As the first step, the performance of the proposed novel NPCTPC is evaluated and compared to the state-of-the-art methods. The comparison is conducted based on results regarding a simplified power system planning problem for a range of clustered sets, with an increasing number of clusters. The goal is to evaluate the approximation errors that the clustered sets impose on the solution of the planning problem compared to the solution of the problem employing the full-year data. This strategy is more systematic as it offers insight into the used clustering methodology for the real planning and operational problem instead of solely evaluating the statistical approximation of a clustered set to the full-year data. The investigated problem for this comparison is a simplified LP planning and operational optimisation problem, which takes into consideration only the level of the power system without alternative DEC pathways (i.e., it does not include H2 and NH3 pathways).In the context of this comparative analysis, a number of sets with an increasing number of clusters are generated to approximate the full-year data profiles using the three chronological clustering approaches (CTPC, PCTPC and the proposed NPCTPC). Then, the simplified LP planning problem is solved using each of the latter and the full-year data. The latter will be mentioned as “full-year” solution. Fig. 6 displays results regarding the approximation of the “full-year” solution from the reduced sets.
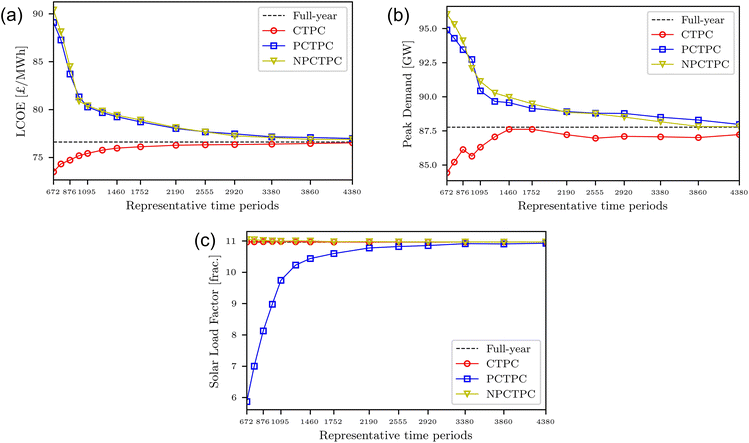 | ||
| Fig. 6 Comparison of chronological clustering approaches regarding: (a) levelised cost of electricity (LCOE), (b) peak demand and (c) solar farms load factor. | ||
As expected, for all approaches lower approximation errors are observed as the number of clusters in the sets increases. Moreover, the priority-based clustering approaches exhibit more conservative results. In other words, the problem's solution using sets of the latter approaches leads to higher objective values and LCOE for the cost minimisation problem (Fig. 6a).
The proposed NPCTPC clustering methodology displays the ability to better capture the peaks of demand as envisaged in the plot regarding the peak demand (Fig. 6b). The latter ability of NPCTPC leads to higher investments in electricity generation capacity (due to adequacy constraints) and ultimately leads to more conservative LCOE estimations. From both Fig. 6a and b, it is clear that there is a correlation between the system's peak demand and LCOE. Higher peak demands require more electricity generation capacity, which consequently increases the capital costs of the objective function. The conservative approach of NPCTPC is desirable when planning for the adequacy of the system. Moreover, NPCTPC slightly outperforms PCTPC regarding the peak demand approximation and leads to near perfect matching of the full space problem's objective value for sets with more clusters. Regarding the rest of the clustered parameters, PCTPC and NPCTPC behave similarly as visualised in Fig. 4 regarding the demands. Finally, although approximation errors are negligible regarding the wind farm load factors for all clustering approaches (approximation errors lower than 0.4% for wind load factors for the smallest set), PCTPC cannot capture efficiently the solar availability as shown in Fig. 6c. However, NPCTPC enhances the capture of solar availability similarly to the original CTPC. Ultimately, NPCTPC effectively integrates the advantages of both PCTPC towards a conservative planning and CTPC for the accurate approximation of all parameters regarding the renewable source availability profiles.
Ultimately, results indicate that the full-year setting (8760 hours) can be clustered efficiently leading to acceptable approximation errors regarding the objective value. For instance, time compression to 1/8 (1095 final clusters) leads to objective value approximation errors of around 5.5% for the investigated case study. An even lower approximation error of 3.6% is achieved for 1/6 time compression (1460 final clusters). Thus, such a significant and efficient time compression assists in the solution of more challenging problems within acceptable execution times.
4.3 Optimal planning and operation of the heat and power system
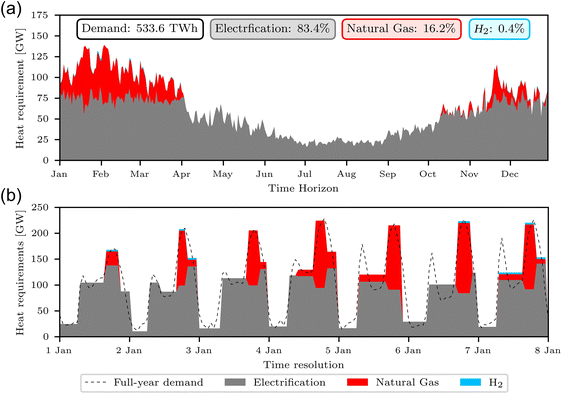
In this section, the results regarding the solution of the planning and operational optimisation problem using the LP snapshot model are demonstrated. The problem aims at planning and operational optimisation including hydrogen and ammonia pathways in the target year 2040. Regarding the time resolution, time compression to 1/6 is selected for the solution. So 1460 clusters of different durations are employed to represent the full-year data. Model execution is performed on a Dell workstation with an Intel® Core™ i9-10980XE CPU@3.00 GHz and 128.00 GB RAM. LP models are solved using solver GUROBI 9.5 in the modelling and optimisation suite GAMS 41.3.121,122 The investigated instances require 2–4 hours of computing time.First of all, heat fuel mix breakdown in 2040 is optimised through the model. In Fig. 7 the breakdown of the heat requirement mix in 2040 and the corresponding heat profiles are given. Heat electrification decisions are important for a future flexible system, while natural gas usage for heat decreases. The results demonstrate a high penetration of electrification in the heat sector, as 83.4% of the total requirement is satisfied by electricity. Lower consumption of natural gas at 16.2% is also necessary and this is a technically feasible scheme under the assumption that hybrid end-use heat technologies will be available. Finally, a very small amount of hydrogen for heat satisfaction, around 0.4% of the total heat requirement (![[D with combining macron]](https://www.rsc.org/images/entities/i_char_0044_0304.gif) heatgh), is determined by the optimisation model. It could be assumed that such a small amount could be blended in the natural gas stream.123
heatgh), is determined by the optimisation model. It could be assumed that such a small amount could be blended in the natural gas stream.123
Then, the annual profile of heat satisfaction indicates the seasonal role of natural gas for heat in future flexible systems' operation. Natural gas is mostly consumed during the winter months, while no natural gas consumption during the summer months is realised. In contrast to natural gas, heat electrification is the dominant heat pathway and maintains substantial demand satisfaction throughout the year (Fig. 7a). The weekly profile of heat satisfaction is also of particular interest as it displays the short-term dynamics of heat requirement satisfaction. Heat requirements are optimised and satisfied primarily by electrification, while smaller amounts of natural gas and even smaller amounts of hydrogen are necessary to meet the demand during the peak hours. Furthermore, from Fig. 7b the efficiency of the clustering, which captures the total heat requirement peaks and lows despite the time compression to 1/6, can be envisaged.
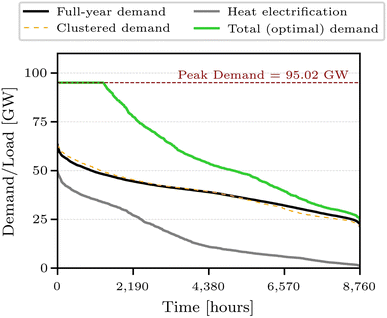
The deep electrification of the heat sector imposes a subsequent increase in electricity demand. However, the total demand is optimised towards the more flexible operation of the system. The load duration curves concerning the coupled power system are presented in Fig. 8.
Firstly, in Fig. 8 the good approximation of the clustered data to the full-year demand can be observed. As the chronological clustering approach does not lead to a radical reduction of the time resolution, the approximation of the original load duration curve does not display big deviations, which generally other time aggregation methods can result to. Only slight variations above the highest demands and below the lowest demands are observed. Then, the electricity demand due to heat electrification displays a wide range between 0 and 50 GW. However, electrified heat demand is optimised in parallel to the system's operation towards the flexibility of the system. The curve of the total (optimised) electricity demand indicates that the model optimises the peak demand at a value of 95.02 GW, in which a plateau in the load duration curve is observed. For a total of approximately 1600 hours, the total electricity demand remains close to this value. These results demonstrate that both the efficient modelling towards the system's flexibility and the adequacy of the system, which is immediately connected to the peak demand, are not affected by extreme events of electricity demand. In contrast, the optimisation model determines the appropriate peak demand and through sector coupling considerations the flexible handling of electricity demands below that value is achieved.
The significant increase in the total electricity demand must be accompanied by decisions for investments in electricity generation technologies and particularly in renewable technologies towards decarbonisation. Besides, the increased peak demand imposes new conditions regarding the adequacy of the system. The spatial capacity allocation, total electricity generation and DEC production mix for the year 2040 are determined by the model and are visualised in Fig. 9.
Regarding the capacity allocation, a varying allocation of renewable technologies is observed, which can be attributed to the adopted land availability and build rate constraints (Fig. 9a). With regard to Wind Offshore technologies, Scotland (SC) leads the installation with 14.3 GW till 2040. The majority of the rest of the wind offshore total capacity is installed in the southern parts of England, East Anglia (EA) and South Wales (SW), while smaller investments are made in Northern (NO) and North East (NE) England (total 5.1 GW). Solar technologies are also favorable for South East (SE) and West Midlands (WM) with a combined capacity of 22.5 GW from the total of 30 GW. For non-renewable technologies (Fig. 9b), we can observe that CCGTCCSs are installed in the regions with the highest demands (e.g., NT, NW and WM). Moreover, technologies like CCGTs are installed in many zones to contribute during peak hours and particularly over 5 GW are installed in NT, which has the highest share of electricity demand (14% of total demand). Regarding alternative pathways, small capacities of BGCCS are installed in many regions and are accompanied by Haber–Bosch processes and NH3CCGTs for the contribution of electricity back to the system. Particularly, unevenly large H2CCGT installations are found only in zones NO and NW, which do not contribute high loads but ensure the security of the system.
Eventually renewable energy sources play a crucial role in the generation mix and contribute approximately 82% of the generated load (Fig. 9c). In particular, offshore wind farms contribute 60% of the total output. Regarding thermal technologies, the less carbon-intensive CCGTCCS contributes 10% of the total generation, while the rest of the technologies contribute less than 3% each. Regarding DEC production, BGCCS contributes the majority of hydrogen produced in the country, while WE displays smaller production. Haber–Bosch also displays a significant production of 6.75 TW h. This amount is equivalent to approximately 1.3 MtNH3 (based on LHV) and it constitutes a reasonable amount compared to the global ammonia production which was over 150 MtNH3 in 2020.
It is important to note that even though for some technologies large capacities are installed, their generation or production output remains low. On the one hand, renewable technologies in general do not achieve high load factors because of their intermittent nature and the seasonality of RES. On the other hand, conventional technologies seem to achieve various values of generated output in spite of their capacities. In Fig. 9d, the load factors of all technologies against their installed capacities are visualised.
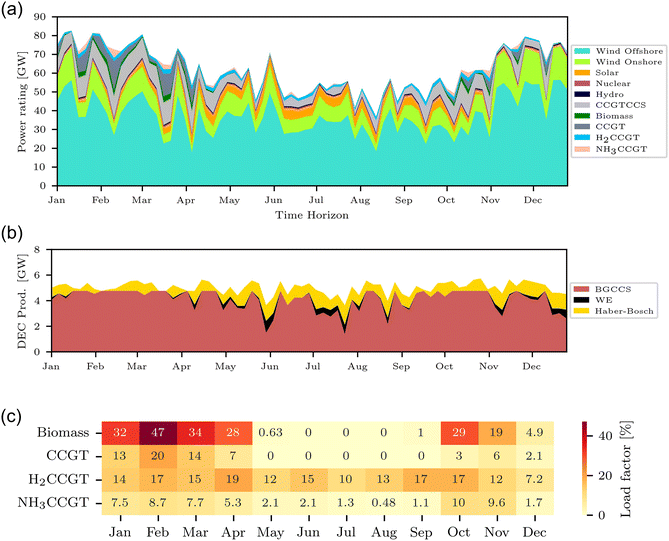
From conventional technologies, CCGTCCS and nuclear can provide sufficiently high loads constantly. Furthermore, biomass-fueled technologies such as BGCCS for hydrogen production display high load factors and so contribute to Net Zero goals via carbon capture and storage (CCS). Even though the remaining conventional generation technologies operate with lower load factors, their installed capacities are vital for the system's security considerations. Fig. 10c demonstrates that the operation of these peaking technologies is higher during the winter months (of high demands) and it is reduced close to 0% during the summer months for cost-efficient operation through the whole year (it is reminded that technologies' annualised capital costs are also considered in the objective function). From the investigated technologies, H2CCGT displays the least variability regarding its utilisation factor throughout the year.
Regarding the operation of the whole system, the full-year profiles of generation and production are envisaged in Fig. 10. Beyond the summarised results of Fig. 9, operation profiles are useful to identify seasonality patterns. With regard to electricity generation, although during the summer low generation rates from thermal technologies are observed, during the winter months the latter seem to contribute significantly (Fig. 10a). During the summer months electrified heat demand is reduced (as total heat requirements are decreased) and the higher solar irradiation assists in a higher grade to meet electricity demand. Regarding DEC production in Fig. 10b, hydrogen production slightly displays seasonality as BGCCS production is slightly reduced during the summer months. Hydrogen is produced throughout the year as it is also used throughout the year towards electricity generation (see H2CCGT in Fig. 10c). During the summer months hydrogen is used more for ammonia production and less for electricity generation. In contrast, a significant amount of ammonia is produced by HB throughout the year with a slight increase during the summer months, which occurs due to lower power and heat requirements and the higher solar availability. Even though ammonia production is higher during the summer, ammonia is stored during the summer months (see Fig. 11b) and it is consumed during the winter months (see NH3CCGT in Fig. 10c).
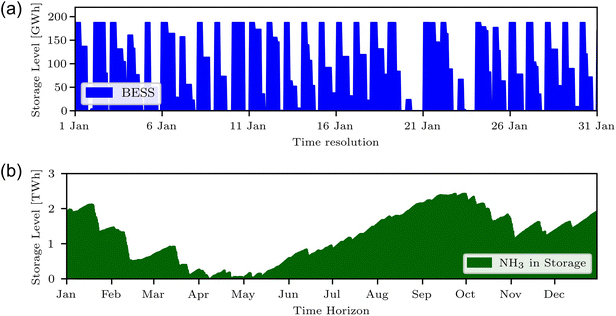 | ||
| Fig. 11 Storage level profiles of (a) batteries (BESS) over January and (b) ammonia over the full-year time horizon in 2040. | ||
Furthermore, optimised operation underpins the discrete roles of BESSs and ammonia for energy storage in the power system. Insights into the installed storage capacities indicate that 46.8 GW of BESS are necessary to be installed (BESS has a storage duration equal to 4 hours). On the other hand, 2.42 TW h maximum capacity of liquid ammonia storage is necessary (around 470k t NH3 using LHV). Finally, the optimisation model results in zero capacity for liquid hydrogen storage, even though the option for liquid hydrogen storage is available. In other words, produced hydrogen is immediately consumed either for electricity generation or for ammonia production or for heat satisfaction. Storage profiles regarding both BESS and ammonia storage technologies are presented in Fig. 11.
From the storage profile in Fig. 11a, it can be deduced that BESS is suitable for short-term daily energy storage. The high penetration of renewable generation imposes an increase in the installation of BESS and this is exploited for the daily storage of energy. Nonetheless, this is not the case for ammonia storage, which is suitable for long-term inter-seasonal storage. A significant amount of ammonia is fed to ammonia storage during the summer months and then it is contributed back to the system during the winter months (Fig. 11b).
Regarding transportation decisions, investments in the capacity of transmission and transportation modes regarding the resources are determined by the model. Only pipelines are considered for H2 and NH3 in the problem statement and a fractional investment can be determined. Thus, an approximated cost is estimated for the pipeline cost in order to approximate the levelised cost of DEC transportation. In Table 1, the investments in transportation infrastructure are reported. An interesting point is that transmission expansion is determined for regions with a high capacity of offshore wind farms, which is shown to be the biggest energy generation source in the future system. We observe that very small capacities regarding hydrogen and ammonia transportation are necessary. In particular, the maximum energy flows are negligible compared to the typical sizes of pipelines reported in the literature (see Table 1).14,41 Thus, H2 and NH3 may play a role as spatial energy vectors in decarbonisation but the transported quantities indicate that more transportation modes such as trucks or trails must be considered in studies in the future.
| Resource | Transportation mode | Connection | Installed capacity [MW] | Maximum capacity [MW] |
|---|---|---|---|---|
| Electricity | Transmission line | NO ↔ SC | 4000 | 4000 |
| Electricity | Transmission line | NT ↔ SE | 2290 | 4000 |
| Electricity | Transmission line | EM ↔ NE | 876 | 4000 |
| H2 | Pipeline | NO ↔ SC | 52.5 | 2284 |
| H2 | Pipeline | WN ↔ WS | 21.9 | 2284 |
| NH3 | Pipeline | SW ↔ WS | 7.9 | 400 |
| NH3 | Pipeline | NW ↔ WM | 7.8 | 400 |
| NH3 | Pipeline | NO ↔ NW | 2.0 | 400 |
| NH3 | Pipeline | WM ↔ WN | 0.66 | 400 |
| NH3 | Pipeline | WN ↔ WS | 0.22 | 400 |
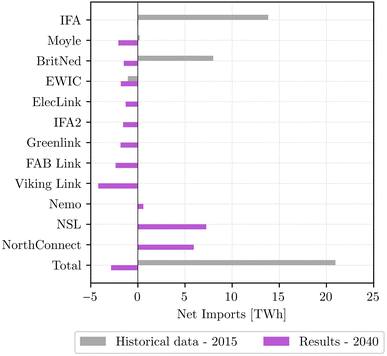
In this context, electricity transmission from or to interconnected third countries additionally contributes to the flexibility and the balance of the system. The optimal solution indicates 2.83 TW h of net exports to third countries. In Fig. 12 are given the net imports regarding the interconnectors in 2015 and 2040. For 2040 the model's results demonstrate net exports to all third counties apart from some interconnectors in Norway and Belgium. GB's power system will be converted from an importer of electricity to an exporter. However, it is noted that these results neglect possible developments in the interconnected countries and only consider predictions regarding the levelised costs of electricity by ENTSO-E.120 Generally, the extension of GB's transmission to net exporters can depend on both the expansion of RES and the integration of alternative pathways (e.g., ammonia), which reduce the levelised cost of electricity.
Ultimately, the LP snapshot model optimises the planning and operation decisions with a total annualised cost of 39.31 £B (Billion British Pounds Sterling). The carbon intensity of the system is drastically enhanced as the goal from CCC for 7.88 MtCO2 net emissions for the system of the case study (see Fig. 1 and 2) in 2040 is achieved. The average levelised cost of electricity is calculated to be £76.9 per MW h supplied in 2040 (omitting heat fuel costs, i.e., natural gas for heat; £40.3 per MW h in 2015), while the average carbon-intensive is estimated to be as low as 13.5 kgCO2 MW h−1 (356.9 kgCO2 MW h−1 in 2015). Duration curves regarding the electricity price and carbon intensity are visualised in Fig. 13.
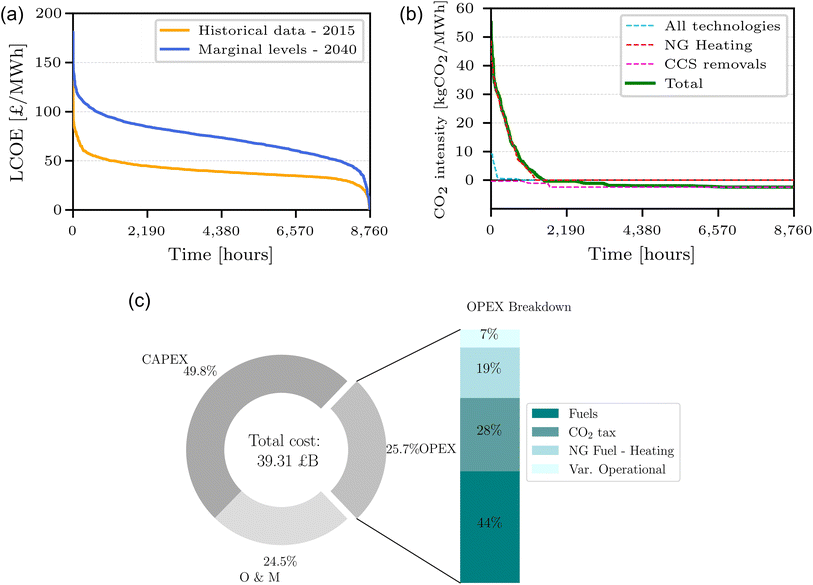 | ||
| Fig. 13 Model's results for 2040 regarding: (a) LCOE duration curve (and comparison to 2015), (b) carbon intensity duration curves and (c) breakdown of total system's cost. | ||
In Fig. 13a, quite similar LCOE duration curves for years 2015 and 2040 are observed, although a higher average LCOE value is estimated for 2040. This result is also interesting if we compare it with the load duration curve of coupled power and heat systems in Fig. 8. Although the load curve has changed for 2040 and displays a plateau on the peak demand, the LCOE duration curve remains similar to the one of 2015 with the assistance of BESS and ammonia storage installations. At this point, it is noted that for the calculation of the marginal values regarding the LCOE the costs for heating using natural gas (i.e., cost of heat fuels) and the potential profits or expenditures due to the interconnections are neglected. Nevertheless, the costs for hydrogen and ammonia production and storage are encompassed in the calculations. The total considered costs are divided by the total electricity demand satisfied.
Finally, the carbon intensity of the system displays negative values for more than half of the time resolution (Fig. 13b). This can be attributed to CCS removal due to the constant operation of BGCCS at high loads, which contributes to a negative carbon budget. The high values of carbon intensity can be mostly due to natural gas consumption for heating (NG heating) as its duration curve coincides with the total carbon intensity's duration curve. Finally, the rest of the generation and production technologies display a reduced carbon intensity, which reaches a maximum of just 10 kgCO2 MW h−1. These low values are achieved through higher penetration of RES and lower utilisation of conventional technologies (as load factors indicated). The total balance regarding carbon emissions is reported in Table 2. Finally, a breakdown of the total cost of 39.31 £B is given in Fig. 13c.
| Sectors | Contribution | Carbon emissions [Mt CO2] |
|---|---|---|
| All technologies | (+) | 6.966 |
| Natural gas – heating | (+) | 19.412 |
| CCS removal | (−) | 18.503 |
| Total (Net Zero goal) | 7.875 |
The interesting insight into the results in Fig. 13c concerns the ratio between capital and operational costs. In particular, CAPEX constitutes almost 50% of the total cost, while the costs for fuels' consumption are much lower (in spite of being a bigger part of the cost during the last few decades). So, these results confirm the predictions that the system's cost in the future will be less dependent on the marginal fossil fuel prices and more dependent on the capital costs and the strategic planning.
4.4 Scenario analysis: elucidating the value of ammonia in combined heat and power decarbonisation
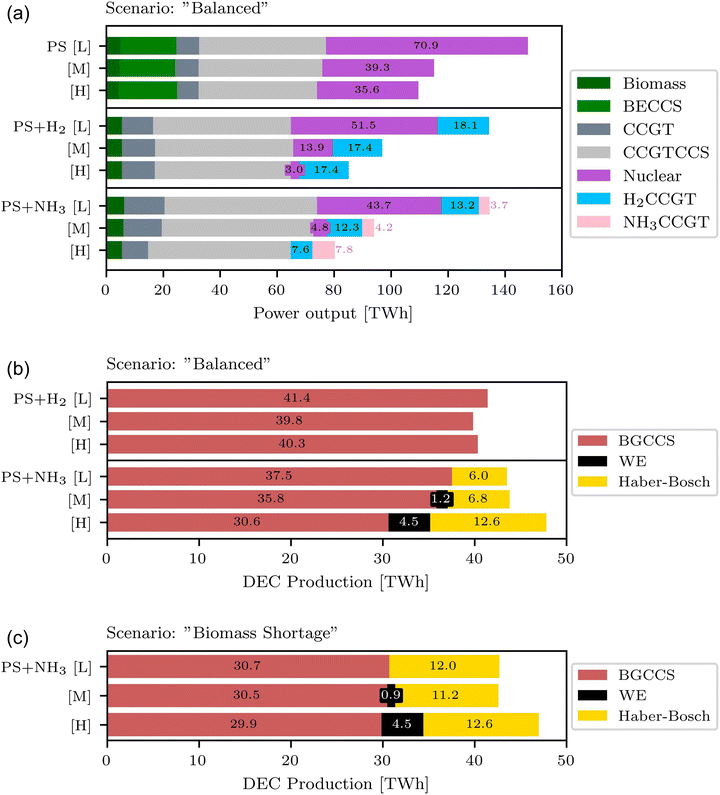
Ammonia plays a significant role in the system and a total storage capacity of 2.4 TW h is predicted for optimal operation for the investigated case study. In this section, the role of ammonia and hydrogen for the power system under various scenarios is evaluated. In particular, scenarios regarding the build rates of technology capacities, the load factors of renewable wind technologies and the availability of biomass feedstock are examined.Using both statistical analysis from historical data and assumptions of the UK's governmental organisations, the scenarios regarding the build rates are constructed.108,124 Our main scenario is named “Balanced” and is also used for the solution of the problem in Section 4.3. Three alternative scenarios are constructed based on the prediction for innovation or slow progression on the installation of certain types of technologies: (i) “RES Innovation” (RES technologies are implemented with high growth while the rest display slow progression), (ii) “NonRES Innovation” (alternative NonRES technologies are implemented with high growth while the rest display slow progression), and (iii) “CCS Slow Progression” (all technologies are implemented with high growth apart from CCS technologies). Finally, the “Balanced” scenario of build rates is combined with pessimistic predictions for biomass availability to create the “Biomass Shortage” scenario.
Another level of analysis is introduced to explore the uncertainty regarding the efficiency and consequently the load factors of RES technologies. Hence, three cases of high, mid and low load factors are introduced, denoted as “L”, “M” and “H” cases, respectively. These cases mainly capture the uncertainty of wind farm load factors for the future.84
Finally, in order to capture the incremental role of DECs for the power system, the analysis is conducted for three planning levels: (i) the power system without hydrogen and ammonia pathways (“PS”), (ii) the power system integrating the hydrogen pathway only (“PS + H2”), and (iii) the power system integrating both hydrogen and ammonia pathways (“PS + NH3”). For a fair comparative analysis along the planning levels, the total capacity of non-renewable electricity generation capacities is constrained by the cumulative build rate limit of the corresponding technologies (technologies included are Biomass, BECCS, all CCGTs and Nuclear).
Initially, results on the 5 scenarios and the “M” case of wind load factors are presented. In this analysis, the value of the integrated pathway is assessed by studying the three planning levels. Results on performance indicators are presented in Fig. 14a. We observe an incremental reduction in the levelised cost with the integration of H2 and NH3 pathways, which means that each of the latter pathways is beneficial for cost-efficient system-wide operation. Focusing on the “Balanced” scenario, H2 and NH3 pathway integration into “PS” leads to 1.6 and 2.5 £ per MW h reduction in the LCOE, respectively. This is consistent for all scenarios and so DEC integration seems to be a reliable option regardless of slight deviations in the expected technological developments for new technologies. In parallel, NH3 pathways assist heavily and consistently in the handling of higher peak demands. As demonstrated in Section 4.3, a higher peak demand for the wide system can be interpreted as a higher rate of heat electrification. Such an asset is very crucial, as a less carbon-intensive heat sector consuming electricity instead of natural gas can lift a burden towards deep decarbonisation. Finally, an interesting trend concerns the net exports of the system, which are high for the simple “PS” system that cannot efficiently handle the excessive and cheap renewable energy. However, the integration of alternative pathways leads to a reduction in net exports as the excessive energy is cost-efficiently exploited by the DEC pathways.
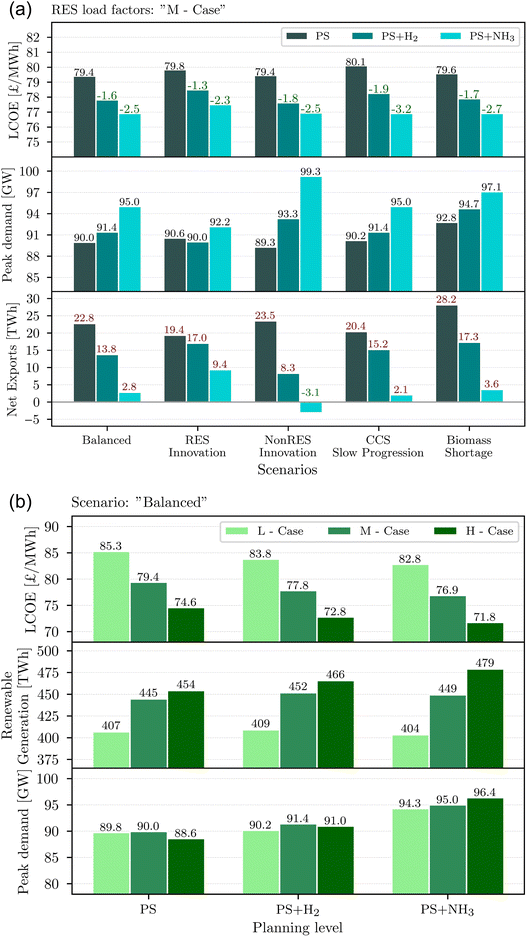 | ||
| Fig. 14 Scenario analysis for the case study of GB in 2040 over: (a) various build rate scenarios and the planning levels and (b) the planning levels and RES load factors for “Balanced” scenario. | ||
Focusing on the “Balanced” scenario of build rates, an analysis against the cases concerning the efficiency of the renewable generation technologies is conducted. Indicative results for the three planning levels are presented in Fig. 14b. It seems that the efficiency of RES affects the value of LCOE to a greater extent than the integration of alternative pathways. However the NH3 pathway proves to be beneficial in any case leading to the minimum LCOE. Meanwhile in the “L” case, the integration of the NH3 pathway leads to a 2.4 £ per MW h reduction compared to “PS”, and the corresponding decrease is 2.8 £ per MW h in the “H” case. Besides, as it is demonstrated in Fig. 14b, the renewable generation in the “H” case is significantly higher for “PS + NH3” system compared to the more plain systems. However, the reduced LCOE values are not owed exclusively to higher renewable penetration. The results indicate that when the ammonia pathway is integrated, higher peak demands are achieved for the system. This is particularly significant for the coupled system as a bigger part of heat requirements can be satisfied by heat electrification. The impact of peak demand increase on the carbon-intensive heat sector is evaluated using Fig. 15.
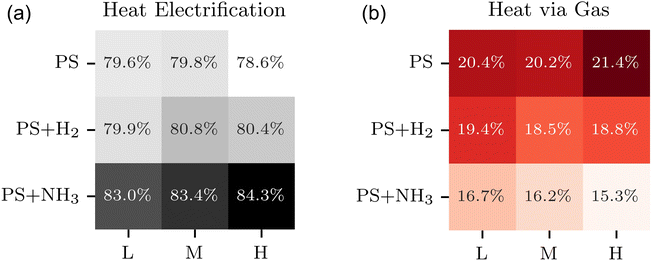 | ||
| Fig. 15 Heat requirements satisfaction ratios by (a) electrification and (b) natural gas consumption over the planning levels and RES load factor cases for the “Balanced” scenario. | ||
According to the results, it is clear that independently of the considered planning level, high rates of heat electrification (78 to 85%) are beneficial for the system's operation towards decarbonisation. Especially for the “PS + NH3” system, there is a correlation between the optimised peak demand and the heat electrification rate for the cases of increasing renewable generation. For “PS + NH3” system only 0.4% of heat requirement is satisfied by H2 and the rest is met by natural gas (Fig. 15b). Ammonia integration in the system significantly increases the heat electrification ratio assisting in cost-efficient decarbonisation of the coupled system by exploiting NH3 stored energy.
As renewable generation is increased in the investigated cases, the electricity generation mix is also affected. The generation mix of the NonRES technologies and the mix of DEC production technologies among the aforementioned scenarios and planning levels are presented in Fig. 16.
Focusing on the trends visualised in Fig. 16, the total generation output decreases as DECs are integrated into the system. Moreover, the efficient consumption of available biomass fuel constitutes a critical issue for decarbonisation. In Fig. 16a and b, although BECCS generation is high for the “PS” system, when DECs are integrated into the system, BGCCS towards hydrogen production is selected. With ammonia integration, BGCCS utilisation is slightly reduced as ammonia production (via Haber–Bosch) is increased contributing to long-term inter-seasonal storage. Regarding the utilisation of the rest of the technologies along the planning levels, all of them apart from nuclear do not display any extreme deviation in their utilisation. Nuclear generation displays a decreased output load both as DECs are introduced into the system and as the renewable generation is increased.
To complement these findings, an analysis of the deviations of the generation mix owed to increase of RES load factors seems also very helpful. In Fig. 16b, while the BGCCS production rate is reduced for higher RES load factors, ammonia production emerges to exploit the available renewable energy. Similar patterns are observed for the total generation of NonRES technologies, which is reduced for higher load factors in contrast to the renewable generation in Fig. 14b. Nuclear generation displays the biggest decrease along with the growth of load factors and it does not contribute at all in the “H Case” of ammonia planning. Overall, there exists a trade-off between nuclear and renewable generation. In contrast to nuclear generation, NH3 production increases as renewable generation increases.
In the aforementioned scenarios, the importance of biomass technologies towards decarbonisation of the systems is shown, as they contribute carbon-free energy. Although the availability of biomass fuels is considered limited, it is excessive for the operation of the system for the “Balanced” scenario and optimal solutions are not affected. Thus, of particular interest is the “Biomass Shortage” scenario, in Fig. 16c, in which the deficiency of biomass feedstock affects the decisions for the system. In particular, an important decrease in the dominant BGCCS production rate is observed for all cases of RES load factors. However, the ammonia production rates (through Haber–Bosch) are significantly increased for all load factor scenarios.
From the aforementioned analysis, it is clear that H2 and further NH3 integration in the wide system enhance its operation in many ways: the levelised cost of electricity generation is reduced, renewable energy may be exploited in higher grades, higher peak demands of the system can be supported and consequently higher ratios of heat electrification can be achieved. As the latter results concern the “Balanced” scenario, extended results for the rest of the scenarios are demonstrated in Fig. 17. As discussed for the “Balanced” scenario, similar patterns are observed for the rest of the scenarios. The NH3 pathway is generally selected by the optimisation model across all scenarios and particularly for the “Biomass Shortage” scenario over 5 TW h of NH3 storage are necessary. Besides, for higher cases of RES load factors, the system requires higher ammonia storage capacities in almost all scenarios. Moreover, independently of the planning level, scenario and RES load factor case, a high electrification ratio of around 80% is beneficial for the system's operation. These results summarise in detail the importance of heat electrification and the role of ammonia for the power system in order to exploit a part of the excessive renewable energy by cost-efficient long-term inter-seasonal energy storage in coupled power and heat systems.
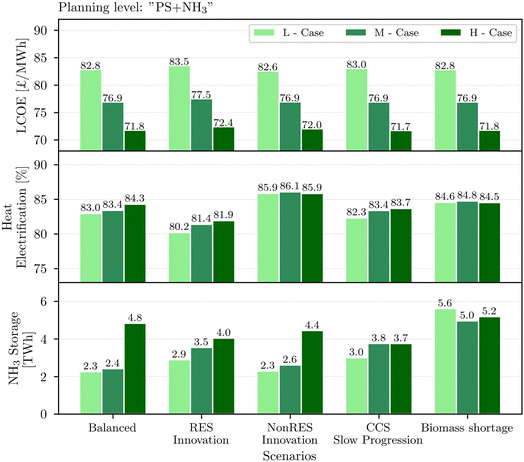 | ||
| Fig. 17 Scenario analysis over built rate scenarios and load factor cases for the “PS + NH3” system. | ||
5 Conclusions and outlook
The proposed spatially explicit snapshot model's results for optimal power system planning and operation demonstrate the significant role of ammonia as an energy vector in the UK's decarbonisation. The value of the ammonia pathway has also been underpinned through a number of scenarios of various build rates, biomass availability and load factors, for which the integration of the ammonia pathway can lead to 3–4% reduction in the LCOE compared to a plain power system. The need for 2.3 to 5.6 TW h of ammonia storage over all scenarios exhibits its significant role in long-term inter-seasonal energy storage. Besides the detailed storage profile and operation of the system are efficiently captured by employing a compressed temporal resolution via the proposed novel chronological time-period clustering. Overall, the coupled power and heat system integrating the ammonia pathway requires at least around 80% electrification of the heat sector and high penetration of renewable technologies, which consistently generate over 70% of total electricity output. The role of heat electrification is vital for the flexibility of the power system operation, in order to efficiently handle peak demand events and finally to decarbonise the system even for scenarios of biomass fuel shortage.In general, this work demonstrates the role of a low-carbon DEC like ammonia in the long-term inter-seasonal storage of renewable or hydrogen-based energy within Great Britain's nationwide power system. However, the extension of hydrogen and DEC penetration in the power grid and the timescale of this change remain questionable and dependent on the UK's adopted policies and the incentives to decorbanise its power grid. For instance, UK aims for 5–10 GW capacity of low-carbon hydrogen production by 2030 in order to achieve its Net Zero goals and some investments are at the initial stages.88 The achievement of this goal is interdependent with other actions that take place in parallel in the UK such as heat sector transformation,96 investments in BESS,98 developments in CCS systems87 and even any possible governmental decision for softening of Net Zero goals. Assuming that the hydrogen economy will succeed in the UK, further establishment of a low-carbon ammonia economy would mostly depend on the commercial availability of NOx emission mitigation technologies for ammonia combustion or decomposition as discussed in Section 2.3. Then, the ammonia economy is quite probable as it displays competitive advantages compared to other DECs due to optimised and cost-effective production on a large-scale, global supply chain infrastructure and potential use as shipping fuel by 2050.46,125 In the UK, Supercritical's “GreenNH3” project investigates the production of low cost green hydrogen, via Supercritical's proprietary electrolyser, and uses this as feed for ammonia production, via the traditional Haber–Bosch. Supercritical's project forecasts a levelised cost of green ammonia lower than £1500 per tonne by 2030 (using solar and offshore wind power purchase agreements). So the project aims to supply 5.6 TW h of green hydrogen to the market or green ammonia production by 2030.91
Future research work is necessary to further evaluate the role of ammonia in power systems. For instance, the complexity of the problem statement and the fine-grained spatio-temporal resolution increase the computational complexity and do not allow the implementation of unit commitment constraints using a monolithic solution approach. As unit commitment is very important for the scheduling in capacity expansion models and particularly for the Haber–Bosch process, future work focuses on the inclusion of unit commitment considerations for the coupled system integrating DECs.51,126,127 Finally, as a lot of sources of uncertainty (e.g., maturity of technologies, techno-economic data, climate data, and policies) could affect the solution of a power system optimisation model,128,129 and the assessment of the value of hydrogen and ammonia pathways for the wide system using stochastic programming is set as a future goal. Extensions of the work to account for various energy carriers within the capacity expansion planning problem would offer an interesting economic comparison of DECs for the power system.
Abbreviations
| ASU | Air separation unit |
| BE | Biomass for electricity generation |
| BECCS | Biomass for electricity generation with CCS |
| BESS | Battery energy storage systems |
| BGCCS | Biomass gasification for H2 production with CCS |
| CEP | Capacity expansion planning |
| CTPC | Chronological time-period clustering |
| CCGT | Combined cycle gas turbine |
| CCGTCCS | Combined cycle gas turbine with CCS |
| CCS | Carbon capture and storage |
| DEC | Dense energy carrier |
| H2CCGT | H2-fueled combined cycle gas turbine |
| HB | Haber–Bosch process |
| GB | Great Britain |
| LCOE | Levelised cost of electricity |
| LP | Linear programming |
| LDZ | Local distribution zone |
| LOHC | Liquid organic hydrogen carrier |
| MILP | Mixed-integer linear programming |
| NG | Natural gas |
| NH3CCGT | NH3-fueled combined cycle gas turbine |
| NPCTPC | New priority chronological time-period clustering |
| PCTPC | Priority chronological time-period clustering |
| PV | Photovoltaics |
| RES | Renewable energy sources |
| SCR | Selective catalytic reduction |
| SMRCCS | Steam methane reforming with CCS |
| TES | Thermal energy storage |
| UK | United Kingdom |
| WE | Water electrolysis |
| £ | Billion British Pounds Sterling |
Author contributions
Georgios L. Bounitsis: conceptualisation, methodology, investigation, formal analysis, data curation, writing – original draft, and visualisation. Vassilis M. Charitopoulos: conceptualisation, methodology, writing – review & editing, investigation, supervision, and funding acquisition.Conflicts of interest
The authors declare no competing interests.Acknowledgements
Financial support from the EPSRC (under projects EP/T022930/1 and EP/V051008/1) is gratefully acknowledged.Notes and references
- S. J. Davis, N. S. Lewis, M. Shaner, S. Aggarwal, D. Arent, I. L. Azevedo, S. M. Benson, T. Bradley, J. Brouwer, Y. M. Chiang, C. T. Clack, A. Cohen, S. Doig, J. Edmonds, P. Fennell, C. B. Field, B. Hannegan, B. M. Hodge, M. I. Hoffert, E. Ingersoll, P. Jaramillo, K. S. Lackner, K. J. Mach, M. Mastrandrea, J. Ogden, P. F. Peterson, D. L. Sanchez, D. Sperling, J. Stagner, J. E. Trancik, C. J. Yang and K. Caldeira, Science, 2018, 360, 6396 CrossRef PubMed.
- National Grid ESO, National Grid ESO Data Portal, 2023, https://www.nationalgrideso.com/data-portal, accessed October 2023 Search PubMed.
- N. E. Koltsaklis and A. S. Dagoumas, Appl. Energy, 2018, 230, 563–589 CrossRef.
- V. M. Charitopoulos, M. Fajardy, C. K. Chyong and D. M. Reiner, iScience, 2023, 26, 108239 CrossRef PubMed.
- A. S. Dagoumas and N. E. Koltsaklis, Appl. Energy, 2019, 242, 1573–1587 CrossRef.
- LCP, Renewable curtailment and the role of long duration storage, 2022, https://www.drax.com/wp-content/uploads/2022/06/Drax-LCP-Renewable-curtailment-report-1.pdf, accessed October 2023 Search PubMed.
- F. J. de Sisternes, J. D. Jenkins and A. Botterud, Appl. Energy, 2016, 175, 368–379 CrossRef.
- R. Hemmati, R. A. Hooshmand and A. Khodabakhshian, Renewable Sustainable Energy Rev., 2013, 23, 312–319 CrossRef.
- J. Atherton, J. Akroyd, F. Farazi, S. Mosbach, M. Q. Lim and M. Kraft, Energy Environ. Sci., 2023, 16, 4020–4040 RSC.
- M. A. Pellow, C. J. Emmott, C. J. Barnhart and S. M. Benson, Energy Environ. Sci., 2015, 8, 1938–1952 RSC.
- R. Lan, J. T. Irvine and S. Tao, Int. J. Hydrogen Energy, 2012, 37, 1482–1494 CrossRef CAS.
- N. Salmon and R. Bañares-Alcántara, Sustainable Energy Fuels, 2021, 5, 2814–2839 RSC.
- S. Wu, N. Salmon, M. M. J. Li, R. Bañares-Alcántara and S. C. E. Tsang, ACS Energy Lett., 2022, 7, 1021–1033 CrossRef CAS.
- A. Valera-Medina and R. Bãnares-Alcántara, Techno-economic challenges of green ammonia as energy vector, Academic Press, 2021 Search PubMed.
- C. Smith, A. K. Hill and L. Torrente-Murciano, Energy Environ. Sci., 2020, 13, 331–344 RSC.
- S. Pfenninger, A. Hawkes and J. Keirstead, Renewable Sustainable Energy Rev., 2014, 33, 74–86 CrossRef.
- S. Pineda and J. M. Morales, IEEE Trans. Power Syst., 2018, 33, 7162–7170 Search PubMed.
- V. Oree, S. Z. Sayed Hassen and P. J. Fleming, Renewable Sustainable Energy Rev., 2017, 69, 790–803 CrossRef.
- T. Klatzer, U. Bachhiesl and S. Wogrin, Int. J. Hydrogen Energy, 2022, 47, 20585–20603 CrossRef CAS.
- T. Levin, J. Bistline, R. Sioshansi, W. J. Cole, J. Kwon, S. P. Burger, G. W. Crabtree, J. D. Jenkins, R. O'Neil, M. Korpås, S. Wogrin, B. F. Hobbs, R. Rosner, V. Srinivasan and A. Botterud, Nat. Energy, 2023, 2023, 1–10 Search PubMed.
- K. Poncelet, E. Delarue, D. Six, J. Duerinck and W. D’haeseleer, Appl. Energy, 2016, 162, 631–643 CrossRef.
- M. Hoffmann, L. Kotzur, D. Stolten and M. Robinius, Energies, 2020, 13, 641 CrossRef.
- H. Teichgraeber and A. R. Brandt, Renewable Sustainable Energy Rev., 2022, 157, 111984 CrossRef.
- K. Poncelet, H. Hoschle, E. Delarue, A. Virag and W. Drhaeseleer, IEEE Trans. Power Syst., 2017, 32, 1936–1948 Search PubMed.
- W. W. Tso, C. D. Demirhan, C. F. Heuberger, J. B. Powell and E. N. Pistikopoulos, Appl. Energy, 2020, 270, 115190 CrossRef.
- L. Kotzur, P. Markewitz, M. Robinius and D. Stolten, Renewable Energy, 2018, 117, 474–487 CrossRef.
- S. Gonzato, K. Bruninx and E. Delarue, Appl. Energy, 2021, 298, 117168 CrossRef.
- J. H. Ward, J. Am. Stat. Assoc., 1963, 58, 236–244 CrossRef.
- N. E. Koltsaklis, A. S. Dagoumas, G. M. Kopanos, E. N. Pistikopoulos and M. C. Georgiadis, Appl. Energy, 2014, 115, 456–482 CrossRef.
- C. L. Lara, D. S. Mallapragada, D. J. Papageorgiou, A. Venkatesh and I. E. Grossmann, European Journal of Operational Research, 2018, 271, 1037–1054 CrossRef.
- C. F. Heuberger, E. S. Rubin, I. Staffell, N. Shah and N. Mac Dowell, Appl. Energy, 2017, 204, 831–845 CrossRef.
- M. Chaudry, N. Jenkins, M. Qadrdan and J. Wu, Appl. Energy, 2014, 113, 1171–1187 CrossRef.
- P. Hoseinpoori, A. V. Olympios, C. N. Markides, J. Woods and N. Shah, Energy Convers. Manage., 2022, 268, 115952 CrossRef.
- S. Wogrin and D. F. Gayme, IEEE Trans. Power Syst., 2015, 30, 3304–3313 Search PubMed.
- A. Blakers, M. Stocks, B. Lu and C. Cheng, Prog. Energy, 2021, 3, 022003 CrossRef.
- C. Ganzer, Y. W. Pratama and N. M. Dowell, Int. J. Greenhouse Gas Control, 2022, 120, 103740 CrossRef CAS.
- G. He, D. S. Mallapragada, A. Bose, C. F. Heuberger-Austin and E. Gençer, Energy Environ. Sci., 2021, 14, 4635–4646 RSC.
- M. Victoria, K. Zhu, T. Brown, G. B. Andresen and M. Greiner, Energy Convers. Manage., 2019, 201, 111977 CrossRef.
- E. F. Bødal, D. Mallapragada, A. Botterud and M. Korpås, Int. J. Hydrogen Energy, 2020, 45, 32899–32915 CrossRef.
- S. Samsatli, I. Staffell and N. J. Samsatli, Int. J. Hydrogen Energy, 2016, 41, 447–475 CrossRef CAS.
- M. Moreno-Benito, P. Agnolucci and L. G. Papageorgiou, Comput. Chem. Eng., 2017, 102, 110–127 CrossRef CAS.
- S. Samsatli and N. J. Samsatli, Appl. Energy, 2019, 233–234, 854–893 CrossRef.
- G. He, D. S. Mallapragada, A. Bose, C. F. Heuberger and E. Gencer, IEEE Transactions on Sustainable Energy, 2021, 12, 1730–1740 Search PubMed.
- M. E. Efthymiadou, V. M. Charitopoulos and L. G. Papageorgiou, Chem. Eng. Res. Des., 2024, 204, 121–136 CrossRef CAS.
- N. Sunny, N. Mac Dowell and N. Shah, Energy Environ. Sci., 2020, 13, 4204–4224 RSC.
- D. R. MacFarlane, P. V. Cherepanov, J. Choi, B. H. Suryanto, R. Y. Hodgetts, J. M. Bakker, F. M. Ferrero Vallana and A. N. Simonov, Joule, 2020, 4, 1186–1205 CrossRef CAS.
- IEA, Ammonia Technology Roadmap, 2021, https://www.iea.org/reports/ammonia-technology-roadmap, accessed October 2023 Search PubMed.
- M. Fasihi, R. Weiss, J. Savolainen and C. Breyer, Appl. Energy, 2021, 294, 116170 CrossRef CAS.
- J. Ikäheimo, J. Kiviluoma, R. Weiss and H. Holttinen, Int. J. Hydrogen Energy, 2018, 43, 17295–17308 CrossRef.
- A. Allman, M. J. Palys and P. Daoutidis, AIChE J., 2019, 65, e16434 CrossRef.
- J. Armijo and C. Philibert, Int. J. Hydrogen Energy, 2020, 45, 1541–1558 CrossRef CAS.
- M. J. Palys and P. Daoutidis, Comput. Chem. Eng., 2020, 136, 106785 CrossRef CAS.
- R. Nayak-Luke, R. Bañares-Alcántara and I. Wilkinson, Ind. Eng. Chem. Res., 2018, 57, 14607–14616 CrossRef CAS.
- Z. Cesaro, M. Ives, R. Nayak-Luke, M. Mason and R. Bañares-Alcántara, Appl. Energy, 2021, 282, 116009 CrossRef CAS.
- N. Salmon and R. Bañares-Alcántara, J. Cleaner Prod., 2022, 367, 133045 CrossRef CAS.
- A. Allman, P. Daoutidis, D. Tiffany and S. Kelley, AIChE J., 2017, 63, 4390–4402 CrossRef CAS.
- W. W. Tso, C. D. Demirhan, S. Lee, H. Song, J. B. Powell and E. N. Pistikopoulos, Comput.-Aided Chem. Eng., 2019, 47, 1–6 CAS.
- Pöyry, Costs and Benefits of GB Interconnection, 2016 Search PubMed.
- M. Niermann, S. Drünert, M. Kaltschmitt and K. Bonhoff, Energy Environ. Sci., 2019, 12, 290–307 RSC.
- M. Niermann, A. Beckendorff, M. Kaltschmitt and K. Bonhoff, Int. J. Hydrogen Energy, 2019, 44, 6631–6654 CrossRef CAS.
- P. T. Aakko-Saksa, C. Cook, J. Kiviaho and T. Repo, J. Power Sources, 2018, 396, 803–823 CrossRef CAS.
- Z. Abdin, C. Tang, Y. Liu and K. Catchpole, iScience, 2021, 24, 102966 CrossRef CAS PubMed.
- P. Perreault, L. Van Hoecke, H. Pourfallah, N. B. Kummamuru, C. R. Boruntea and P. Preuster, Curr. Opin. Green Sustainable Chem., 2023, 41, 100836 CrossRef CAS.
- C. Hank, A. Sternberg, N. Köppel, M. Holst, T. Smolinka, A. Schaadt, C. Hebling and H. M. Henning, Sustainable Energy Fuels, 2020, 4, 2256–2273 RSC.
- A. T. Wijayanta, T. Oda, C. W. Purnomo, T. Kashiwagi and M. Aziz, Int. J. Hydrogen Energy, 2019, 44, 15026–15044 CrossRef CAS.
- A. Valera-Medina, H. Xiao, M. Owen-Jones, W. I. David and P. J. Bowen, Prog. Energy Combust. Sci., 2018, 69, 63–102 CrossRef.
- H. Kobayashi, A. Hayakawa, K. D. A. Somarathne and E. C. Okafor, Proc. Combust. Inst., 2019, 37, 109–133 CrossRef CAS.
- M. Aziz, F. B. Juangsa, A. R. Irhamna, A. R. Irsyad, H. Hariana and A. Darmawan, J. Energy Inst., 2023, 111, 101365 CrossRef CAS.
- Y. Bicer and I. Dincer, J. Cleaner Prod., 2018, 170, 1594–1601 CrossRef CAS.
- K. D. K. A. Somarathne, S. Colson, A. Hayakawa and H. Kobayashi, Combust. Theory Modell., 2018, 22, 973–997 CrossRef CAS.
- K. D. K. A. Somarathne, S. Hatakeyama, A. Hayakawa and H. Kobayashi, Int. J. Hydrogen Energy, 2017, 42, 27388–27399 CrossRef CAS.
- N. A. Hussein, A. Valera-Medina and A. S. Alsaegh, Energy Procedia, 2019, 158, 2305–2310 CrossRef CAS.
- G. Jeerh, M. Zhang and S. Tao, J. Mater. Chem. A, 2021, 9, 727–752 RSC.
- M. H. Industries, MHI Succeeded Combustion Test of Ammonia Single-Fuel Burners, 2023, https://www.mhi.com/news/23112801.html, accessed February 2024 Search PubMed.
- I. Coproration, CO2-free power generation achieved with the world's first gas turbine using 100% liquid ammonia: reduction of over 99% greenhouse gases during combustion, 2022, https://www.ihi.co.jp/en/all_news/2022/resources_energy_environment/1197938_3488.html, accessed February 2024 Search PubMed.
- BUTTING, Cluster 5 Double Layer: Environmental Protection on the High Seas, 2023, https://www.butting.com/en/news-article/cluster-5-double-layer-environmental-protection-on-the-high-seas, accessed February 2024 Search PubMed.
- National Grid ESO, Winter Outlook, 2023, https://www.nationalgrideso.com/research-and-publications/winter-outlook, accessed October 2023 Search PubMed.
- N. MacDowell, N. Florin, A. Buchard, J. Hallett, A. Galindo, G. Jackson, C. S. Adjiman, C. K. Williams, N. Shah and P. Fennell, Energy Environ. Sci., 2010, 3, 1645–1669 RSC.
- N. Mac Dowell, P. S. Fennell, N. Shah and G. C. Maitland, Nat. Clim. Change, 2017, 7, 243–249 CrossRef CAS.
- H. Hekmatmehr, A. Esmaeili, M. Pourmahdi, S. Atashrouz, A. Abedi, M. Ali Abuswer, D. Nedeljkovic, M. Latifi, S. Farag and A. Mohaddespour, Fuel, 2024, 363, 130898 CrossRef CAS.
- BEIS, Implementing the end of unabated coal by 2025, 2018, https://www.gov.uk/government/consultations/coal-generation-in-great-britain-the-pathway-to-a-low-carbon-future, accessed October 2023 Search PubMed.
- BEIS, Electricity networks strategic framework, 2022, https://www.gov.uk/government/publications/electricity-networks-strategic-framework, accessed October 2023 Search PubMed.
- CCC, Delivering a reliable decarbonised power system, 2023, https://www.theccc.org.uk/publication/delivering-a-reliable-decarbonised-power-system/, accessed October 2023 Search PubMed.
- BEIS, Potential to improve load factor of offshore wind farms in the UK to 2035, 2019, https://www.gov.uk/government/publications/potential-to-improve-load-factor-of-offshore-wind-farms-in-the-uk-to-2035, accessed October 2023 Search PubMed.
- M. Fajardy and N. Mac Dowell, Energy Environ. Sci., 2017, 10, 1389–1426 RSC.
- BEIS, Biomass policy statement: a strategic view on the role of sustainable biomass for net zero, 2021, https://www.gov.uk/government/publications/biomass-policy-statement-a-strategic-view-on-the-role-of-sustainable-biomass-for-net-zero, accessed October 2023 Search PubMed.
- BEIS, Business model for power bioenergy with carbon capture and storage (Power BECCS), 2023, https://www.gov.uk/government/consultations/business-model-for-power-bioenergy-with-carbon-capture-and-storage-power-beccs, accessed October 2023 Search PubMed.
- BEIS, UK hydrogen strategy, 2021, https://www.gov.uk/government/publications/uk-hydrogen-strategy, accessed October 2023 Search PubMed.
- BEIS, Hydrogen supply chain: evidence base, 2018, https://www.gov.uk/government/publications/hydrogen-supply-chain-evidence-base, accessed October 2023 Search PubMed.
- D. Niblett, M. Delpisheh, S. Ramakrishnan and M. Mamlouk, J. Power Sources, 2024, 592, 233904 CrossRef CAS.
- BEIS, Supercritical: GreeNH3, 2022, https://assets.publishing.service.gov.uk/media/64678e490d66460010d9636f/HYS2102_Supercritical_Solutions_Final_Feasibility_Report__Public_.pdf, accessed February 2024 Search PubMed.
- R. M. Nayak-Luke, C. Forbes, Z. Cesaro and R. Bãnares-Alcántara, Techno-Economic Challenges of Green Ammonia as an Energy Vector, 2021, pp. 191–207 Search PubMed.
- R. L. Institut, H2-Ready Gas-Fired Power Plants, 2023, https://reiner-lemoine-institut.de/en/pm-study-h2-ready/, accessed April 2024 Search PubMed.
- IEA, The Future of Hydrogen, 2019, https://www.iea.org/reports/the-future-of-hydrogen, accessed October 2023 Search PubMed.
- IEA, Technology Roadmap - Hydrogen and Fuel Cells, 2015, https://www.iea.org/reports/technology-roadmap-hydrogen-and-fuel-cells Search PubMed.
- BEIS, Heat and buildings strategy, 2021, https://www.gov.uk/government/publications/heat-and-buildings-strategy, accessed October 2023 Search PubMed.
- CCC, Independent Assessment: The UK's Heat and Buildings Strategy, 2022, https://www.theccc.org.uk/publication/independent-assessment-the-uks-heat-and-buildings-strategy/, accessed October 2023 Search PubMed.
- BEIS, Storage cost and technical assumptions for electricity storage technologies, 2021, https://www.gov.uk/government/publications/storage-cost-and-technical-assumptions-for-electricity-storage-technologies, accessed October 2023 Search PubMed.
- Z. Abdin, K. Khalilpour and K. Catchpole, Energy Convers. Manage., 2022, 270, 116241 CrossRef CAS.
- H. Wang, P. Daoutidis and Q. Zhang, ACS Sustainable Chem. Eng., 2021, 9, 14605–14617 CrossRef CAS.
- J. Bartels, A Feasibility Study of Implementing an Ammonia Economy, 2008, https://api.semanticscholar.org/CorpusID:109438593 Search PubMed.
- National Grid ESO, Electricity Ten Year Statement (ETYS), 2023, https://www.nationalgrideso.com/research-and-publications/electricity-ten-year-statement-etys, accessed October 2023 Search PubMed.
- M. Zeyringer, J. Price, B. Fais, P. H. Li and E. Sharp, Nat. Energy, 2018, 3, 395–403 CrossRef CAS.
- L. Hirth, J. Mühlenpfordt and M. Bulkeley, Appl. Energy, 2018, 225, 1054–1067 CrossRef.
- ENTSO-E and ENTSO-G, Ten-Year Network Development Plans (TYNDP) - Scenarios, 2023, https://tyndp.entsoe.eu/resources, accessed October 2023 Search PubMed.
- BEIS, Capacity Market Rules, 2023, https://www.gov.uk/government/publications/capacity-market-rules, accessed October 2023 Search PubMed.
- National Grid ESO, Electricity Market Reform, 2023, https://www.emrdeliverybody.com/cm/home.aspx, accessed October 2023 Search PubMed.
- BEIS, Digest of UK Energy Statistics (DUKES), 2023, https://www.gov.uk/government/statistics/electricity-chapter-5-digest-of-united-kingdom-energy-statistics-dukes, accessed October 2023 Search PubMed.
- C. J. Quarton and S. Samsatli, Data Brief, 2020, 31, 105886 CrossRef PubMed.
- P. Enevoldsen and M. Z. Jacobson, Energy Sustainable Dev., 2021, 60, 40–51 CrossRef.
- BEIS, Electricity generation costs 2023, 2023, https://www.gov.uk/government/publications/electricity-generation-costs-2023, accessed October 2023 Search PubMed.
- CCC, Net Zero – The UK's Contribution to Stopping Global Warming, 2019, https://www.theccc.org.uk/publication/net-zero-the-uks-contribution-to-stopping-global-warming/, accessed October 2023 Search PubMed.
- BEIS, Government conversion factors for company reporting of greenhouse gas emissions, 2023, https://www.gov.uk/government/collections/government-conversion-factors-for-company-reporting, accessed October 2023 Search PubMed.
- CCC, Biomass in a low-carbon economy, 2018, https://www.theccc.org.uk/publication/biomass-in-a-low-carbon-economy/, accessed October 2023 Search PubMed.
- Á. García-Cerezo, R. García-Bertrand and L. Baringo, IEEE Trans. Power Syst., 2022, 37, 4325–4339 Search PubMed.
- P. C. Slorach and L. Stamford, Energy Convers. Manage., 2021, 230, 113838 CrossRef CAS.
- I. Vorushylo, P. Keatley, N. Shah, R. Green and N. Hewitt, Energy, 2018, 157, 539–549 CrossRef.
- National Grid ESO, Future Energy Scenarios, 2023, https://www.nationalgrideso.com/future-energy/future-energy-scenarios, accessed October 2023 Search PubMed.
- S. Pfenninger and I. Staffell, Energy, 2016, 114, 1251–1265 CrossRef.
- ENTSO-E, ENTSO-E Transparency Platform, 2023, https://transparency.entsoe.eu/dashboard/show, accessed October 2023 Search PubMed.
- Gurobi Optimization, LLC, Gurobi Optimizer Reference Manual, 2023, https://www.gurobi.com Search PubMed.
- R. E. Rosenthal, GAMS – A User's Guide, 2007 Search PubMed.
- C. J. Quarton and S. Samsatli, Appl. Energy, 2020, 275, 115172 CrossRef CAS.
- CCC, Sixth Carbon Budget, 2020, https://www.theccc.org.uk/publication/sixth-carbon-budget/, accessed October 2023 Search PubMed.
- J. Verschuur, N. Salmon, J. Hall and R. Bañares-Alcántara, Environ. Res.: Infrastruct. Sustainability, 2024, 4, 015001 Search PubMed.
- S. Pineda, R. Fernández-Blanco and J. M. Morales, IEEE Trans. Power Syst., 2019, 34, 3869–3878 Search PubMed.
- A. Schwele, J. Kazempour and P. Pinson, Energy Syst., 2020, 11, 247–282 CrossRef.
- G. L. Bounitsis, L. G. Papageorgiou and V. M. Charitopoulos, Chem. Eng. Res. Des., 2022, 187, 206–224 CrossRef CAS.
- L. A. Roald, D. Pozo, A. Papavasiliou, D. K. Molzahn, J. Kazempour and A. Conejo, Electr. Power Syst. Res., 2023, 214, 108725 CrossRef.
Footnote |
| † Electronic supplementary information (ESI) available. See DOI: https://doi.org/10.1039/d4se00449c |
| This journal is © The Royal Society of Chemistry 2024 |

