Electrochemically engineered domain: nickel–hydroxide/nickel nitride composite for alkaline HER electrocatalysis†
Chikaodili E.
Chukwuneke
 a,
Kenta
Kawashima
 a,
Hao
Li
 b,
Raul A.
Marquez
 a,
Yoon Jun
Son
c,
Lettie A.
Smith
 a,
Hugo
Celio
d,
Graeme
Henkelman
aefg and
C. Buddie
Mullins
 *acdfg
aDepartment of Chemistry, College of Natural Sciences, The University of Texas at Austin, Austin, Texas 78712, USA. E-mail: mullins@che.utexas.edu
bAdvanced Institute for Materials Research (WPI-AIMR), Tohoku University, Sendai 980-8577, Japan
cMcKetta Department of Chemical Engineering, The University of Texas at Austin, Austin, Texas 78712, USA
dTexas Materials Institute, The University of Texas at Austin, Austin, Texas 78712, USA
eOden Institute for Computational Engineering and Sciences, The University of Texas at Austin, Austin, Texas 78712, USA
fCenter for Electrochemistry, The University of Texas at Austin, Austin, Texas 78712, USA
gH2@UT, The University of Texas at Austin, Austin, Texas 78712, USA
First published on 7th December 2023
Abstract
Boosting hydrogen evolution reaction (HER) performance in alkaline media has been a topic of interest in a world that continuously strives for cleaner energy conversion systems. The paucity of protons provides a challenge to performing the HER in an alkaline environment and is a major impediment to decreasing the energy requirement needed to produce hydrogen. Here, we improve the HER activity of nickel-nitride by electrochemically anodizing the surface which aids water dissociation in alkaline HER. We experimentally show that by oxidizing the nickel nitride on a nickel foam (Ni3N/NF) surface using cyclic voltammetry (CV) cycles in Fe-unpurified KOH media, Ni3N can be converted to a Ni(OH)2/Ni3N composite. Activation of the Ni3N/NF with 50 CV cycles resulted in a low HER overpotential of 172 and 207 mV at the current densities of 50 and 100 mA cm−2, respectively. The 50 CV cycle Ni3N/NF also had the minimum charge transfer resistance at 6 Ω compared to all other prepared samples, and the Tafel slope is 100.87 mV dec−1.
Introduction
As carbon emissions increase and the threat of climate change looms, there is an increasing need to turn to carbon-free energy conversion and storage devices. One route, electrochemical water-splitting, holds promise as it enables the oxygen evolution reaction (OER) and hydrogen evolution reaction (HER), which have O2 and H2 as the only products. While overall water splitting is a potential green energy technology, it is limited in its practical application because of the slow kinetics of the OER and HER. For the OER and HER to proceed, electrocatalysts are used to overcome their kinetic limitations. These electrocatalysts are typically either impractical to mass produce because they require noble metal materials or, if they are made of more cost-effective materials, they still require extensive and costly energy input, which makes overall water splitting impractical. In addition, the OER and HER kinetic limitations are best suppressed in differing electrolyte systems—alkaline and acidic media, respectively. The HER has been studied mainly in acidic media wherein H+ is readily available as the reactant, making it more favorable for improved HER kinetics.Given that the OER has been shown to work well under alkaline conditions, there is a push to perform HER in alkaline media. In alkaline media, inexpensive metals for electrodes and cell materials can be used as opposed to those required under acidic conditions. For these reasons, alkaline electrolyzers are readily available in industry.1,2 However, free H+ is not readily available for hydrogen evolution under alkaline conditions. The protons are still bound to oxygen, and H2 can only evolve once water dissociation has occurred, resulting in sluggish kinetics in alkaline media as compared to acidic for the HER. These sluggish kinetics means additional energy input is needed for the reaction to proceed. This excess energy needed to drive any electrocatalytic reaction with respect to the equilibrium potential of certain redox reactions is referred to as the overpotential. An overpotential increase leads to a more energetically intensive reaction, which in turn increases the energy cost. To lower the overpotential for the electrochemical HER process, developing better electrocatalysts is crucial.
Platinum group (e.g., Pt and Ru)-based metals and their hydroxides have been reported as the best-performing electrocatalysts for alkaline HER.3–7 However, these precious metals are both scarce and expensive, making them unattractive for industrial application.8–10 Non-noble transition metals have recently gained attention due to their high performance, decent stability in alkaline media and their low cost. These metals react with carbon, group 15 and 16 elements to form compounds referred to as transition metal X-ides. Ni-based X-ide electrocatalysts, such as Ni3N, are of particular interest due to their moderate binding energies for hydrogen. Under alkaline conditions, Ni-based X-ides undergo surface oxidation Ni(OH)2 which has been shown by our group and others to improve the kinetics of water dissociation.11–13 Just recently, Anantharaj et al., improved the alkaline HER activity of NiS by generating Ni–S–OH/Ni in situ by using anodic cyclic voltammetry (CV) cycling.14 They used NiS as the precursor and suggested that by applying anodic potentials in incremental CV cycles, an amorphous hydroxide layer can be generated on the surface of NiS to aid water dissociation in alkaline media. This is possibly because Ni(OH)2 lowers the energy barrier in the water dissociation step by forming a hydrogen bond with H2O.15,16 Also, Markovic's group noted that the primary factor for this catalytic ability is due to the weak Ni–OH bond which makes Ni sites in Ni(OH)2 available for continuous water dissociation.17 Based on these findings, we proposed observing the impact of incremental CV cycling and hydroxylation on the electrochemical HER performance of Ni3N/NF in alkaline media.
In this study, we demonstrate that conditioning nickel nitride electrocatalysts in KOH forms a nickel hydroxide layer with superior HER performance. In the first section, nickel nitride is synthesized on a nickel foam substrate (Ni3N/NF). Subsequently, the electrochemical HER performance of the Ni3N/NF is compared to the NF. In the second section, Ni3N/NF is transformed into a Ni(OH)2–NiOOH/Ni3N composite by anodic CV cycling. Incremental CV cycles were done to evaluate the relationship between the electrochemical HER performance and the number of CV cycles. The impact of the increasing number of CV cycles on the intrinsic activity and, double layer capacitance was also measured. Results show that at 50 CV cycles, the lowest overpotential decrease of 7.6 and 15 mV at 50 and 100 mA cm−2 respectively, was observed. The Tafel slope remained constant with increasing CV cycles while the double layer capacitance increased with increasing CV cycling. These results suggest that anodic CV cycling induces the in situ formation of a porous Ni(OH)2 catalyst layer on the Ni3N/NF electrocatalyst and that 50 CV cycles is sufficient to improve the electrochemical HER performance. This porous structure aided the water adsorption/dissociation as well as mass and charge transfer, resulting in a lower overpotential, Tafel slope, and charge transfer resistance.
Experimental
Materials
Nickel foam (NF) with >99.99% purity from MTI [thickness: 1.6 mm, porosity: ≥95% (80–110 pores per inch, average hole diameters about 0.25 mm)], potassium hydroxide (Sigma Aldrich, 90%), ultra-pure water (18 MΩ cm), ethanol (Pharmco), and nitrogen and ammonia (Airgas), were used for electrode preparation and electrochemical experiments.Electrode preparation
First, NF pieces (1 × 1 cm2) were washed and sonicated with ultra-pure water and ethanol for 10 min each, respectively. After vacuum drying, the as-cleaned NF pieces were oxidized in air within a box furnace at 350 °C for 2 h, at a ramp rate of 10 °C min−1 to produce NiO precursor layers on NF pieces. Subsequently, the nitridation of the as-prepared NiO/NF to form Ni3N/NF was conducted in a horizontal tube furnace by flowing NH3 gas at a flow rate of 120 sccm. Note that the samples were installed in an alumina boat for both oxidation (i.e., NiO formation) and nitridation (i.e., Ni3N formation). The holding temperature was set at 450 °C for 4 h, at a ramp rate of 10 °C min−1.Characterization
A Rigaku Miniflex 600 X-ray diffractometer with Cu Kα radiation (λ = 1.54186 Å) source was used to obtain the X-ray diffraction patterns (XRD) of the materials. A Quanta 650 environmental scanning electron microscope (ESEM) and Apreo 2 C LoVac scanning electron microscope coupled with a Bruker energy dispersive X-ray detector (EDX) were used to investigate the morphologies and the elemental compositions of the samples. Surface compositions of the samples were evaluated using a Kratos X-ray photoelectron spectrometer (XPS) with both Al Kα1 and Mg Kα1 radiation (hv = 1486.7 and 1253.7 eV, respectively).Electrochemistry
All the electrochemical experiments were performed on a CHI 660D potentiostat. The counter electrode used was a graphite rod, the working electrode is the as-fabricated Ni3N/NF, while the electrolyte used is a 1 M KOH aqueous solution (electrolyte volume: 125 mL). All potentials were measured versus a Hg/HgO reference electrode with a 1 M KOH internal solution and converted and reported versus the reversible hydrogen electrode (RHE). Conversion of the potential value was completed employing the Nernst equation:18Linear sweep voltammetry (LSV) was conducted at a scan rate of 10 mV s−1 using 90% iR compensation19 to measure the HER performance of the as-prepared electrodes. Note that before recording the LSV curves, the as-prepared electrodes were cathodically scanned for ∼6–8 times until the HER current signals were stabilized. Multiple cyclic voltammetry (CV) scans were conducted to activate (i.e., oxidize) the Ni3N/NF electrode at a scan rate of 100 mV s−1. Electrochemical surface areas (ECSAs) were estimated using the CV-based electrochemical double-layer capacitance (Cdl). Specifically, Cdl measurements were carried out via multiple CV scans taken at different scan rates. By performing CV's with varying scan rates in the non-faradaic potential window and taking the slope of the capacitive current vs. potential (I = vCdl), the Cdl values of the electrodes were obtained. Charge transfer (Rct) and solution resistance (Rs ∼2 Ω) were determined using electrochemical impedance spectroscopy (EIS) measurements. Furthermore, electrochemical stability testing was performed using chronopotentiometry (CP) at a constant cathodic current density of −20 mA cm−2 without iR compensation.
Computational details
The density functional theory (DFT) calculations in this study were performed using the Vienna ab initio software package. The core and valence electrons were respectively described by the projector augmented-wave (PAW)20 method, and Kohn–Sham wave functions were expanded in a plane wave basis with the energy cut-off set of 400 eV.21 The electronic exchange and correlation were described by the generalized gradient approximation (GGA) using the Perdew–Burke–Ernzerhof (PBE) functional.22 All calculations were conducted with spin polarizations. The Brillouin zone was sampled by a (3 × 3 × 1) Monkhorst–Pack k-point mesh.23 Structures were considered relaxed when all the forces on each atom became lower than 0.05 eV Å−1. The climbing-image nudged elastic band (Cl-NEB) method was employed to acquire the transition states and activation energies of water dissociation.24 Since the Ni3N is a Ni-rich material, and the N-terminated surfaces are highly hydrophobic, only the Ni-terminated Ni3N surfaces and Ni (111) were considered in our calculations.Results and discussion
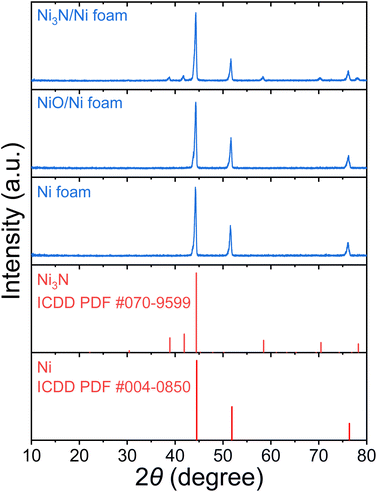
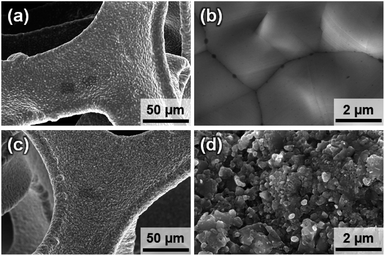
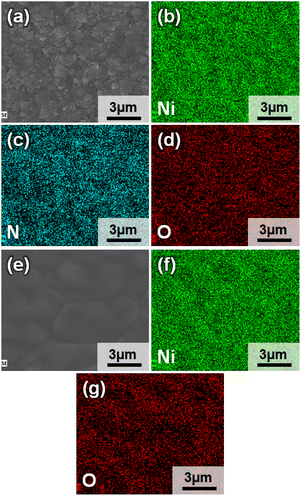
To characterize the bulk elemental distribution and the crystal structures of the Ni3N/NF and NF prepared electrodes, X-ray diffraction (XRD) was performed. The XRD patterns in Fig. 1 show that the as-purchased NF has a cubic crystal system as identified by diffraction peaks corresponding to Ni [International Centre for Diffraction Data (ICDD) PDF: 004-0850]. For the as-prepared Ni3N/NF, diffraction peaks corresponding to both cubic Ni and hexagonal Ni3N (ICDD PDF: 070-9599) were identified (see Fig. 1). This result shows that NF was partially converted into Ni3N through its oxidation (Ni to NiO) and subsequent nitridation (NiO to Ni3N). The NiO precursor is amorphous and as a result, no NiO diffraction peak can be found (see Fig. 1), and only the diffraction peaks of metallic Ni were present.Optical images of the electrodes were obtained to show any macroscopic changes to the NiO electrocatalyst due to nitridation. The optical images show that NF has a light-grey color and upon nitridation is transformed to a dark-grey color (Fig. S1†). To examine the morphology of the electrodes, SEM images were obtained. SEM images shown in Fig. 2a and b show the smooth surface of NF, while those of Ni3N/NF (Fig. 2c and d) are rougher after the incorporation of nitrogen. The surface roughening can be attributed to the drastic crystal structure change through the oxidation (cubic Ni to amorphous NiO) and nitridation (amorphous NiO to hexagonal Ni3N) that has been reported in other studies.12,25–28 From EDX analysis, mappings of each element were obtained for Ni3N/NF and NF to evaluate the distribution of elements. Fig. 3a–d for Ni3N/NF show that Ni and N are homogeneously distributed throughout the material. The oxygen signal was also observed in Fig. 3d, which can be attributed to oxidation by ambient air. EDX spectra indicating the successful incorporation of nitrogen are also provided in Fig. S2.†Fig. 3e–g shows the elemental distribution in NF, and the oxygen signal is due to ambient oxidation.
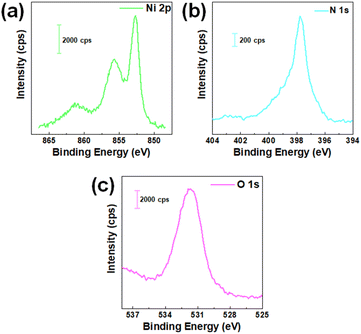
The surface composition of the as-prepared Ni3N/NF was determined using XPS. Fig. 4 shows high-resolution XPS spectra for Ni 2p, N 1s, and O 1s. Fig. 4a shows the Ni 2p3/2 region with peaks at 852.6,29,30 855.6,29,30 and 861.2 eV (ref. 31) indicating Ni0, Ni2+, and their satellite peaks, respectively. N 1s spectrum in Fig. 4b is shown with a peak at 398 eV, supporting the lattice structure.31,32 The O 1s spectrum in Fig. 4c with a characteristic peak at 531.65 eV (ref. 33 and 34) is Ni–O–H which is due to ambient oxidation of adsorbed hydrides. Additionally, the precursor NiO/NF was further evaluated using XPS (see Fig. S17†), which confirms the presence of surface NiO species.34
HER performance of Ni3N/NF and NF
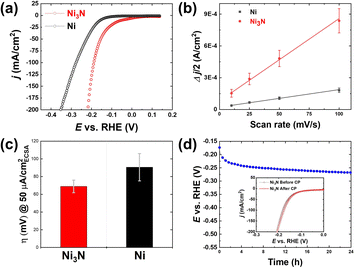
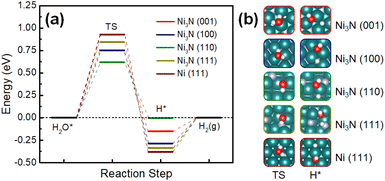
All the electrochemical experiments were conducted in a standard three-electrode system. We evaluated the electrochemical performance of Ni3N/NF for the HER. LSV experiments were conducted with the use of NF as a control. Ni3N/NF had an overpotential of 171.9 ± 3.8 and 207.3 ± 3.1 mV at 50 and 100 mA cm−2, respectively. On the other hand, the overpotentials of NF are 221.9 ± 7.5 and 266.9 ± 8.5 mV at 50 and 100 mA cm−2, respectively, were observed indicating that Ni3N/NF outperforms NF, as also observed in previous studies.29,32,35,36 Moreover, this result highlights the significance of d-band theory where nitrogen incorporation shifts the d-band center of Ni to have a likeness to Pt.37 To further understand the reason for the superior HER activity, we evaluated the ECSAs of NF and Ni3N/NF (to be specific, we used the CV-based Cdl values as proxies for the ECSAs). As shown in Fig. 5b that Ni3N/NF with the Cdl of 7.8 mF cm−2 has a larger surface area compared to NF (1.7 mF cm−2) which could be an indication of a larger catalytic surface. This increased Cdl is expected given the roughened surface observed via SEM (see Fig. 2d and b) post NiO/NF nitridation, which is an indicator of high catalytic activity.38,39 Intrinsic HER activity evaluation was performed by comparing overpotentials of NF and Ni3N/NF at an ECSA-normalized current density of 50 μA cmECSA−2. The ECSA used here was obtained from the relation ECSA = Cdl/Cs where Cs means specific capacitance and the generic Cs of 40 μF cm−2 in alkaline media was obtained from literature.40 As shown in Fig. 5c, Ni3N/NF has a better intrinsic HER activity at a confidence interval of 90% marked by a lower overpotential of 68.9 ± 7.0 mV compared to 90.6 ± 15.4 mV for NF.To further understand the electrocatalytic HER activities found in our experiments DFT calculations were performed to understand the kinetics and thermodynamics of HER in an alkaline environment (Fig. 6a). Based on the XRD results (Fig. 1), all of the Ni-terminated surfaces of Ni3N (001), (100), (110), and (111) and Ni (111) were modelled with DFT calculations (Fig. 6b). Different from the acidic HER mechanism, the rate-determining step of alkaline HER could be the kinetic barrier for water dissociation.41 It can be seen that all of the studied Ni3N surfaces have significantly lower energy barriers than Ni (111), indicating more facile kinetics on Ni3N surfaces. Meanwhile, the thermodynamics of the second step – the evolution of adsorbed hydrogen, are also more facile than that of Ni (111) (Fig. 6a). Notably, the Ni3N (110) shows the lowest water activation energy and near-zero energy for hydrogen evolution, suggesting that this is a highly favorable surface for alkaline HER. Two mechanisms were identified: on the lower index surfaces of Ni3N [(001), (100), and (110)], the dissociated H* is adsorbed at the Ni-sites, while H* prefers to stay at the N-site of Ni3N (110) (Fig. 6a). This is similar to a previous study by You et al. where nitrogen acts as a promoter at a N-doped Ni (111) surface that “pulls” the hydrogen out from an adsorbed water.42 Overall, the Ni3N surfaces show enhanced alkaline HER activity as compared to Ni (111), which suggests that Ni3N improves the performance and is in agreement with our experiments.29
The electrocatalytic HER stability of Ni3N/NF under alkaline conditions was tested using long-term CP, and then the activity after the stability test was measured to see if the HER activity was retained. Fig. 5d shows the 24 h CP that was conducted at a constant cathodic current density of −20 mA cm−2, and the results show a potential drop of ∼95 mV over 24 h, which suggests the HER activity of Ni3N/NF was slightly diminished. However, the HER activity (pre and post LSV) tests appear similar, indicating that the HER activity remained stable after the long-term HER testing, as observed in the inset of Fig. 5d. The seemingly diminished activity during the CP test could be attributed mainly to bubble accumulation on the electrode surface, which probably lower the number of available surface-active sites for the HER. XRD patterns were obtained for pre- and post-long-term testing to see if there were any changes to the bulk structure of the catalyst. The XRD pattern acquired after the long-term testing shows that the bulk structure is preserved as the Ni3N and Ni diffraction peaks were the only peaks observed, as shown in Fig. S3.† XPS analysis after the 24 h stability test (Fig. S4†) shows that for the Ni 2p region, Ni2+/Ni3+ species are predominant, indicating the possible formation of Ni(OH)2 and NiOOH after the long-term HER testing under alkaline conditions. Compared to the pristine N 1s spectrum (Fig. 4b), the lattice Ni–N bond at around 398 eV is significantly diminished but the adsorption of N–H species at around 400 eV is prominent. Also visible is the incorporation of Fe (Fig. S4†) into the catalyst surface to form NiFeOxHy after CP testing, and this has been observed in studies that have employed CP treatment on Ni-based electrodes in alkaline media.43
Effects of anodic CV activation on HER performance of Ni3N/NF
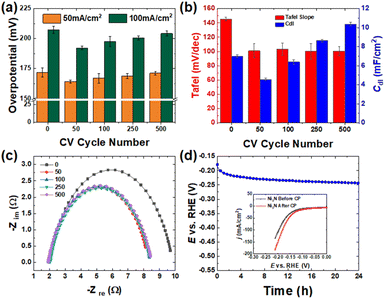
Both experimental and computational results show that Ni3N/NF is a better HER electrocatalyst compared to NF. Next, we used anodic CV oxidation to create Ni(OH)2–NiOOH that are more hydrophilic surfaces, which can further boost the electrocatalytic HER activity and stability. We performed anodic CV activation using different cycling numbers from 0 to 500 cycles, and the corresponding profiles are provided in Fig. S5.† These profiles show that as the CV cycling number increases, there is an increase in the redox peak areas. These cathodic and anodic peaks correspond to the reversible reduction and oxidation of NiOOH and Ni(OH)2 at ∼1.15 and ∼1.5 V vs. RHE,12,36 respectively. By changing the CV cycling number, the oxidation degree can be controlled. After CV activation, we performed the LSV (Fig. S6†) to evaluate the relationship between the geometric HER activity and CV cycle number (importantly, the activated electrodes were cathodically scanned for ∼8–10 times until the HER current signals were stabilized, and subsequently the LSV curves were collected to check their HER performance). Fig. 7a shows the HER overpotential at the geometric current density of 50 and 100 mA cm−2. These results show that the CV-activated Ni3N/NF samples have lower HER overpotentials compared to the as-prepared Ni3N/NF sample, which suggests that anodic CV oxidation helped further improve the HER activity of Ni3N/NF. The results also highlight that the cycle number of 50 is optimal to effectively improve the HER activity as indicated by the lowest HER overpotentials (171.9 ± 3.8 and 207.3 ± 3.1 mV at 50 and 100 mA cm−2). Compared to other studies that use Ni3N/NF directly as a catalyst or a chalcogenide activated through anodic CV cycling for the HER under alkaline conditions, the impact of anodic CV oxidation on Ni3N/NF in this study in lowering the overpotential for alkaline HER is statistically different (see Tables S1 and S2†).To understand the reason for the improvement in the HER activity after anodic CV cycling, we measured the ECSAs of the CV-activated samples. The CV experiments in the non-faradaic potential window (0.707 to 0.757 V vs. RHE) are displayed in Fig. S12.† The results, as shown in Fig. 7b, indicate that there was an initial decrease (7.01 ± 0.16 to 4.55 ± 0.14 mF cm−2) in the Cdl before a continuous increase with CV cycle number. This initial decrease may be caused by surface compositional changes due to a reconstruction of the Ni–N structure to Ni–Fe–OH, which leads to a smaller Cs value. Previous studies have shown that Ni metal has a larger Cs value (∼32 μF cm−2) than NiFeOH (∼20 μF cm−2) in aqueous media.44 Since pristine Ni3N/NF is metallic and CV activation oxidizes its surface with the incorporation of Fe3+ (see Fig. S7†),45,46 resulting in the formation of NiFeOxHy, a similar Cs decrease might occur with the formation of NiFeOxHy following CV activation of Ni3N. This suggests that the as-observed Cdl decrease can be due mainly to surface composition alterations. The subsequent increase (from 50 to 500 cycles) in Cdl is due to an increase in the formation of a thicker NiFeOxHy layer with increasing CV cycling oxidation of the Ni3N surface.44 Studies have shown that the NiFeOxHy layer thickness increases during anodic CV cycling of Ni-based precatalysts, because the cathodic sweep causes the partial reduction of the anhydrous oxide layer which was initially formed during the anodic sweep, forming an electrolyte-permeable disordered structure. This partial reduction results in further oxidation and hence an increase in the NiFeOxHy layer thickness.43,47–49 Also the change in the conductivity due to surface transformation could be responsible for the observed drop and subsequent increase in the value of Cdl. Possibly the formation of Ni(OH)2 which has a lower conductivity compared to Ni3N/NF caused the decrease in Cdl and the subsequent increase due to the formation of a more conductive NiOOH.
We also characterized the Ni3N/NF surface after 50 CV cycles (i.e., the best-performing sample) to identify possible electrocatalytic active species for the HER. The XPS results in Fig. S9† show that Ni(OH)2 (855.6 eV),50,51 Ni–N (398 eV),31,32 N–H (400 eV),12 and Fe3+ (711 eV)45,46 are the active species on the surface. This experimental evidence points to Ni(OH)2–NiOOH as the possible oxidized species that amplifies electrochemical activity for the HER. Although there is evidence of Fe incorporation as observed in Fig. S9,† it has been explained by Corrigan et al., that Fe incorporation doesn't impact on the HER activity.52 Moreover, the bulk data from XRD (Fig. S8†) indicates that Ni3N and Ni metal in the Ni3N/NF sample were preserved. The absence of Ni(OH)2 in the diffraction pattern could be attributed to a thin layer formation below the detection limit or its amorphous structure. The structure of Ni(OH)2 was confirmed with an SEM image, in Fig. S8b,† which shows the formation of a newly formed thin, porous structure. The porous structure is created due to electrochemically induced in situ oxidation in which transition metal compounds undergo anion exchange; in this case, the exchange of N3− with O2− or OH− coupled with Fe incorporation.43,53 CP test for 24 h was done to see if the electrocatalytic HER activity is sustained after long-term use. The result in Fig. 7d shows an overpotential increase of 40 mV during the CP test, which again can be attributed to bubble accumulation during the long-term testing. Activity results provided before and after the CP test (inset Fig. 7d) also show that the HER activity improves after long-term use (the reason for this activity improvement is still unknown and under investigation). Here, post HER characterization results are also available in the ESI (see Fig. S15†). To further confirm the HER stability of the 50 CV-activated Ni3N/NF electrode, a longer HER CP test [testing time: 200![[thin space (1/6-em)]](https://www.rsc.org/images/entities/char_2009.gif) 000 s (100
000 s (100![[thin space (1/6-em)]](https://www.rsc.org/images/entities/char_2009.gif) 000 s × 2) = ∼56 h] was also performed (see Fig. S18†). From the inset of Fig. S18,† it can be seen that after the ∼56 h HER CP test, the 50 CV-activated Ni3N/NF electrode affords improved HER performance, which is similar to the 24 h HER CP test result. Nevertheless, these results suggest that the Ni(OH)2 formed after the 50 CV cycle enhances the geometric HER activity with the Ni2+ and O2−/OH− possibly providing the hydrogen bonding sites that aid water dissociation17 and improve electrochemical stability for the long-term HER process.
000 s × 2) = ∼56 h] was also performed (see Fig. S18†). From the inset of Fig. S18,† it can be seen that after the ∼56 h HER CP test, the 50 CV-activated Ni3N/NF electrode affords improved HER performance, which is similar to the 24 h HER CP test result. Nevertheless, these results suggest that the Ni(OH)2 formed after the 50 CV cycle enhances the geometric HER activity with the Ni2+ and O2−/OH− possibly providing the hydrogen bonding sites that aid water dissociation17 and improve electrochemical stability for the long-term HER process.
Electrode intrinsic HER activity
The Tafel slope is a measure of the intrinsic activity of the resultant electrode for the HER and was obtained after each CV cycle (i.e., CV activation). The as-obtained Tafel slopes shown in Fig. S7† are represented with bars in Fig. 7b, indicating that the catalyst after 50 CV cycles has a similarly low Tafel slope as other cycled samples with a value of 100.87 mV dec−1 and hence an improved intrinsic activity relative to the pristine Ni3N/NF. Experimental evidence for the stable Tafel slope after 500 CV cycles can be observed from the XPS spectra in Fig. S11a.† There, the Ni 2p characteristic peak at 855–856 eV shows a complete oxidation of Ni3N to Ni(OH)2 (Ni2+) and NiOOH (Ni3+), respectively.29,30 Also, there is a notable decline in the N 1s signal in Fig. S11b,† indicating a decrease in the nitrogen content marked by the diminished Ni–N signal at 398 eV.31,32 Even further, the intrinsic activity trend correlated with changes in the Rct. Rct is confirmed by EIS measurements where a decrease in the Rct is indicative of improved reaction kinetics. The Nyquist plot in Fig. 7c and the corresponding Bode plots (Fig. S13†) show that the intrinsic activity improves after 50 CV cycles as marked by the Rct decrease from ∼8 to ∼6 Ω. Low resistance is commonly associated with the high-frequency region in a Bode/Nyquist plot for a simple Randle's circuit. This correlation is possible because, at high frequency, the double layer is quickly lined up with charges and poses little resistance to the flow of current. The Rct and frequency shift from the EIS and Bode plots remains relatively constant after 50 CV cycles following the same trend as the Tafel slope. In Fig. S14,† CP following 50 CV cycles also shows an improvement in the intrinsic activity as the Rct decreases from ∼8 to ∼6.5 Ω.Furthermore, after 500 CV cycles, we evaluated the electrocatalyst for any changes in the bulk and surface compositional structure and morphology. The XRD pattern in Fig. S10† shows that the bulk surface was preserved, as indicated by the presence of Ni3N and Ni diffraction peaks, while the SEM images show that the morphology remains relatively the same. XPS results in Fig. S11† show that surface oxidation has occurred, which is signified by the shift from 852 eV for Ni0 to 856 eV for Ni(OH)2,29,30 in the Ni 2p3/2 region. The dwindling nitrogen signal in the N 1s spectra also strengthens the oxidation argument.
Conclusion
We set out to improve the HER performance of Ni3N/NF in alkaline media by applying an anodic bias via incremental CV cycles. Overall, the CV anodization cycle does not impact the bulk structure but oxidizes the surface of the precatalyst to Ni(OH)2 and NiOOH, which aids the alkaline HER activity. These results suggest that the synergistic effect of the amorphous Ni(OH)2 on the surface and the bulk crystalline Ni3N/NF (Ni(OH)2–Ni3N/NF) interface is necessary for augmenting the HER performance in alkaline media by aiding the water dissociation step. The HER improvement is marked by the overpotential drop, Tafel slope, and Rct after 50 CV cycles.Author contributions
C. E. Chukwuneke: conceptualization, investigation, formal analysis, writing – original draft, verification, visualization, K. Kawashima: conceptualization, writing – review and editing, H. Li: investigation, formal analysis, writing – review and editing, R. A. Márquez: writing – review and editing, Y. J. Son: writing – review and editing, L. A. Smith: writing – review and editing, H. Celio: investigation, writing – review and editing, G. Henkleman: supervision, resources, funding acquisition, writing – review and editing. C. B. Mullins: conceptualization, supervision, resources, funding acquisition, writing – review and editing.Conflicts of interest
The authors declare no competing financial interest.Acknowledgements
The authors sincerely express their gratitude for the invaluable support of the National Science Foundation (NSF) via grant CHE-2102307 (C. B. M.) for the experimental portion of the paper and the U.S. Department of Energy (DOE) via grant DE-SC0010576 (G. H.) for the computational portion of the study. The authors extend our heartfelt appreciation to the Welch Foundation for its generous support through grants F-1436 (C. B. M.) and F-1841 (G. H.). H. Li. acknowledges the Iwatani Naoji Foundation. Computational resources were provided by the Texas Advanced Computing Center (TACC) and the National Energy Research Scientific Computing Center (NERSC).References
- J. Ivy, Summary of Electrolytic Hydrogen Production: Milestone Completion Report, National Renewable Energy Lab., Golden, CO (US), 2004 Search PubMed.
- J. D. Benck, T. R. Hellstern, J. Kibsgaard, P. Chakthranont and T. F. Jaramillo, ACS Catal., 2014, 4, 3957–3971 CrossRef CAS
.
- J. Mahmood, F. Li, S.-M. Jung, M. S. Okyay, I. Ahmad, S.-J. Kim, N. Park, H. Y. Jeong and J.-B. Baek, Nat. Nanotechnol., 2017, 12, 441–446 CrossRef CAS PubMed
.
- Q. Yao, B. Huang, N. Zhang, M. Sun, Q. Shao and X. Huang, Angew. Chem., Int. Ed., 2019, 58, 13983–13988 CrossRef CAS PubMed
.
- J. N. Tiwari, S. Sultan, C. W. Myung, T. Yoon, N. Li, M. Ha, A. M. Harzandi, H. J. Park, D. Y. Kim, S. S. Chandrasekaran, W. G. Lee, V. Vij, H. Kang, T. J. Shin, H. S. Shin, G. Lee, Z. Lee and K. S. Kim, Nat. Energy, 2018, 3, 773–782 CrossRef CAS
.
- M. Li, K. Duanmu, C. Wan, T. Cheng, L. Zhang, S. Dai, W. Chen, Z. Zhao, P. Li, H. Fei, Y. Zhu, R. Yu, J. Luo, K. Zang, Z. Lin, M. Ding, J. Huang, H. Sun, J. Guo, X. Pan, W. A. Goddard, P. Sautet, Y. Huang and X. Duan, Nat. Catal., 2019, 2, 495–503 CrossRef CAS
.
- Y. Liu, S. Liu, Y. Wang, Q. Zhang, L. Gu, S. Zhao, D. Xu, Y. Li, J. Bao and Z. Dai, J. Am. Chem. Soc., 2018, 140, 2731–2734 CrossRef CAS PubMed
.
- J. Kibsgaard and I. Chorkendorff, Nat. Energy, 2019, 4, 430–433 CrossRef
.
- M. F. Lagadec and A. Grimaud, Nat. Mater., 2020, 19, 1140–1150 CrossRef CAS PubMed
.
- Z. W. Seh, J. Kibsgaard, C. F. Dickens, I. Chorkendorff, J. K. Nørskov and T. F. Jaramillo, Science, 2017, 355, eaad4998 CrossRef
.
- B. R. Wygant, K. Kawashima and C. B. Mullins, ACS Energy Lett., 2018, 3, 2956–2966 CrossRef CAS
.
- K. Kawashima, R. A. Márquez-Montes, H. Li, K. Shin, C. L. Cao, K. M. Vo, Y. J. Son, B. R. Wygant, A. Chunangad, D. H. Youn, G. Henkelman, V. H. Ramos-Sánchez and C. B. Mullins, Adv. Mater., 2021, 2, 2299–2309 RSC
.
- K. Kawashima, R. A. Márquez, L. A. Smith, R. R. Vaidyula, O. A. Carrasco-Jaim, Z. Wang, Y. J. Son, C. L. Cao and C. B. Mullins, Chem. Rev., 2023, 123, 12795–13208 CrossRef CAS
.
- S. Anantharaj, H. Sugime and S. Noda, Chem. Eng. J., 2021, 408, 127275 CrossRef CAS
.
- D. S. Hall, C. Bock and B. R. MacDougall, J. Electrochem. Soc., 2013, 160, F235 CrossRef CAS
.
- S. Anantharaj, S. Noda, V. R. Jothi, S. Yi, M. Driess and P. W. Menezes, Angew. Chem., Int. Ed., 2021, 60, 18981–19006 CrossRef CAS PubMed
.
- R. Subbaraman, D. Tripkovic, K.-C. Chang, D. Strmcnik, A. P. Paulikas, P. Hirunsit, M. Chan, J. Greeley, V. Stamenkovic and N. M. Markovic, Nat. Mater., 2012, 11, 550–557 CrossRef CAS PubMed
.
- K. Kawashima, R. A. Márquez, Y. J. Son, C. Guo, R. R. Vaidyula, L. A. Smith, C. E. Chukwuneke and C. B. Mullins, ACS Catal., 2023, 13, 1893–1898 CrossRef CAS
.
- Y. J. Son, R. A. Marquez, K. Kawashima, L. A. Smith, C. E. Chukwuneke, J. Babauta and C. B. Mullins, ACS Energy Lett., 2023, 8, 4323–4329 CrossRef CAS
.
- P. E. Blöchl, Phys. Rev. B: Condens. Matter Mater. Phys., 1994, 50, 17953–17979 CrossRef PubMed
.
- W. Kohn and L. J. Sham, Phys. Rev., 1965, 140, A1133–A1138 CrossRef
.
- J. P. Perdew, K. Burke and M. Ernzerhof, Phys. Rev. Lett., 1996, 77, 3865–3868 CrossRef CAS
.
- H. J. Monkhorst and J. D. Pack, Phys. Rev. B: Solid State, 1976, 13, 5188–5192 CrossRef
.
- G. Henkelman, B. P. Uberuaga and H. Jónsson, J. Chem. Phys., 2000, 113, 9901–9904 CrossRef CAS
.
- N. R. Mathews, E. R. Morales, M. A. Cortés-Jacome and J. A. Toledo Antonio, Sol. Energy, 2009, 83, 1499–1508 CrossRef CAS
.
- D. Lu, G. Hitoki, E. Katou, J. N. Kondo, M. Hara and K. Domen, Chem. Mater., 2004, 16, 1603–1605 CrossRef CAS
.
- K. Kawashima, M. Hojamberdiev, H. Wagata, K. Yubuta, S. Oishi and K. Teshima, Cryst. Growth Des., 2015, 15, 333–339 CrossRef CAS
.
- K. Kawashima, Y. Liu, J.-H. Kim, B. R. Wygant, I. Cheng, H. Celio, O. Mabayoje, J. Lin and C. B. Mullins, ACS Appl. Energy Mater., 2019, 2, 913–922 CrossRef CAS
.
- F. Song, W. Li, J. Yang, G. Han, P. Liao and Y. Sun, Nat. Commun., 2018, 9, 1–10 CrossRef
.
- K. Xu, P. Chen, X. Li, Y. Tong, H. Ding, X. Wu, W. Chu, Z. Peng, C. Wu and Y. Xie, J. Am. Chem. Soc., 2015, 137, 4119–4125 CrossRef CAS PubMed
.
- B. Liu, B. He, H.-Q. Peng, Y. Zhao, J. Cheng, J. Xia, J. Shen, T.-W. Ng, X. Meng, C.-S. Lee and W. Zhang, Advanced Science, 2018, 5, 1800406 CrossRef
.
- W. Ni, A. Krammer, C.-S. Hsu, H. M. Chen, A. Schüler and X. Hu, Angew. Chem., Int. Ed., 2019, 58, 7445–7449 CrossRef CAS
.
- L. Xia, Y. Liao, Y. Qing, H. Xu, Z. Gao, W. Li and Y. Wu, ACS Appl. Energy Mater., 2020, 3, 2996–3004 CrossRef CAS
.
- M. E. Kreider, A. Gallo, S. Back, Y. Liu, S. Siahrostami, D. Nordlund, R. Sinclair, J. K. Nørskov, L. A. King and T. F. Jaramillo, ACS Appl. Mater. Interfaces, 2019, 11, 26863–26871 CrossRef CAS
.
- S. Hu, C. Feng, S. Wang, J. Liu, H. Wu, L. Zhang and J. Zhang, ACS Appl. Mater. Interfaces, 2019, 11, 13168–13175 CrossRef CAS
.
- M. Shalom, D. Ressnig, X. Yang, G. Clavel, T. Patrick Fellinger and M. Antonietti, J. Mater. Chem. A, 2015, 3, 8171–8177 RSC
.
- R. Jamil, R. Ali, S. Loomba, J. Xian, M. Yousaf, K. Khan, B. Shabbir, C. F. McConville, A. Mahmood and N. Mahmood, Chem Catal., 2021, 1, 802–854 CrossRef CAS
.
- R. A. Márquez, K. Kawashima, Y. J. Son, R. Rose, L. A. Smith, N. Miller, O. A. Carrasco Jaim, H. Celio and C. B. Mullins, ACS Appl. Mater. Interfaces, 2022, 14, 42153–42170 CrossRef
.
- M. Grdeń, M. Alsabet and G. Jerkiewicz, ACS Appl. Mater. Interfaces, 2012, 4, 3012–3021 CrossRef
.
- C. C. L. McCrory, S. Jung, I. M. Ferrer, S. M. Chatman, J. C. Peters and T. F. Jaramillo, J. Am. Chem. Soc., 2015, 137, 4347–4357 CrossRef CAS PubMed
.
- Y. Zheng, Y. Jiao, M. Jaroniec and S. Z. Qiao, Angew. Chem., Int. Ed., 2015, 54, 52–65 CrossRef CAS
.
- B. You, X. Liu, G. Hu, S. Gul, J. Yano, D. Jiang and Y. Sun, J. Am. Chem. Soc., 2017, 139, 12283–12290 CrossRef CAS PubMed
.
- Y. J. Son, S. Kim, V. Leung, K. Kawashima, J. Noh, K. Kim, R. A. Marquez, O. A. Carrasco-Jaim, L. A. Smith, H. Celio, D. J. Milliron, B. A. Korgel and C. B. Mullins, ACS Catal., 2022, 12, 10384–10399 CrossRef CAS
.
- Y. Yoon, B. Yan and Y. Surendranath, J. Am. Chem. Soc., 2018, 140, 2397–2400 CrossRef CAS PubMed
.
- A. Radoń, Ł. Hawełek, D. Łukowiec, J. Kubacki and P. Włodarczyk, Sci. Rep., 2019, 9, 20078 CrossRef
.
- L. Li, P. Ma, S. Hussain, L. Jia, D. Lin, X. Yin, Y. Lin, Z. Cheng and L. Wang, Sustainable Energy Fuels, 2019, 3, 1749–1756 RSC
.
- M. E. G. Lyons, R. L. Doyle, I. Godwin, M. O'Brien and L. Russell, J. Electrochem. Soc., 2012, 159, H932 CrossRef CAS
.
- R. L. Doyle, I. J. Godwin, M. P. Brandon and M. E. G. Lyons, Phys. Chem. Chem. Phys., 2013, 15, 13737–13783 RSC
.
- S. Rebouillat, M. E. G. Lyons, M. P. Brandon and R. L. Doyle, Int. J. Electrochem. Sci., 2011, 6, 5830–5917 CrossRef CAS
.
- S. Tao, Q. Wen, W. Jaegermann and B. Kaiser, ACS Catal., 2022, 12, 1508–1519 CrossRef CAS
.
- M. W. Louie and A. T. Bell, J. Am. Chem. Soc., 2013, 135, 12329–12337 CrossRef CAS
.
- D. A. Corrigan and R. M. Bendert, J. Electrochem. Soc., 1989, 136, 723 CrossRef CAS
.
- L. Trotochaud, S. L. Young, J. K. Ranney and S. W. Boettcher, J. Am. Chem. Soc., 2014, 136, 6744–6753 CrossRef CAS
.
Footnote |
| † Electronic supplementary information (ESI) available: Digital photographs, additional XRD, SEM, EDX, and XPS results, cyclic voltammograms, linear sweep voltammograms, Tafel slopes, Bode plots, Nyquist plots, and chronopotentiometry test results. See DOI: https://doi.org/10.1039/d3ta06408e |
| This journal is © The Royal Society of Chemistry 2024 |


