Exploring the synergistic effect of aggregation and hydrogen bonding: a fluorescent probe for dual sensing of phytic acid and uric acid†
Rikitha S
Fernandes
and
Nilanjan
Dey
 *
*
Department of Chemistry, Birla Institute of Technology and Science Pilani, Hyderabad Campus, Hyderabad 500078, India. E-mail: nilanjandey.iisc@gmail.com; nilanjan@hyderabad.bits-pilani.ac.in
First published on 21st May 2024
Abstract
We synthesized an unoxidized bis-indolyl methane (BIM) derivative (probe 1) comprising of tetraphenylethylene (TPE) as the signalling moiety. The amphiphilic probe could form self-assembled nanoscopic aggregates in the aqueous medium. The emission of 1 in non-polar solvents originates from the LE state, while in polar solvents, it is dominated by TICT. Moreover, probe 1 exhibited a ‘turn-on’ fluorescence response for both uric acid (with a blue shift in emission maxima) and phytic acid (with a red shift in emission maxima). Therefore, the present system provides an exceptional opportunity to distinguish between phytic acid and uric acid by considering two different emission channels. Mechanistic investigations revealed that both H-bonding and electrostatic interactions between the probe and analytes could effectively cause restricted intramolecular rotations, leading to a turn-on response. Additionally, in the case of phytic acid, larger aggregates were observed with prominent CT characteristics. The change in the extent of charge transfer interaction in the formed adducts resulted in distinct fluorescence responses with phytic acid and uric acid. Furthermore, we explored the applicability of the present system in the screening of real-life samples, such as uric acid in urine samples and phytic acid in grains. The LOD for phytic acid and uric acid was found to be ∼5.48 nM and 10.4 nM, respectively. The quantitative nature of the system was confirmed, showing promising results in terms of recovery values (between 95.6% and 104.2%) and detection limits. Additionally, we also employed handy paper strips for the on-site monitoring of phytic acid and uric acid, thereby eliminating the need for complex instrumentation or trained technicians.
Introduction
Phytic acid (PA), also known as inositol hexaphosphate, is the major phosphorus-containing antinutrient found in cereal grains and oilseeds. The presence of a high density of phosphonic acid moieties in phytic acid allows it to form insoluble complexes with transition metal ions, such as calcium, iron, and zinc, resulting in lowering of their bioavailability in the human body. Also, phytic acid forms complexes with a diverse array of polysaccharides, making it susceptible to enzymatic hydrolysis. Despite this, the literature currently offers limited reports on the ‘direct’ fluorescent detection of phytic acid without involving any enzymatic decomposition reactions.1–3 Only a few fluorescent materials have been reported for monitoring phytic acid, including small fluorophores, conjugated polymers, and metal nanoclusters.4 Even these materials have some inherent limitations such as long response times, poor selectivity, complex synthesis processes, etc. that limit the practical applicability of these systems in real-life sample analysis. For instance, in the case of metal ion complex-based sensors for phytic acid detection, the sensitivity of the system is dependent on the stoichiometric relationship between the metal ion and phytic acid.5 Thus, there is an emerging need to develop a sensor system that can provide reliable optical signals against phytic acid in a more straightforward manner.On the other hand, uric acid (UA), an essential byproduct of human metabolism, emerges through the natural breakdown of purine nucleotides present in our daily dietary intake.6 However, the limited solubility of uric acid in blood serum leads to its accumulation within joint structures, significantly underpinning conditions such as gout, liver dysfunction, heart failure, and persistent inflammation. As a result, the monitoring of uric acid levels takes on paramount importance for the timely identification of disorders. Extensive investigations involving synthetic receptors have consistently demonstrated that hydrogen bonding either in isolation or in synergy with aromatic stacking stands as the main binding mechanism for UA detection.7–9 In a manner reminiscent of barbiturate derivatives, uric acid features several hydrogen bonding sites that render it an appealing guest molecule, which can engage in complementary hydrogen bonding interactions with a suitably designed host. To amplify the robustness, orientation/direction, and specificity of hydrogen bonding interactions, substantial research attention is directed towards the design of molecular assemblies that integrate an array of hydrogen bond donor and acceptor sites.10
Collectively, the ability of phytic acid to bind to essential minerals like iron and zinc affects their bioavailability, while uric acid levels can serve as indicators of metabolic health, including conditions like gout and kidney disease. Moreover, the simultaneous analysis of both compounds enables researchers and healthcare professionals to delve into the intricate relationship between dietary components and metabolic well-being, thereby aiding in disease prevention. Not only these, but it is also known in the literature that phytic acid can suppress the postprandial elevations of serum uric acid (SUA) levels in healthy adults by inhibiting purine nucleoside and base absorption.8
In this regard, molecular aggregates formed by organic π-conjugated systems can showcase remarkable alterations in their photophysical properties thereby exhibiting promising potential for biosensing and bioimaging applications.11 An intriguing and prominent emerging trend in supramolecular host–guest chemistry involves the incorporation of multipoint interactions during the binding process, which essentially improves both selectivity and sensitivity. Within the receptor, the presence of H-bonding sites, such as OH, NH, or positively charged groups, facilitates robust coordination with the guest species.12 Hydrogen bonding assumes a pivotal role in the establishment and maintenance of the intricate three-dimensional architecture inherent to a multitude of biological molecules. In this context, we have considered designing a bisindolyl based amphiphilic probe that can form stimuli-responsive supramolecular assembly both with and without involving guest analytes. The AIE-active bisindolyl probe 1, designed for this purpose, can differentiate uric acid and phytic acid (UA) through a strategic integration of hydrogen bonding, aggregation, and electrostatic interactions. The synergy between aggregation and hydrogen bonding lies in their collective ability to drive and regulate the formation of supramolecular assemblies. Intermolecular hydrogen bonding interactions play a crucial role in directing the molecular arrangement and facilitating the formation of specific structural motifs such as H/J aggregates and supramolecular chirality inversion. The significance of hydrogen bonds primarily arises from their site-specific interactions; characterized by easily predictable orientation, distance, and geometries. These interactions not only induce strong supramolecular associations but also enable precise control over the self-assembly process, thereby leading to well-defined architectures with enhanced functionalities. Moreover, the balance between hydrophobic and hydrogen bond interactions further influences the nature of the formed aggregates.13,14
In the present study, probe 1 exhibited a ‘turn-on’ response accompanied by a red-shifted and a blue-shifted emission band in the presence of phytic acid and uric acid in water respectively. This accomplishment not only demonstrates the potential for substantial selectivity but also showcases a remarkable affinity for the target analyte in aqueous environments. Here, it is worth noting that there is no report on small molecule-based probes that can distinguish uric acid and phytic acid by distinct optical responses in an aqueous medium. Additionally, the analyte-specific fluorescence response, merely by modulating the extent of aggregation and charge transfer, is not much known in the literature. This could provide tunable sensitivity, which broadens the scope of detection within larger sample domains, facilitating comprehensive sample scanning/testing across a diverse range of samples.
Results and discussion
Synthesis
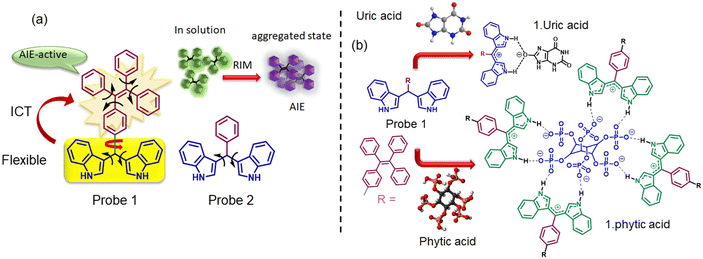
Probe 1 was synthesized according to the procedure reported by Lafzi et al.15 (See ESI,† S1, S2 and S3). Bis(indolyl) methane derivatives (BIMs) have been harnessed as hydrogen-bond donors in sensor applications. Moreover, the colour and optical response of the BIMs are significantly influenced by various factors, including the comprehensive extent of π-conjugation within the system, the electronic characteristics of the aryl moiety positioned at the meso-site, and the inherent conformational flexibility.16 Conversely, propeller-shaped, substituted tetraphenylethene (TPE) derivatives have garnered attention for their aggregation-induced emission (AIE) traits and mechanochromic behaviours. Notably, TPE and BIM moieties demonstrate entirely distinct properties and the combination of the two moieties within a single molecular framework holds promise as a pathway to novel fluorescent materials, capable of emitting light both in solution and in the aggregated state (Fig. 1a). Moreover, such scaffolds having both aggregation and H-bonding properties can plausibly exhibit significant spectral response towards the added analyte. As reported by Lafzi et al., the HOMO is located on the indole unit due to its electron-donating nature, and the LUMO is located over the entire TPE backbone, and such distinct HOMO–LUMO charge separations resulted in better ICT characteristics.15Solvatochromic response and nanoaggregate formation
The solvatochromic behaviour of probe 1 was investigated in a broad range of solvents such as tetrahydrofuran, hexane, chloroform, acetonitrile, dimethyl formamide, dimethyl sulfoxide, ethanol, and methanol (Fig. S4, ESI†). We observed the broadening of the fluorescence spectrum in polar solvents along with a red shift (24 nm) of emission maximum, from 400 to 424 nm upon moving from hexane to water. Additionally, there was significant diminution in the fluorescence intensity of the probe in the water medium. For such molecules with a strong ICT effect and positive solvatochromism, the fluorescence in solvents with large polarity could be quenched due to the twisted ICT (TICT) mechanism.17 Furthermore, we also checked the fluorescence response of probe 1 in acidic and alkaline media and observed fluorescence quenching and enhancement respectively, plausibly ascribed to the change in the protonation equilibrium.18 (Fig. S5, ESI†)In the aqueous medium, the UV-visible spectrum of probe 1 displayed broad absorption bands at 340 nm and 510 nm, attributed to the TPE unit (π to π*)19 and the intramolecular charge transfer (ICT) between the indole substituent and the TPE unit respectively.20 Additionally, the compound exhibited a prominent tailing extending into a longer wavelength region (Fig. S6, ESI†), due to the mie scattering resulting from nanoaggregates in the aqueous medium.21
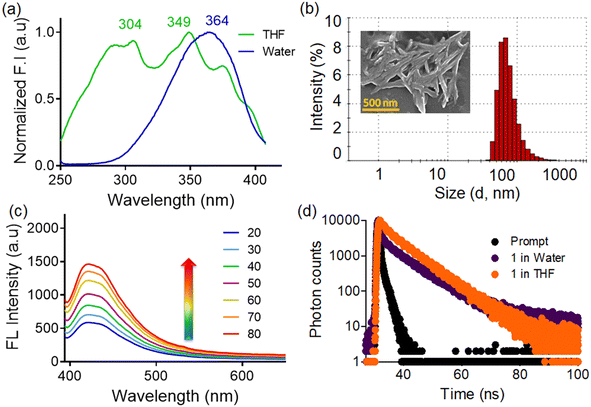
Upon excitation at 340 nm, probe 1 displayed highly structured fluorescence spectra in THF with emission maxima at 405 nm, whereas the spectrum was broad, red-shifted (λmax at 424 nm), and comparatively less intense in the aqueous medium. In THF, the probe was almost non-fluorescent,15 probably involving the impact of rotational motions within molecular rotors, which are believed to have actively dissipated exciton energy and consequently, augmented nonradiative decay rates, leading to non-emission.22 Conversely, the quenched emission in water could be attributed to the TICT mechanism.23,24 To evaluate whether the observed broad spectrum in water is due to single or multiple photoactive species, we recorded the excitation spectra at different emission wavelengths in the aqueous medium (Fig. 2a). The excitation spectrum corresponding to the 405 nm emission band exhibited peaks at 304 nm and 349 nm, whereas the excitation spectrum for 424 nm emission showed an additional broad peak at ∼364 nm, which conveyed that at least two photoactive species were present in the equilibrium.21,25 Hence, the emission band at 405 nm is likely associated with loosely aggregated species, while the emission band at ∼424 nm may be attributed to more compact aggregated species. The self-assembly/aggregate formation is possibly due to the face-to-face molecular packing structure, facilitated by quadruple intermolecular CH/π-interactions among the tetraphenylethylene functionalities.26 The DLS (dynamic light scattering) experiments reveal that the hydrodynamic diameter of probe 1 was measured to be 164.2 ± 18.7, in the aqueous medium, thereby indicating the formation of nanoscopic self-assemblies (Fig. 2b). The FESEM images reveal distinct rod-like structures with well-defined dimensions, which join together side-by-side, to form aggregates (Fig. 2b inset). These rod-like structures are the result of π–π interactions between the bisindolyl core and further solvophobic interactions originating from the TPE periphery. Additionally, we also investigated the effect of temperature on the fluorescence response of 1 in the aqueous medium (Fig. 2c). As the solution temperature increased gradually from 20 °C to 80 °C, the fluorescence intensity increased, due to the enhancement in the formation of the TICT state of the probe.27,28 Additionally, flourescence lifetime experiments (TCSPC) were conducted for probe 1 to understand the stability and decay kinetics of excited state photoactive species. The compound exhibited a biexponential decay profile in THF with an average time constant of ∼5.02 ns, while a multiexponential decay with an average lifetime of ∼6.43 ns was observed in the aqueous medium (Fig. 2d). The presence of photoexcited species, characterized by a longer average lifetime, indicates the self-assembly of probe molecules in the aqueous medium with prominent π–π stacking interactions.
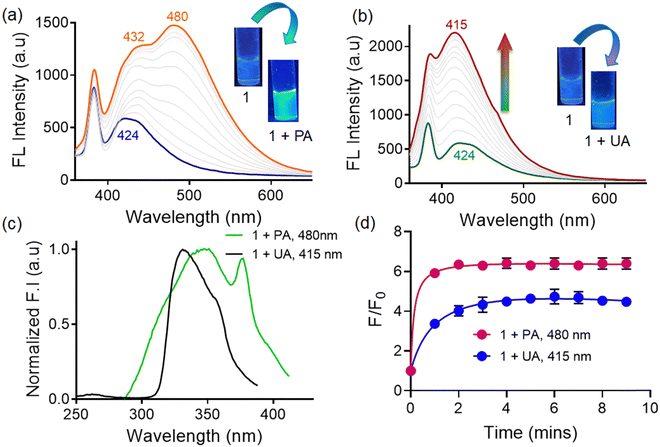
Conversely, probe 1 displayed emission enhancement (∼4-fold) along with a slight blue-shift (∼10 nm) in the presence of uric acid accompanied by the appearance of a bright violet-blue colored fluorescence (Fig. 3b). The substantial enhancement in emission intensity of the probe can be ascribed to the restriction of intramolecular rotations (RIRs) in the respective adducts, which remarkably activates the radiative pathway. This activation of the radiative pathway leads to a progressive increase in emission intensity proportionate to the extent of aggregation.32 Concurrently, the adoption of twisted conformations by the tetraphenylethylene segment serves to elongate the intermolecular distances, effectively mitigating emission quenching through the reduction of intermolecular π–π interactions. As a result, the charge-transfer characteristics of the aggregates become more prominent with distinct luminescence responses.33
It is really important to consider whether the bathochromic/hypsochromic shift observed for probe 1 upon phytic/uric acid addition was due to ground state effects or was a result of excited state processes. The excitation spectra of the probe upon addition of phytic acid and uric acid exhibited two different bands at 480 and 415 nm respectively. This indicates the presence of two different photoactive species upon adduct formation, thereby suggesting a ground state heterogeneity (Fig. 3c).34 Nevertheless, we recorded the time-dependent fluorescence response of probe 1 towards phytic acid and uric acid (Fig. 3d). In the case of phytic acid, we witnessed an immediate change in fluorescence intensity (within 1 min) with no further time-delayed response. On the other hand, it took ∼4 min of incubation time to observe changes with uric acid. All the subsequent studies with uric acid were performed after 5 min of incubation time.
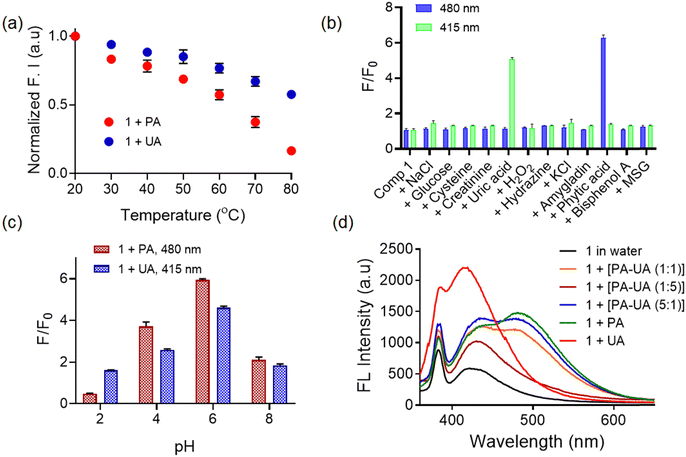
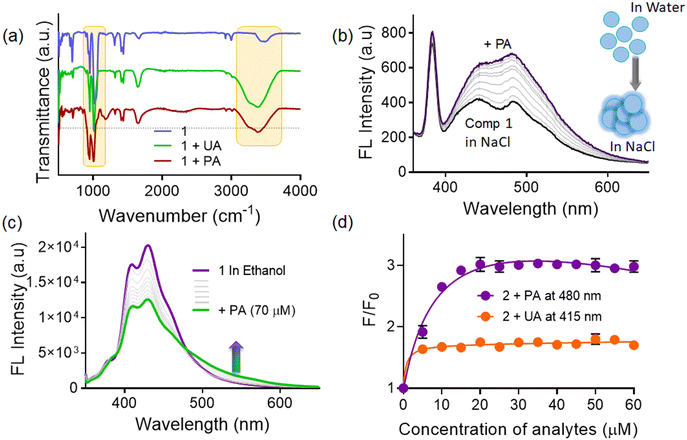
Furthermore, to confirm the intermolecular hydrogen-bonding within the aggregates, we recorded the temperature dependent emission spectra of the probe in the presence of phytic acid and uric acid (Fig. 4a). As reported in the literature, the formation of hydrogen bonds is thermodynamically favoured, and hence the aggregation process could be temperature dependent. Generally, intermolecular hydrogen bonding is quite stable at low temperatures, whereas at high temperatures, the H-bonds would be weakened/destroyed.35 As the temperature increases, there is a substantial decrease in the emission intensity without any blue shift of the emission maxima. This suggests a weak intermolecular hydrogen bonding between the probe and analytes at higher temperatures. Additionally, the 1.PA adduct revealed a larger extent of decrease in emission intensity (ongoing from 20 °C to 80 °C) when compared to the 1.UA adduct. This could probably be due to the dissociation of preformed larger nanoaggregate 1.PA structures at higher temperatures.36,37 The stability of non-covalent forces governing the formation of aggregate assemblies is compromised with increasing temperature, resulting in the dissociation of hydrogen bonded aggregates, which results in a notable reduction in the emission intensity.38
To further substantiate these electrostatic interactions, we measured the zeta potential value of the probe with and without phytic acid in the aqueous medium. Initially, the probe exhibited a slightly positive zeta potential, which upon incremental addition of phytic acid gradually became negative. Such concentration-dependent variation in zeta potential values indicated that the phosphate groups of PA interacted with the probe via electrostatic interactions.
Additionally, we also evaluated the mutual interference of phytic acid and uric acid on the fluorescence response of probe 1 (Fig. 4d). Even in the presence of a very small amount (1![[thin space (1/6-em)]](https://www.rsc.org/images/entities/char_2009.gif) :
:![[thin space (1/6-em)]](https://www.rsc.org/images/entities/char_2009.gif) 5) of phytic acid in the mixture, the fluorescence spectra became broad and red-shifted. Interestingly, when probe 1 was treated with a mixture of equimolar amounts of phytic and uric acids, the fluorescence spectra resembled that of a 1 + PA mixture. This indicated that probe 1 could preferably bind with phytic acid even in the presence of uric acid in excess. This preferential response towards phytic acid could be attributed to the high density of negatively charged phosphate groups which provide a diverse array of viable cross-linking sites40 thereby forming electrostatic and hydrogen bonding interactions with probe 1 (Fig. 1b).
5) of phytic acid in the mixture, the fluorescence spectra became broad and red-shifted. Interestingly, when probe 1 was treated with a mixture of equimolar amounts of phytic and uric acids, the fluorescence spectra resembled that of a 1 + PA mixture. This indicated that probe 1 could preferably bind with phytic acid even in the presence of uric acid in excess. This preferential response towards phytic acid could be attributed to the high density of negatively charged phosphate groups which provide a diverse array of viable cross-linking sites40 thereby forming electrostatic and hydrogen bonding interactions with probe 1 (Fig. 1b).
![[double bond, length as m-dash]](https://www.rsc.org/images/entities/char_e001.gif) O groups, along with the anti-symmetrical (1070 cm−1) and symmetrical frequencies of the P–O–C groups (931 cm−1), were shifted to lower or higher frequencies. Additionally, there was a shift in the indole –NH band from 3416 to 3368 cm−1, suggesting the interactions between phytic acid and the probe41 (Fig. 5a and Fig. S8, ESI†). Phytic acid has six phosphate groups, each with two titratable hydrogen ions, whose pKa values range from 1.9 to 9.5. Thus, at physiological pH, around 8–9 phosphate units will remain in the deprotonated form.42 Therefore, we anticipated that the phosphate of phytic acid could interact with the probe via electrostatic interactions.43 On the other hand, a similar FTIR spectral change was observed for the 1.UA conjugate. Uric acid is a diprotic acid with pKa1 = 5.4 and pKa2 = 10.3. Therefore, at physiological pH, the monoanionic urate form will predominate. Hence, the urate ion can engage in electrostatic interactions, and the free NH of the urate can involve in hydrogen bonding with the probe respectively.
O groups, along with the anti-symmetrical (1070 cm−1) and symmetrical frequencies of the P–O–C groups (931 cm−1), were shifted to lower or higher frequencies. Additionally, there was a shift in the indole –NH band from 3416 to 3368 cm−1, suggesting the interactions between phytic acid and the probe41 (Fig. 5a and Fig. S8, ESI†). Phytic acid has six phosphate groups, each with two titratable hydrogen ions, whose pKa values range from 1.9 to 9.5. Thus, at physiological pH, around 8–9 phosphate units will remain in the deprotonated form.42 Therefore, we anticipated that the phosphate of phytic acid could interact with the probe via electrostatic interactions.43 On the other hand, a similar FTIR spectral change was observed for the 1.UA conjugate. Uric acid is a diprotic acid with pKa1 = 5.4 and pKa2 = 10.3. Therefore, at physiological pH, the monoanionic urate form will predominate. Hence, the urate ion can engage in electrostatic interactions, and the free NH of the urate can involve in hydrogen bonding with the probe respectively.
Furthermore, to prove the electrostatic interactions, we recorded the fluorescence spectra of probe 1 upon addition of phytic acid and uric acid in a 6.3 M NaCl solution. In the presence of NaCl, the probe displayed emission maxima at 442 and 480 nm, which further showed enhancement with both phytic acid (Fig. 5b) and uric acid (Fig. S9, ESI†). However, the extents of fluorescence enhancement in this case were found to be lower than that observed with a native probe (in the aqueous medium). This fluorescence enhancement could probably be attributable to the screening effect induced by the presence of salt, which validates the formation of an electrostatic complex between the probe and the anionic urate and phytate species. In order to confirm the hydrogen bonding interaction between probe 1 and phytic acid, we recorded the fluorescence spectra of probe 1 upon addition of phytic acid, in ethanol. We observed enhancement in the fluorescence signal at 430 nm, accompanied by the gradual emergence of a new red shifted band at 525 nm (Fig. 5c). Here also, the extent of change was not as prominent as observed in the water medium.
Furthermore, we recorded the 1H-NMR spectra of probe 1 in the presence of phytic acid (1 equiv.) and uric acid (1 equiv.) in a DMSO-d6:D2O (1![[thin space (1/6-em)]](https://www.rsc.org/images/entities/char_2009.gif) :
:![[thin space (1/6-em)]](https://www.rsc.org/images/entities/char_2009.gif) 1) mixture medium. The 1H-NMR spectra in both cases revealed an upfield shift, along with significant peak broadening and poorly resolved peaks, only in the case of phytic acid. Such upfield shift and broadening can be attributed to the hydrogen bonding driven aggregation.44 The upfield shift could possibly be initiated via H-bonding or electrostatic interactions between analytes and probe 1, based on which the self-assembly/aggregation increases drastically. The probe exhibits two hydrogen-bond donor sites, namely the two –NH functionalities, and hence can involve in binding with uric acid (UA) through donor–acceptor interactions. On the other hand, uric acid, being a dibasic acid, undergoes ionization to form a singly charged hydrogen ion or acid urate ion under physiological pH conditions, which involves the deprotonation of nitrogen within the molecule. Additionally, it uses a tautomeric ketone/hydroxyl group as an electron-absorbing moiety.45 Hence, the formation of hydrogen bonds can occur between the ketone/hydroxyl group of the uric acid (UA) molecule and the –NH functionality of the probe. The probe itself is weakly emissive, but the significant fluorescence enhancement observed upon uric acid addition could be possibly attributed to the formation of a 1
1) mixture medium. The 1H-NMR spectra in both cases revealed an upfield shift, along with significant peak broadening and poorly resolved peaks, only in the case of phytic acid. Such upfield shift and broadening can be attributed to the hydrogen bonding driven aggregation.44 The upfield shift could possibly be initiated via H-bonding or electrostatic interactions between analytes and probe 1, based on which the self-assembly/aggregation increases drastically. The probe exhibits two hydrogen-bond donor sites, namely the two –NH functionalities, and hence can involve in binding with uric acid (UA) through donor–acceptor interactions. On the other hand, uric acid, being a dibasic acid, undergoes ionization to form a singly charged hydrogen ion or acid urate ion under physiological pH conditions, which involves the deprotonation of nitrogen within the molecule. Additionally, it uses a tautomeric ketone/hydroxyl group as an electron-absorbing moiety.45 Hence, the formation of hydrogen bonds can occur between the ketone/hydroxyl group of the uric acid (UA) molecule and the –NH functionality of the probe. The probe itself is weakly emissive, but the significant fluorescence enhancement observed upon uric acid addition could be possibly attributed to the formation of a 1![[thin space (1/6-em)]](https://www.rsc.org/images/entities/char_2009.gif) :
:![[thin space (1/6-em)]](https://www.rsc.org/images/entities/char_2009.gif) 1 complex between the probe and UA via complementary H-bonding.46 The H-bonding interactions between the probe and UA were found to be responsible for the turn-on fluorescence response. Such uric acid-mediated turn on fluorescence has been reported by Pradhan et al.47 This intermolecular hydrogen bonding was further confirmed through FT-IR analysis, providing substantive evidence for the formation of hydrogen bonds between these distinct functional groups. Furthermore, to evaluate the H-bonding interaction between the probe and analytes, we also recorded the fluorescence spectra of the probe upon addition of phytic and uric acids in 7 M urea (Fig. S10, ESI†). We observed that the probe displayed emission maxima at 407 nm, which further showed a red-shifted band at 448 nm accompanied by fluorescence enhancement (∼1.2 fold) upon phytic acid addition. On the other hand, the addition of uric acid only led to fluorescence enhancement (∼1.4 fold) of the emission band centered at 407 nm. However, the extent of fluorescence spectral change in these cases was observed to be quite lower than that observed with the probe in the aqueous medium. Additionally, to know the significance of the TPE unit, we employed probe 2 possessing a single phenyl ring at the meso-position of the BIM backbone (Fig. 5d). We observed a similar fluorescence ‘turn-on’ response to that of probe 1 but the extent of response was lower compared to that of probe 1 for phytic acid (∼2.8-fold) and uric acid (∼1.6-fold). This indicates that the presence of the TPE moiety enhances the propensity of molecular self-assembly, which in turn enhances the fluorescence signal upon addition of phytic acid.
1 complex between the probe and UA via complementary H-bonding.46 The H-bonding interactions between the probe and UA were found to be responsible for the turn-on fluorescence response. Such uric acid-mediated turn on fluorescence has been reported by Pradhan et al.47 This intermolecular hydrogen bonding was further confirmed through FT-IR analysis, providing substantive evidence for the formation of hydrogen bonds between these distinct functional groups. Furthermore, to evaluate the H-bonding interaction between the probe and analytes, we also recorded the fluorescence spectra of the probe upon addition of phytic and uric acids in 7 M urea (Fig. S10, ESI†). We observed that the probe displayed emission maxima at 407 nm, which further showed a red-shifted band at 448 nm accompanied by fluorescence enhancement (∼1.2 fold) upon phytic acid addition. On the other hand, the addition of uric acid only led to fluorescence enhancement (∼1.4 fold) of the emission band centered at 407 nm. However, the extent of fluorescence spectral change in these cases was observed to be quite lower than that observed with the probe in the aqueous medium. Additionally, to know the significance of the TPE unit, we employed probe 2 possessing a single phenyl ring at the meso-position of the BIM backbone (Fig. 5d). We observed a similar fluorescence ‘turn-on’ response to that of probe 1 but the extent of response was lower compared to that of probe 1 for phytic acid (∼2.8-fold) and uric acid (∼1.6-fold). This indicates that the presence of the TPE moiety enhances the propensity of molecular self-assembly, which in turn enhances the fluorescence signal upon addition of phytic acid.
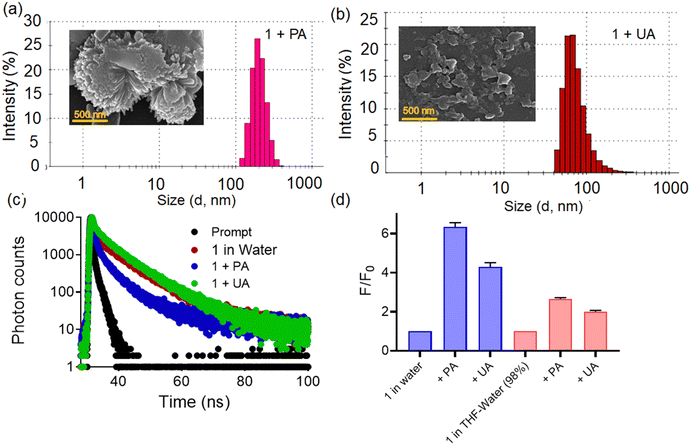
Furthermore, DLS experiments showed the presence of colloidal aggregates with larger dimensions for 1.PA (Fig. 6a and b). The hydrodynamic diameter of the probes 1.PA and 1.UA was measured to be 272.2 ± 16.7 and 184.2 ± 13.5 in the aqueous medium. Furthermore, the FESEM images of 1.PA and 1.UA also displayed rod-shaped clumped flower-like larger aggregated structures and small spherical agglomerated structures respectively. Based on the above observations, it can be concluded that the extent of aggregation was more in 1.PA when compared to 1.UA. Nevertheless, the change in average fluorescence lifetime of 1 was observed, shifting from 6.043 to 2.23 ns and 5.02 ns upon the addition of phytic acid and uric acid respectively (Fig. 6c). Such lowering of the average fluorescence lifetime also indicated more charge transfer interaction in the 1.PA aggregates. Additionally, we also evaluated the fluorescence response of probe 1 towards phytic acid and uric acid, in water and in a THF–water (98%) mixture (AIE active condition) (Fig. 6d). We observed that the fluorescence response in water was ∼3 times higher than that observed in the THF–water (98%) mixture. This could plausibly be attributed to the solute–solvent interactions and also the different nature of aggregates in both solvents.
Application to real life samples
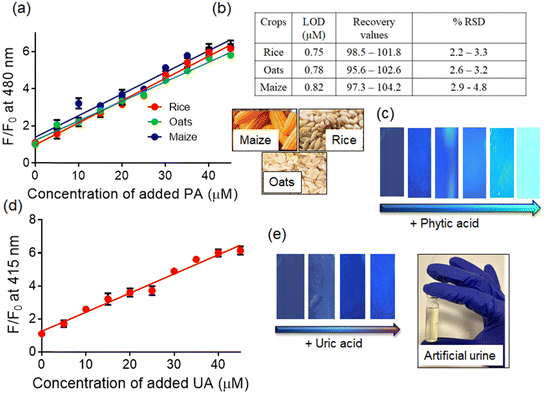
In order to achieve on-site detection of phytic acid, we devised a test strip method involving the immersion of test paper discs into solutions containing probe 1. The coated paper strips showed blue fluorescence when exposed to UV light (<365 nm). However, spiking the strips with an aqueous solution of phytic acid resulted in a gradual change in the fluorescent color from blue to bright cyan (Fig. 7c). Moreover, the small size of the paper discs facilitates convenient portability, and the simplicity of the present protocol makes it user-friendly for individuals with limited scientific knowledge.
Additionally, we employed pre-coated dye paper discs for on-site detection of uric acid. Probe 1 displayed blue emission, which then gradually changed to bright blue emission upon increasing the concentration of uric acid. The addition of other biologically relevant analytes did not induce any noticeable change in the colour of the paper strips, thereby confirming the distinctive selectivity of 1 towards uric acid.
Additionally, we have also used probe 1 for uric acid detection in real urine samples by fluorescence spectroscopy (Fig. S11, ESI†). Three different urine samples were collected from healthy individuals and stored at −20 °C immediately, and then for spectroscopic studies, the urine samples were diluted with a buffered medium. The probe displayed a concentration-dependent fluorescence enhancement (∼3.8-fold) along with a blue-shift of emission maxima (10 nm) in the presence of uric acid. A good linear correlation was observed between the fluorescence spectral change and the concentrations of spiked UA. No interference was observed with other interfering analytes.
Interestingly, the minimum detectable concentration of uric acid was estimated to be 9.5 μM using the fluorescence method and was found to be in a very close agreement with the clinical laboratory measurement (10.1 μM).50 Furthermore, quantitative analysis indicates that the recovery values for the estimation of uric acid varied from 96.3% to 102.9%, while the relative standard deviations were in the range of 2.1–4.5%, thereby suggesting that the present system could be used for UA determination in real-life samples.
Conclusion
We have employed an AIE-active probe, comprising a tetraphenylethylene unit with a bisindolyl functionality, for the simultaneous detection of phytic acid (appearance of cyan-colored fluorescence) and uric acid (appearance of blue-colored fluorescence). Our findings reveal that the probe formed nanoscopic self-assemblies in an aqueous medium, ascribed to the role of π–π interaction in the compact aggregates. Furthermore, it was observed that merely by choosing suitable emission channels, we can selectively detect either of the analytes. The probe exhibited ∼6.2-fold fluorescence enhancement accompanied by a red-shift upon phytic acid addition, whereas it displayed ∼4-fold fluorescence enhancement accompanied by a blue-shift upon uric acid addition. Moreover, spectroscopic studies reveal that the probe interacts with phytic acid and uric acid via both H-bonding and electrostatic interactions, resulting in restricted intramolecular rotation (RIR) and therefore the observed fluorescence ‘turn-on’ response. Additionally, in the case of phytic acid, larger aggregates were observed with prominent CT characteristics, owing to the presence of a greater number of phytate ions. This intricate self-assembly phenomenon is primarily governed by a combination of solvophobic interactions and hydrogen bonding, and electrostatic interactions. Interestingly, probe 1 could preferably bind with phytic acid even in the presence of uric acid in excess. Nevertheless, we explored the potential application of the probe in real-life scenarios such as in the quantification of phytic acid in grain extracts and the detection of uric acid in urine samples. We also employed test-paper strips for on-site detection of phytic acid and uric acid, which exhibited high accuracy and precision, making it a promising tool for the precise estimation of trace levels of these analytes in diverse matrices.Conflicts of interest
The authors declare no conflict of interest.Acknowledgements
N. D. acknowledges BITS-Pilani (Hyderabad campus) for all technical and financial support, especially the research initiation grant (RIG). R. S. F. thanks BITS Pilani (Hyderabad) for a research fellowship. The authors also thank the central analytical facilities of BITS-Pilani for providing technical support and laboratory facilities.References
- H. Shi, A. Zhang, H. Du, M. Zhang, Y. Zhang, H. Huang, Y. Xiao, Y. Zhang, X. He and K. Wang, A Novel Fluorescent Nanosensor Based on Small-Sized Conjugated Polyelectrolyte Dots for Ultrasensitive Detection of Phytic Acid, Talanta, 2019, 202, 214–220 CrossRef CAS
.
- M. Lee, J. H. Moon, E. J. Jun, G. Kim, Y.-U. Kwon, J. Y. Lee and J. Yoon, A Tetranaphthoimidazolium Receptor as a Fluorescent Chemosensor for Phytate, Chem. Commun., 2014, 50(44), 5851–5853 RSC
.
- Q. Chen, M. Li, F. Zhang, R. Li, G. Chen, S. H. Zhu and H. Wang, A Turn-on Fluorescent Probe for Phytic Acid Based on Ferric Ion-Modulated Glutathione-Capped Silver Nanoclusters, Anal. Methods, 2016, 8(34), 6382–6387 RSC
.
- Z. Huang, Y. Gao, Z. Huang, D. Chen, J. Sun and L. Zhou, Sulfur Quantum Dots: A Novel Fluorescent Probe for Sensitive and Selective Detection of Fe3+ and Phytic Acid, Microchem. J., 2021, 170, 106656 CrossRef CAS
.
- M. Kamaya, T. Furuki, K. Nagashima, E. Ishii and H. Saito, Indirect Spectrophotometric Determination of Phytic Acid with Zinc Chloranilate, Phytochem. Anal., 1995, 6(5), 251–254 CrossRef CAS
.
- R. El Ridi and H. Tallima, Physiological Functions and Pathogenic Potential of Uric Acid: A Review, J. Adv. Res., 2017, 8(5), 487–493 CrossRef CAS
.
- J. S. Lindsey, P. C. Kearney, R. J. Duff, P. T. Tjivikua and J. Rebek, Molecular Recognition: Multipoint Contacts with New Sizes and Shapes, J. Am. Chem. Soc., 1988, 110(19), 6575–6577 CrossRef CAS
.
- T. Ikenaga, K. Kakumoto, N. Kohda and T. Yamamoto, Effect of inositol hexaphosphate (IP6) on serum uric acid in hyperuricemic subjects: a randomized, double-blind, placebo-controlled, crossover study, Plant Foods Hum. Nutr., 2019, 74(3), 316–321 CrossRef CAS PubMed
.
- K. S. Jeong and J. Rebek, Molecular Recognition: Hydrogen Bonding and Aromatic Stacking Converge to Bind Cytosine Derivatives, J. Am. Chem. Soc., 1988, 110(10), 3327–3328 CrossRef CAS
.
- C. Schmuck and W. Wienand, Self-Complementary Quadruple Hydrogen-Bonding Motifs as a Functional Principle: From Dimeric Supramolecules to Supramolecular Polymers, Angew. Chem., Int. Ed., 2001, 40(23), 4363 CrossRef CAS
.
- S.-J. Yoon, J. W. Chung, J. Gierschner, K. S. Kim, M.-G. Choi, D. Kim and S. Y. Park, Multistimuli Two-Color Luminescence Switching via Different Slip-Stacking of Highly Fluorescent Molecular Sheets, J. Am. Chem. Soc., 2010, 132(39), 13675–13683 CrossRef CAS
.
- J. R. Askim, M. Mahmoudi and K. S. Suslick, Optical Sensor Arrays for Chemical Sensing: The Optoelectronic Nose, Chem. Soc. Rev., 2013, 42(22), 8649 RSC
.
- R. L. Narendran and A. Patnaik, Synergistic effect of hydrophobic and hydrogen bonding interaction-driven viologen–pyranine charge-transfer aggregates: adenosine monophosphate recognition, Soft Matter, 2021, 17(4), 903–914 RSC
.
- D. Zhou, Y. Wang, J. Jia, W. Yu, B. Qu, X. Li and X. Sun, H-Bonding and charging mediated aggregation and emission for fluorescence turn-on detection of hydrazine hydrate, Chem. Commun., 2015, 51(53), 10656–10659 RSC
.
- F. Lafzi, H. Kilic, B. Ertugrul, M. Arik and N. Saracoglu, Bis(Indolyl)Methane Substituted Tetraphenylethylene Derivatives as Aie Active Materials, J. Lumin., 2019, 208, 174–182 CrossRef CAS
.
- R. S. Fernandes and N. Dey, Modulation of Analytical Performance of a Bifunctional Optical Probe at the Micelle-water Interface: Selective Sensing of Histidine in Biological Fluid, Asian J. Org. Chem., 2022, 11(8), e202200257 CrossRef CAS
.
- S. Paul, R. S. Fernandes and N. Dey, PPB-Level, Dual Channel Sensing
of Cyanide and Bisulfate Ions in an Aqueous Medium: Computational Rationalization of the Ion-Dependent ICT Mechanism, New J. Chem., 2022, 46(39), 18973–18983 RSC
.
- B. Chettri, S. Jha and N. Dey, Tuning Anion Binding Properties of Bis(Indolyl)Methane Receptors: Effect of Substitutions on Optical Responses, Spectrochim. Acta, Part A, 2023, 287, 121979 CrossRef CAS PubMed
.
- X. Zhang, G. Lin, H. Guo and F. Yang, Tetraphenylethylene-Rufigallol-Tetraphenylethylene Trimers: Novel Fluorescence Liquid Crystals in Aggregated States, J. Mol. Struct., 2022, 1249, 131643 CrossRef CAS
.
- F. Lafzi, Y. Taskesenligil, B. Canımkurbey, S. Pıravadılı, H. Kilic and N. Saracoglu, Four-Winged Propeller-Shaped Indole-Modified and Indole-Substituted Tetraphenylethylenes: Greenish-Blue Emitters with Aggregation-Induced Emission Features for Conventional Organic Light-Emitting Diodes, ACS Omega, 2022, 7(48), 44322–44337 CrossRef CAS PubMed
.
- R. S. Fernandes and N. Dey, Metal Ion Responsive Bifunctional Bis(Indolyl)Methane Derivative: Excitation-Triggered Alteration in the Sensing Behavior, Mater. Chem. Phys., 2023, 302, 127637 CrossRef CAS
.
- D. Wang, H. Su, R. T. Kwok, X. Hu, H. Zou, Q. Luo, M. M. S. Lee, W. Xu, J. W. Lam and B. Z. Tang, Rational Design of a Water-Soluble NIR AIEgen, and Its Application in Ultrafast Wash-Free Cellular Imaging and Photodynamic Cancer Cell Ablation, Chem. Sci., 2018, 9(15), 3685–3693 RSC
.
- C. Wang, W. Chi, Q. Qiao, D. Tan, Z. Xu and X. Liu, Twisted Intramolecular Charge Transfer (TICT) and Twists beyond Tict: From Mechanisms to Rational Designs of Bright and Sensitive Fluorophores, Chem. Soc. Rev., 2021, 50(22), 12656–12678 RSC
.
- M. Hu, F. Ye, C. Du, W. Wang, W. Yu, M. Liu and Y. Zheng, Hindered Tetraphenylethylene Helicates: Chiral Fluorophores with Deep-blue Emission, Multiple-color CPL, and Chiral Recognition Ability, Angew. Chem., 2021, 134, 8 Search PubMed
.
- R. S. Fernandes and N. Dey, Oxidized Bis(Indolyl)Methane Derivatives with Diverse Signaling Units: An Excitation-Dependent Fluorescence Response toward Heavy Metal Pollutants in an Aqueous Medium, Ind. Eng. Chem. Res., 2023, 62(50), 21536–21545 CrossRef CAS
.
- L. Yu, M. Zhang, D. Lou, J. Li, X. Wang and M. Bai, CH/π-Interaction-Driven Self-Assembly of Tetraphenylethylene Derivatives into the Face to Face Arrangement, RSC Adv., 2021, 11(4), 2377–2382 RSC
.
- N. Dash and G. Krishnamoorthy, Effect of Temperature on the Spectral Characteristics of 2-(4′-N,N-Dimethylaminophenyl)Imidazo[4,5-b]Pyridine, Spectrochim. Acta, Part A, 2012, 95, 540–546 CrossRef CAS
.
- R. S. Fernandes and N. Dey, A Combinatorial Effect of TICT and Aie on Bisulfate Detection Using a Pyrenylated Charge-Transfer Luminogen, Mater. Res. Bull., 2023, 163, 112192 CrossRef CAS
.
- N. Dey, S. Jha and S. Bhattacharya, Visual Detection of a Nerve Agent Simulant Using Chemically Modified Paper Strips and Dye-Assembled Inorganic Nanocomposite, Analyst, 2018, 143(2), 528–535 RSC
.
- N. Dey, Metal-Ion-Responsive Chromogenic Probe for Rapid, on-Location Detection of Foodborne Bacterial Pathogens in Contaminated Food Items, ACS Appl. Bio Mater., 2021, 4(9), 6893–6902 CrossRef CAS PubMed
.
- L. Centeno, J. Romero-García, C. Alvarado-Canché, C. Gallardo-Vega, G. Télles-Padilla, E. Díaz Barriga-Castro, E. N. Cabrera-Álvarez, A. Ledezma-Pérez and A. de León, Green Synthesis of Graphene Quantum Dots from Opuntia Sp. Extract and Their Application in Phytic Acid Detection, Sens. Bio-Sens. Res., 2021, 32, 100412 CrossRef
.
- Y. Tian, D. Yin and L. Yan, J-aggregation Strategy of Organic Dyes for Near-infrared Bioimaging and Fluorescent Image-guided Phototherapy, Wiley Interdiscip. Rev.: Nanomed. Nanobiotechnol., 2022, 15(1), e1831 Search PubMed
.
- Y. Yang, D. Deng, X. Deng, Z. Chen and S. Pu, Triphenylamine, Carbazole or Tetraphenylethylene-Functionalized Benzothiadiazole Derivatives: Aggregation-Induced Emission (AIE), Solvatochromic and Different Mechanoresponsive Fluorescence Characteristics, Molecules, 2022, 27(15), 4740 CrossRef CAS
.
- H. V. Barkale and N. Dey, Phenazine-Based Fluorescence Probes for Simultaneous Sensing of Silver and Iodide Ions, J. Mol. Struct., 2023, 137427 Search PubMed
.
- A. Wang, R. Fan, Y. Dong, Y. Song, Y. Zhou, J. Zheng and Y. Yang, Novel hydrogen-bonding cross-linking aggregation-induced emission: water as a fluorescent “ribbon” detected in a wide range, ACS Appl. Mater. Interfaces, 2017, 9(18), 15744–15757 CrossRef CAS
.
- A. Gulyani, N. Dey and S. Bhattacharya, Highly Responsive Fluorescent Assemblies Allow for Unique, Multiparametric Sensing of the Phospholipid Membrane Environment, Chem. Eur. J., 2018, 25(6), 1507–1514 CrossRef
.
- R. S. Fernandes and N. Dey, Polarity-Independent Temperature-Induced Reversible Fluorescence Switching of Organic Nanoparticles: Application to Intracellular Temperature Imaging, ACS Appl. Nano Mater., 2023, 6(7), 5168–5176 CrossRef CAS
.
- R. S. Fernandes, J. Kumari, D. Sriram and N. Dey, Fluorescent Nanoassembly of Tetrazole-Based Dyes with Amphoteric Surfactants: Investigation of Cyanide Sensing and Antitubercular Activity, ACS Appl. Bio Mater., 2023, 6(10), 4158–4167 CrossRef CAS
.
- J. Liu, X. Yang, K. Wang, R. Yang, H. Ji, L. Yang and C. Wu, A switchable fluorescent quantum dot probe based on aggregation/disaggregation mechanism, Chem. Commun., 2011, 47(3), 935–937 RSC
.
- X. Song, Y. Chen, M. Rong, Z. Xie, T. Zhao, Y. Wang, X. Chen and O. S. Wolfbeis, A Phytic Acid Induced Super-amphiphilic Multifunctional 3D Graphene-based Foam, Angew. Chem., Int. Ed., 2016, 55(12), 3936–3941 CrossRef CAS
.
- L. D. Carli, E. Schnitzler, M. Ionashiro, B. Szpoganicz and N. D. Rosso, Equilibrium, Thermoanalytical and Spectroscopic Studies to Characterize Phytic Acid Complexes with Mn(Ii) and Co(Ii), J. Braz. Chem. Soc., 2009, 20(8), 1515–1522 CrossRef
.
- W. J. Evans, E. J. McCourtney and R. I. Shrager, Titration studies of phytic acid, J. Am. Oil Chem. Soc., 1982, 59(4), 189–191 CrossRef CAS
.
- N. A. Khan and S. H. Jhung, Phytic Acid-Encapsulated MIL-101(CR): Remarkable Adsorbent for the Removal of Both Neutral Indole and Basic Quinoline from Model Liquid Fuel, J. Chem. Eng., 2019, 375, 121948 CrossRef CAS
.
- A. Brzechwa-Chodzyńska, G. Markiewicz, P. Cecot, J. Harrowfield and A. R. Stefankiewicz, Self-assembly of a fluorescent hydrogen-bonded capsule based on an amino-acid functionalised tetraphenylethylene, Chem. Commun., 2023, 59(41), 6247–6250 RSC
.
- X. Gan, E. Angelina, F. Gu, K. Zheng and L. Cui, Arginine–Malate-Based Dual-Emission Carbon Dots for Uric Acid Determination in Human Serum with a Miniaturized Device, J. Mater. Sci., 2022, 57(1), 576–588 CrossRef CAS
.
- P. Sahoo, H. S. Sarkar, S. Das, K. Maiti, M. R. Uddin and S. Mandal, Pyrene Appended Thymine Derivative for Selective Turn-on Fluorescence Sensing of Uric Acid in Live Cells, RSC Adv., 2016, 6(71), 66774–66778 RSC
.
- T. Pradhan, S. Maiti, R. Kumar, Y. H. Lee, J. W. Kim, J. H. Lee and J. S. Kim, Rationally Designed Non-Enzymatic Fluorogenic ‘Turn-on’ Probe for Uric Acid, Dyes Pigm., 2015, 121, 1–6 CrossRef CAS
.
- Z. Gao, L. Wang, R. Su, R. Huang, W. Qi and Z. He, A Carbon Dot-Based “off–on” Fluorescent Probe for Highly Selective and Sensitive Detection of Phytic Acid, Biosens. Bioelectron., 2015, 70, 232–238 CrossRef CAS PubMed
.
- N. Dey, Naked-Eye Sensing of Phytic Acid at Sub-Nanomolar Levels in 100% Water Medium by a Charge Transfer Complex Derived from off-the-Shelf Ingredients, Analyst, 2020, 145(14), 4937–4941 RSC
.
- P. Sahoo, S. Das, H. S. Sarkar, K. Maiti, M. R. Uddin and S. Mandal, Selective fluorescence sensing and quantification of uric acid by naphthyridine-based receptor in biological sample, Bioorg. Chem., 2017, 71, 315–324 CrossRef CAS PubMed
.
Footnote |
| † Electronic supplementary information (ESI) available. See DOI: https://doi.org/10.1039/d4tb00331d |
| This journal is © The Royal Society of Chemistry 2024 |

