Solvent-induced luminescence behavior of Ce/Eu@Gd-MOF for ratiometric detection of D2O in H2O†
Xiaoxuan
Fan
a,
Zhiqiang
Guo
a,
Xiaokun
Wen
b,
Wen
Liu
 a,
Baijie
Guan
a,
Feifei
Yin
a,
Xia
Hong
a,
Baijie
Guan
a,
Feifei
Yin
a,
Xia
Hong
 b,
Tianya
Tan
a,
Kexin
Wang
 *a and
Jiwei
Wang
*a
aCollege of Physics, Liaoning University, Shenyang, 110036, China
bKey Laboratory of UV-Emitting Materials and Technology (Northeast Normal University), Ministry of Education, Changchun, 130024, China
First published on 30th November 2023
Abstract
The solvent environment has a significant impact on the luminescence performance of Ln-MOFs, but the related research studies are still limited. In this work, a Ln-MOF using 1,3,5-benzenetricarboxylic acid as ligands and Ce3+/Eu3+ as luminescence centers was prepared. The photoluminescence behaviors of Ce/Eu@Gd-MOFs were studied in H2O and D2O. The emission intensity of the Ce/Eu@Gd-MOFs dispersed in D2O is improved by 711.19% compared to that dispersed in H2O. After excluding the effects of solvent reabsorption and pH, the difference in vibrational frequencies of the functional groups in H2O and D2O is considered to be the main reason for the enhanced luminescence. Deuterated hydroxyl groups have lower vibrational frequencies than hydroxyl groups, resulting in effective weakening of nonradiative transitions. Vibrational coupling occurs between the deuterated hydroxyl groups, H3BTC ligands and Ce3+, because of the proximity of the vibrational frequency of the deuterated hydroxyl groups and the energy level gaps between H3BTC ligands and Ce3+. This facilitates the energy transfer through vibration–vibration interaction in non-radiative processes. The enhancement in luminescence and energy transfer efficiency of Ce/Eu@Gd-MOFs in D2O is attributed to the synergistic effect of the above mechanisms. This solvent-induced luminescence behavior of Ce/Eu@Gd-MOFs holds potential as an approach for detecting D2O in H2O. The detection sensitivity reaches 0.001%. This study contributes to the understanding of the Ln-MOF luminescence and offers insights into its practical applications.
1. Introduction
Lanthanide metal–organic frameworks (Ln-MOFs) have emerged as a fascinating class of framework materials in recent years, attracting considerable attention.1–5 The integration of lanthanide ions and organic ligands confers outstanding optical properties to Ln-MOFs, rendering them with extensive applications in biochemical sensing, nonlinear optics, and white light-emitting diodes.6–8 The solvent environment is one of the most crucial factors affecting the luminescence performance of Ln-MOFs in applications. Ln-MOFs are dispersed in solution accompanied by a framework breathing effect.9 The porous structure of Ln-MOFs leads to direct interactions between solvent molecules and the lanthanide ions. This results in alterations of intermolecular interactions in Ln-MOFs, causing Ln-MOFs to exhibit distinct properties in the solvent environment compared to their solid-state counterparts.10–12 However, there is still a lack of comprehensive knowledge regarding the influence of solvents on the luminescence of Ln-MOFs. The intricate differences including chemical reactivity, dispersibility, hydrogen bonding, pH, and reabsorption among different solvent molecules pose challenges.13 The systematic study for the influence of solvents on the Ln-MOFs luminescence performance is of great significance for customizing luminescence functionalities and advancing their practical applications.D2O is an important isotope of H2O, exhibiting a similar modular structure.14–16 It possesses irreplaceable application value in chemical analysis, nuclear energy production, spectroscopic characterization and bioanalysis.17–19 The similarity in the physical and chemical properties renders D2O and H2O highly suitable candidates for exploring solvent-induced luminescence behavior, minimizing the influence of factors such as solvent viscosity, chemical reactivity, and dispersibility.20–22 From another perspective, the investigation of the luminescence behavior of Ln-MOFs in H2O and D2O also presents an opportunity to provide a rapid and convenient approach for detecting D2O content in H2O.
Herein, we prepared a Ln-MOF using a one-pot solvothermal method, with 1,3,5-benzenetricarboxylic acid (H3BTC) as ligands and Ce3+/Eu3+ as luminescence centers. The doping concentrations of Ce3+ and Eu3+ in MOFs help in optimizing the photoluminescence (PL) performance. The PL properties of Ce/Eu@Gd-MOFs in H2O and D2O were investigated systematically. The impacts of solvent reabsorption, pH value, vibration frequency of solvent molecules and energy gap on luminescence processes, particularly on the energy transfer process, were discussed in detail. The energy transfer efficiencies of Ce3+ and Eu3+ in H2O and D2O were calculated based on the time-resolved spectra. The detection of D2O content in H2O was achieved based on the Ce/Eu@Gd-MOFs showing application potential.
2. Experimental section
2.1 Materials and chemicals
CH3COONa, Ce(NO3)3·6H2O, GdCl3·6H2O, EuCl3·6H2O, 1,3,5-benzenetricarboxylic acid (H3BTC) and N,N-dimethylformamide (DMF) were purchased from Macklin Reagent Co., Ltd. D2O was purchased from Aladdin Reagent Co., Ltd. Deionized water was used in all aqueous solutions. All chemicals were analytical grade reagents and used directly without further purification.2.2 Preparation of MOFs
A series of Ce@Gd-MOFs, Eu@Gd-MOFs, and Ce/Eu@Gd-MOFs were synthesized by a solvothermal method. An example of preparing Ce0.01/Eu0.002@Gd0.987-MOFs: the starting materials Ce(NO3)3·6H2O (0.0043 g), GdCl3·6H2O (0.3608 g), EuCl3·6H2O (0.0008 g) and H3BTC (0.1050 g) were weighed according to the stoichiometric ratio. Then, the ingredients were dissolved in DMF (100 mL). The solution was sonicated for 10 min at room temperature. The component CH3COONa (0.1360 g) was added to the solution and sonication continued for 30 min. The mixed solution was transferred to an autoclave and kept at 120 °C for 24 h. Finally, a white product was obtained, washed by DMF, ethanol and deionized water and dried at 60 °C for 24 h.2.3 Characterization
The morphology of the MOFs was characterized by scanning electron microscopy (SEM, JEOL, JSM-7800F Prime) energy dispersive X-ray (EDX) spectroscopy. The crystal phase of all the phosphor samples was identified by using X-ray powder diffraction (XRD) analysis with a Rigaku D/MAX-RB diffractometer (Tongda TD-3500 automatic X-ray diffractometer system). Fourier transform infrared (FTIR) transmittance spectra of the MOFs were characterized by using a Nicolet IS10 spectrometer under a liquid nitrogen environment. The emission and excitation spectra were measured by using a fluorescence spectrometer (Hitachi, F-7000). Time-resolved fluorescence spectra of the MOFs were recorded by using a transient optical testing system (Quanta Master 400, Photon Technology International).3. Results and discussion
3.1 Phase identification
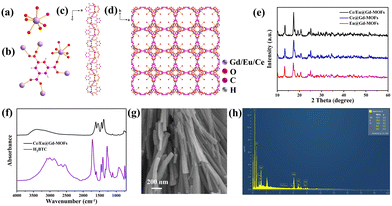
The MOF is composed of lanthanide ions (Gd3+, Ce3+ and Eu3+) and H3BTC ligands by coordination. The unit of the MOF consists of a seven-coordinate Gd3+ cation, a coordinated water molecule, and a H3BTC ligand (Fig. 1a). The metal sites of Gd3+ can be occupied by Ce3+ and Eu3+ due to similar ionic radii and valence states. The coordination environment of the metal ions and H3BTC is shown in Fig. 1b. Fig. 1c reveals that the metal ions are connected through carboxylic bridges to form a one-dimensional helical chain. These chains are further linked with H3BTC ligands to construct a three-dimensional framework structure (Fig. 1d). Fig. 1e displays the XRD patterns of Ce@Gd-MOFs, Eu@Gd-MOFs and Ce/Eu@Gd-MOFs. The XRD patterns are matched well with the diffraction peaks reported in the literature.23–25 This indicates that the doping of rare earth ions has no impact on the formation of the crystal structure of the MOFs. Fig. 1f is the FTIR spectrum of Ce/Eu@Gd-MOFs and H3BTC. The spectrum of precursor H3BTC is provided for comparison. The broad band centered at 3397 cm−1 is owing to the stretching vibration of hydroxyl groups. In the Ce/Eu@Gd-MOFs spectrum, the peaks at 1617 cm−1, 1550 cm−1, 1440 cm−1 and 1375 cm−1 are assigned to the antisymmetric and symmetric stretching mode vibrations of carboxyl groups. They exhibit a shift compared to those in the spectrum of H3BTC. This originated from the coordination between H3BTC ligands and metal ions. The SEM image of Ce/Eu@Gd-MOFs is shown in Fig. 1g. The MOFs exhibit a rod-like morphology. Fig. 1h presents the element distribution of Ce/Eu@Gd-MOFs. The elements of O, C, Ce, Eu and Gd are observed in the EDX analysis. This indicates that Ce3+, Eu3+ and Gd3+ are successfully formed MOFs with H3BTC ligands.3.2 Luminescence properties
Fig. 2a presents the emission spectra of Ce@Gd-MOFs, Eu@Gd-MOFs and Ce/Eu@Gd-MOFs. The MOFs all have a broad emission band in the range of 315–345 nm, assigned to the π–π* transition of the ligands.26 The Ce@Gd-MOFs show blue emission under 260 nm excitation. The broad emission band centered at 425 nm is ascribed to parity-allowed 5d → 4f transitions of Ce3+.27 The emission spectrum of Eu@Gd-MOFs shows peaks at 595 nm, 613 nm, and 690 nm. They arise from 5D0 → 7FJ (J = 1, 2, and 4) transitions of Eu3+.28,29 The co-doped Ce/Eu@Gd-MOFs exhibit both characteristic emissions of Ce3+ and Eu3+. In order to optimize the PL performance, the doping concentration of Eu3+ was regulated.30,31 The emission spectra of Eux@Gd1−x-MOFs (x = 0, 0.002, 0.005, 0.01, and 0.02) and Ce0.01/Eux@Gd0.99−x-MOFs (x = 0.002, 0.005, 0.01, and 0.02) are recorded in Fig. S1 (ESI†). The emission intensity of Ce/Eu@Gd-MOFs increases by 763.33% compared to the MOFs with only Eu3+ doping. The emission spectra of Ce0.01/Eux@Gd0.99−x-MOFs (x = 0, 0.002, 0.005, 0.01, and 0.02) under 260 nm excitation are shown in Fig. 2b. It was clearly found that the emission intensity of Ce3+ decreased with Eu3+ concentration increasing. The Eu3+ optimum doping concentration is x = 0.002. This implies that energy transfer occurs between Eu3+ and Ce3+ in the MOFs. Ce3+ is excited from the ground state 4f to the excited state 5d. One part of the energy of the excited Ce3+ returns to the ground state, while the rest of the excited Ce3+ returns to the excited state (5D0) of Eu3+.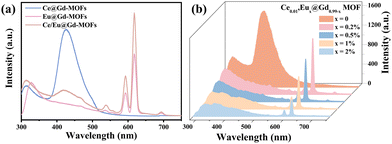 | ||
| Fig. 2 (a) Emission spectra of Ce@Gd-MOFs, Eu@Gd-MOFs and Ce/Eu@Gd-MOFs, and (b) emission spectra of Ce/Eu@Gd-MOFs (λex = 260 nm). | ||
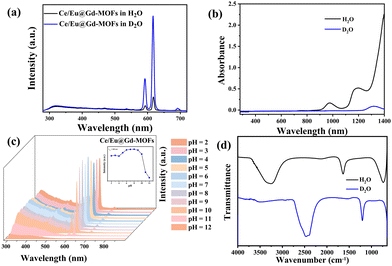
The solvent environment plays a crucial role in the luminescence behavior and energy transfer processes of rare earth ions.13,21,32 The PL properties of Ce/Eu@Gd-MOFs dispersed in H2O and D2O are shown in Fig. 3a. The Eu3+ emission intensity at 617 nm improves by 711.19% when the MOFs are dispersed in D2O compared to that in H2O (Fig. S2, ESI†). The reasons for the solvent-induced luminescence behavior require further investigation. The UV-Vis-NIR absorption spectra of H2O and D2O were characterized to study the effect of solvent molecules on the emission and excitation of Ce/Eu@Gd-MOFs. As shown in Fig. 3b, H2O has two absorption bands centered at 977 nm and 1181 nm, respectively. D2O presents a weak absorption band at 1322 nm. This indicates that H2O and D2O have no effect on the emission (425 nm and 617 nm) and excitation (260 nm) of Ce/Eu@Gd-MOFs. The differences on the pH values of the solvent may cause protonation or deprotonation. The emission spectra of Ce/Eu@Gd-MOFs dispersed in H2O (pH value from 2 to 12) are recorded in Fig. 3c. The emission intensity of Ce/Eu@Gd-MOFs exhibits a trend of initially increasing and then decreasing with pH value from 2 to 12. When the pH value is between 6 and 8, the emission intensity reaches its maximum and remains nearly constant. This indicates that the difference of pH value between H2O (pH = 6.4–7.0) and D2O (pH = 7.5) is not the main factor for the luminescence variation. FTIR spectra of H2O and D2O are shown in Fig. 3d. H2O has characteristic absorption bands positioned at 3325 cm−1, 1637 cm−1, and 736 cm−1. These absorption bands correspond to the stretching vibration, variable angle vibration, and oscillation vibration of hydroxyl groups. The absorption bands of deuterated hydroxyl groups in D2O show a blue shift, demonstrating that the deuterated hydroxyl groups have lower vibrational frequencies. The luminescence behavior and energy transfer processes of Eu3+ and Ce3+ can be affected by the vibrational frequencies of solvent molecules. According to Hook's Law:
| u = m1·m2/(m1 + m2) |
3.3 Effect of solvent on energy transfer in MOFs
Fig. 4 illustrates the energy transfer between H3BTC ligands, Ce3+ and Eu3+ in the PL process of Ce/Eu@Gd-MOFs. The H3BTC ligands absorb photons via the antenna effect and are excited from the singlet state (S1, 36978 cm−1) to the triplet state (T1, 26491 cm−1) through intersystem crossing (ISC) according to the Reinhold empirical rule.1,35–37 The triplet state of H3BTC ligand transfers energy to the 5d excited state of Ce3+ and 5D0 of Eu3+via a non-radiative process.38–42 The energy gap between the T1 of H3BTC ligands, Ce3+ and Eu3+ is 2453 cm−1 and 9685 cm−1, respectively. This means that the sensitization effect of H3BTC ligands on Ce3+ is significantly higher than that on Eu3+. The excited state of Ce3+ further transfers energy to Eu3+, leading to the emission of Eu3+ from 5D0 to 7FJ.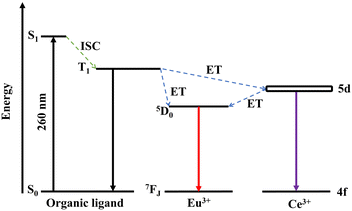 | ||
| Fig. 4 The energy level diagram and possible energy transfer schemes among H3BTC ligands, Ce3+ and Eu3+. | ||
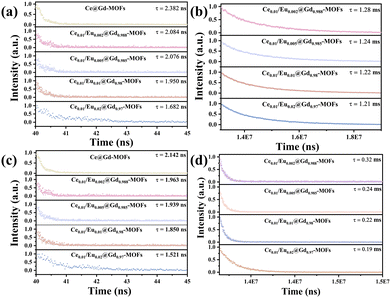
Time-resolved PL decay curves were tested to further study the excited-state radiative relaxation and energy transfer processes of Ce/Eu@Gd-MOFs in H2O and D2O (Fig. 5). All of the decay traces of the Ce/Eu@Gd-MOFs are well fitted with a biexponential function. As the concentration of Eu3+ increases, the decay times for both Ce3+ and Eu3+ ions decrease. This stems from the effective energy transfer from the sensitizer (Ce3+) to the activator (Eu3+), leading to a decrease in the decay times as the concentration of the activator increases (Table 1).26 Both the lifetimes of Ce3+ and Eu3+ are extended when the dispersing solvent of Ce/Eu@Gd-MOFs is changed from H2O to D2O. This arises from the low vibrational frequency of deuterated hydroxyl groups in D2O weakening vibrational relaxation.43 Moreover, the stretching vibration frequency of deuterated hydroxyl groups (2469 cm−1) is close to the energy gap between Ce3+ and the H3BTC ligands (T1-5d, 2453 cm−1). This implies the vibrational coupling occurring between the excited state of the ligands and Ce3+, resulting in increased probability of vibrational relaxation. This vibrational relaxation tends to hinder radiative transition processes, but it is beneficial for vibration–vibration interaction of energy transfers between the H3BTC ligands and Ce3+. The luminescence of Ce/Eu@Gd-MOFs is consequently enhanced.
| Eu3+ concentration (mol) | Ce3+ lifetime (ns) in D2O | Eu3+ lifetime (ms) in D2O | Ce3+ lifetime (ns) in H2O | Eu3+ lifetime (ms) in H2O |
|---|---|---|---|---|
| 0 | 2.382 | 2.142 | ||
| 0.002 | 2.084 | 1.28 | 1.962 | 0.32 |
| 0.005 | 2.076 | 1.24 | 1.939 | 0.24 |
| 0.01 | 1.950 | 1.22 | 1.850 | 0.22 |
| 0.02 | 1.682 | 1.21 | 1.521 | 0.19 |
| Max energy transfer efficiency (η) | 29.32% | 28.97% | ||
The energy transfer efficiencies of Ce3+ and Eu3+ in H2O and D2O were calculated by the following formula:44,45
3.4 D2O detection
The distinctive PL behaviors in H2O and D2O of Ce/Eu@Gd-MOFs can be utilized for detecting D2O in H2O. The emission intensity of the ligands at 316 nm has no significant changes in both H2O and D2O. It can serve as a reference for achieving self-calibration in ratio detection. The emission intensity of Eu3+ at 617 nm rises significantly with the increase in the content of D2O in H2O from 0% to 100% (Fig. 6a). The ratio of the emission intensities at 617 nm (F617 nm) and 316 nm (F316 nm) shows the expected linear relationship with the proportion of D2O in H2O. (Fig. 6b). The limit of detection (LOD) is calculated as 0.001%. This result suggests that the Ce/Eu@Gd-MOFs are capable of serving as a ratiometric luminescence probe for the sensitive detection of D2O in H2O. The selectivity of D2O detection has been evaluated by comparing the emission intensities at 316 nm and 617 nm of the Ce/Eu@Gd-MOFs dispersed in the presence of common species. The interfering species include methanol, ethanol, acetone, Na+, K+, Ca2+, Mg2+ and Zn2+. The results are presented in Fig. S4 (ESI†). They demonstrate that the Ce/Eu@Gd-MOFs have an acceptable selectivity in D2O detection.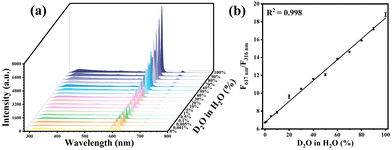 | ||
| Fig. 6 (a) Luminescence spectra of Ce/Eu@Gd-MOFs with D2O content ranging from 0% to 100%. (b) Correlation between D2O content and F617 nm/F316 nm. | ||
4. Conclusions
In summary, Ce/Eu@Gd-MOFs were synthesized using H3BTC as a ligand and Ce3+/Eu3+ as luminescence centers. The differentiated luminescence behaviors of Ce/Eu@Gd-MOFs in H2O and D2O are attributed to the differences in vibrational frequencies between hydroxyl groups and deuterated hydroxyl groups. The PL enhancement of Ce/Eu@Gd-MOFs dispersed in D2O is attributed to the combination of low vibrational frequency and matching with the energy level gaps of deuterated hydroxyl groups. The energy transfer efficiency of Ce3+ and Eu3+ in the MOF increases from 28.97% to 29.32% as the solvent changes from H2O to D2O. The Ce/Eu@Gd-MOFs were used as ratiometric luminescence probes for detecting D2O in H2O. The LOD is calculated as 0.001%. This work is expected to provide guidance for the solvent-involved applications of MOFs in bioimaging, therapies, sensing, solar cells, etc.Conflicts of interest
There are no conflicts to declare.Acknowledgements
This work was supported by the National Natural Science Foundation of China (Grant No. 51972052), the Open Foundation of Key Laboratory for UV-Emitting Materials and Technology of Ministry of Education (Northeast Normal University, No. 135131009), the Doctoral Start-up Foundation and Natural Science Foundation of Liaoning Province (2021-BS-085 and 2021-MS-148), General Project of the Department of Education of Liaoning Province (LJKZ0084), and Shenyang Science and Technology Bureau (22-315-6-06).References
- Y. Zhao and D. Li, J. Mater. Chem. C, 2020, 8, 12739–12754 RSC
.
- X. Wang, Y. Jiang, A. Tissot and C. Serre, Coord. Chem. Rev., 2023, 497, 215454 CrossRef CAS
.
- H. N. Abdelhamid, M. Wilk-Kozubek, A. M. El-Zohry, A. Bermejo Gómez, A. Valiente, B. Martín-Matute, A. V. Mudring and X. Zou, Microporous Mesoporous Mater., 2019, 279, 400–406 CrossRef CAS
.
- W. Gong, Z. Chen, J. Dong, Y. Liu and Y. Cui, Chem. Rev., 2022, 122, 9078–9144 CrossRef CAS PubMed
.
- X. Y. Liu, W. P. Lustig and J. Li, ACS Energy Lett., 2020, 5, 2671–2680 CrossRef CAS
.
- J. Dong, D. Zhao, Y. Lu and W.-Y. Sun, J. Mater. Chem. A, 2019, 7, 22744–22767 RSC
.
- T. N. Nguyen, F. M. Ebrahim and K. C. Stylianou, Coord. Chem. Rev., 2018, 377, 259–306 CrossRef CAS
.
- Y. Tang, H. Wu, W. Cao, Y. Cui and G. Qian, Adv. Opt. Mater., 2020, 9, 2001817 CrossRef
.
- L. Feng, C. Dong, M. Li, L. Li, X. Jiang, R. Gao, R. Wang, L. Zhang, Z. Ning, D. Gao and J. Bi, J. Hazard. Mater., 2020, 388, 121816 CrossRef CAS PubMed
.
- R. Seetharaj, P. V. Vandana, P. Arya and S. Mathew, Arabian J. Chem., 2019, 12, 295–315 CrossRef CAS
.
- D. S. Choi, D. W. Kim, J. H. Lee, Y. S. Chae, D. W. Kang and C. S. Hong, ACS Appl. Mater. Interfaces, 2021, 13, 38358–38364 CrossRef CAS PubMed
.
- S. Song, X. Ma, W. Li, B. Zhang, J. Sun and C. Deng, Colloids Surf., A, 2023, 656, 130350 CrossRef CAS
.
- T. Cong, Y. Ding, S. Xin, X. Hong, H. Zhang and Y. Liu, Langmuir, 2016, 32, 13200–13206 CrossRef CAS PubMed
.
- L. Tcelykh, V. Kozhevnikova Khudoleeva, A. Goloveshkin, L. Lepnev, T. Popelensky and V. Utochnikova, Analyst, 2020, 145, 759–763 RSC
.
- X. Guo, B. Liu, R. Kuang, W. Gan, L. Huang and J. Wang, J. Mater. Chem. C, 2023, 11, 7611–7618 RSC
.
- S. M. Patil, S. K. Gupta, D. Goswami and R. Gupta, ACS Omega, 2023, 8, 32444–32449 CrossRef CAS PubMed
.
- W. Lei, N. W. S. Fong, K. L. Jarvis and D. R. McKenzie, ACS Appl. Mater. Interfaces, 2021, 13, 13666–13675 CrossRef CAS PubMed
.
- X. Liu, L. Shi, L. Shi, M. Wei, Z. Zhao and W. Min, Adv. Sci., 2022, 9, 19658–19662 Search PubMed
.
- C. Liu, H. Su, M. Guo, P. Zhai, L. Liu and H. Fu, Sol. Energy Mater. Sol. Cells, 2022, 245, 111861 CrossRef CAS
.
- X. Wang, N. M. Liu, Y. F. Zhao, F. Yang, Z. J. Zhu and D. Song, Int. J. Med. Sci., 2022, 19, 1357–1363 CrossRef CAS PubMed
.
- X. Liu, W. Liu, Z. Ju, J. Jiang and W. Liu, Inorg. Chem., 2022, 61, 19658–19662 CrossRef CAS PubMed
.
- S. G. Dunning, A. J. Nuñez, M. D. Moore, A. Steiner, V. M. Lynch, J. L. Sessler, B. J. Holliday and S. M. Humphrey, Chem, 2017, 2, 579–589 CAS
.
- M. Hu, Y. Shu, A. Kirillov, W. Liu, L. Yang and W. Dou, ACS Appl. Mater. Interfaces, 2021, 13, 7625–7634 CrossRef CAS PubMed
.
- X. Yang, X. Lin, Y. Zhao, Y. S. Zhao and D. Yan, Angew. Chem., Int. Ed., 2017, 56, 7853–7857 CrossRef CAS PubMed
.
- Y. Cai, X. Li, K. Wu and X. Yang, Anal. Chim. Acta, 2019, 1062, 78–86 CrossRef CAS PubMed
.
- H. Cheng, Q. Sun, S. Wang, Y. Zhang, D. Fan, J. J. Huang and S. Jin, J. Phys. Chem. C, 2019, 123, 30165–30170 CrossRef CAS
.
- V. R. Rao, C. Basavapoornima, S. R. Depuru and C. K. Jayasankar, J. Non-Cryst. Solids, 2020, 549, 120333 CrossRef CAS
.
- X. Zhang, L. Zhou, Q. Pang, J. Shi and M. Gong, J. Phys. Chem. C, 2014, 118, 7591–7598 CrossRef CAS
.
- J. M. Li, R. Li and X. Li, CrystEngComm, 2018, 20, 4962–4972 RSC
.
- P. V. Do, T. Ngoc, N. X. Ca, L. D. Thanh, P. T. T. Nga, T. T. C. Thuy and N. V. Nghia, J. Lumin., 2021, 229, 117660 CrossRef CAS
.
- D. Yue, Y. Huang, L. Zhang, K. Jiang, X. Zhang, Y. Cui, Y. Yu and G. Qian, J. Mater. Chem. C, 2018, 6, 2054–2059 RSC
.
- Z. Guo, X. Fan, X. Wen, W. Liu, B. Guan, X. Hong, K. Wang and J. Wang, Chem. Commun., 2023, 59, 10408 RSC
.
- A. Døssing, Eur. J. Inorg. Chem., 2005, 1425–1434 CrossRef
.
- J. D. Einkauf, J. M. Clark, A. Paulive, G. P. Tanner and D. T. de Lill, Inorg. Chem., 2017, 56, 5544–5552 CrossRef CAS PubMed
.
- X. Yang, H. Zou, X. Sun, T. Sun, C. Guo, Y. Fu, C. M. L. Wu, X. Qiao and F. Wang, Adv. Opt. Mater., 2019, 7, 1900336 CrossRef CAS
.
- A. Kirch, M. Gmelch and S. Reineke, J. Phys. Chem. Lett., 2019, 10, 310–315 CrossRef CAS PubMed
.
- H. Kang, J. Peng, Z. Zhang and W. Zhou, J. Lumin., 2022, 247, 118904 CrossRef CAS
.
- Z. Li, R. Núñez, M. E. Light, E. Ruiz, F. Teixidor, C. Viñas, D. Ruiz-Molina, C. Roscini and J. G. Planas, Chem. Mater., 2022, 34, 4795–4808 CrossRef CAS PubMed
.
- W. Fan, Y. Cheng, M. Feng, P. Liu, L. Wang, Y. Liu, Q.-E. Cao and L. Y. Zheng, ACS Appl. Mater. Interfaces, 2023, 15, 41977–41991 CrossRef CAS PubMed
.
- T. Xia, Z. Shao, X. Yan, M. Liu, L. Yu, Y. Wan, D. Chang, J. Zhang and D. Zhao, Chem. Commun., 2021, 57, 3143–3146 RSC
.
- J. D. Einkauf, T. T. Kelley, B. C. Chan and D. T. de Lill, Inorg. Chem., 2016, 55, 7920–7927 CrossRef CAS PubMed
.
- X. Rao, T. Song, J. Gao, Y. Cui, Y. Yang, C. Wu, B. Chen and G. Qian, J. Am. Chem. Soc., 2013, 135, 15559–15564 CrossRef CAS PubMed
.
- S. Lis, J. Alloys Compd., 2002, 341, 45–50 CrossRef CAS
.
- X. Fan, X. Sun, C. Liu, W. Tian, M. Li, Y. Luo and C. Wu, J. Lumin., 2022, 242, 118594 CrossRef CAS
.
- L. L. da Luz, B. F. Lucena Viana, G. C. O. da Silva, C. C. Gatto, A. M. Fontes, M. Malta, I. T. Weber, M. O. Rodrigues and S. A. Júnior, CrystEngComm, 2014, 16, 6914–6918 RSC
.
Footnote |
| † Electronic supplementary information (ESI) available. See DOI: https://doi.org/10.1039/d3tc04154a |
| This journal is © The Royal Society of Chemistry 2024 |

