 Open Access Article
Highly conductive composite anode catalysts featuring a fused Ir nano-network towards proton exchange membrane electrocatalysis†
Lu Zhanga,
Qiannan Wuab,
Xiao Zhao c,
Xiao Lianga,
Xiaoxin Zou
 a and
Hui Chen
 *a
*a
aState Key Laboratory of Inorganic Synthesis and Preparative Chemistry, College of Chemistry, Jilin University, Changchun 130012, China. E-mail: chenhui@jlu.edu.cn
bHefei conservation of momentum green energy Co., Ltd, Hefei, 231100, China
cSchool of Materials Science and Engineering, Key Laboratory of Automobile Materials of MOE, State Key Laboratory of Automotive Simulation and Control, Electron Microscopy Center, Jilin University, Changchun 130012, China
First published on 30th January 2025
Abstract
A boride-assisted method has been presented to synthesize a fused Ir nano-network supported on TiO2 as highly conductive composite catalysts (Ir NN@TiO2) for the reaction of oxygen evolution in acid. The Ir NN@TiO2 can be utilized to construct an anode catalyst layer of a proton exchange membrane water electrolyzer (PEMWE) with a low iridium content of 0.3 mgIr cm−2. The low-iridium-loading PEMWE exhibits excellent performance, i.e., 2.9 A cm−2@1.9 V with Nafion 115 membrane, and operates stably at a current density of 1.0 A cm−2 for over 1000 h.
The proton exchange membrane water electrolyzer (PEMWE), which can effectively adapt to the electric instantaneous fluctuations from intermittent renewable energy sources, is emerging as a hot technology for producing green hydrogen.1–3 The catalyst-coated membrane (CCM), which is the central component of a PEMWE, is made up of an anode catalyst layer, cathode catalyst layer, and solid electrolyte (such as a perfluorosulfonic membrane).4–6 Due to the high acidity of the perfluorosulfonic membrane, noble metal-based electrocatalysts, such as platinum (Pt) and iridium (Ir) are necessary to catalyze the hydrogen evolution reaction (HER) at the cathode and the oxygen evolution reaction (OER) at the anode. At the cathode, the dispersion of Pt nanoparticles on carbonous supports (i.e., Pt/C catalysts) has led to the reduction of Pt loadings down to 0.5 mgPt cm2 in a PEMWE cell.7 However, carbon black materials are unsuitable supports for Ir nanocatalysts at the anode, as carbon can be electrochemically oxidized at highly oxidizing potentials, leading to catalyst degradation. Consequently, the high packing density of unsupported Ir or IrO2 nanocatalysts results in a current Ir loading in commercial electrolyzers of 2–4 mgIr cm−2, which is required to generate a consistent and continuous catalyst layer.3
In order to reduce the Ir loading amount, researchers have been exploring acid-stable metal oxides, such as TiO2, SnO2 and Nb2O5, as potential support candidates to support Ir-based nanocatalysts.8,9 Some well-designed catalysts possess strong interface interaction between the oxide supports and surface iridium species to improve the intrinsic activity for the acidic OER. In three-electrode liquid-electrolyte measurements, they present better OER activity than IrO2, while they contain 30–50% less Ir content relative to IrO2.10 Despite recent efforts, few reports demonstrate the practical application of those oxide-supported catalysts in real PEMWEs via integrating them into CCMs. Furthermore, while several oxide-supported catalysts have been utilized to prepare the anode catalyst layer in PEMWE, they typically run for less than 200 hours at not exceeding 1 A cm−2, or require high Ir loadings of over 2 mgIr cm−2 to achieve better CCM performance than IrO2.8,11 A serious drawback of these oxide supports is their inadequate electrical conductivity to deliver ampere-level current density in PEMWEs.12,13 In fact, the ideal anode catalysts in PEMWEs should have high electrical conductivity of >0.1 S cm−1. Therefore, the ability to enhance the conductivity of oxide-supported catalysts is of vital importance in our pursuit to develop low Ir CCMs with high activity and durability.
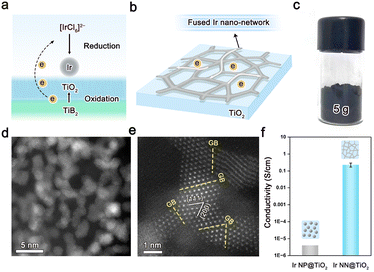
Herein, we propose a boride-assisted method to synthesize a highly conductive Ir nanocatalyst supported on TiO2 (Fig. 1a), where Ir nanoparticles have fused at the junctions to create an interconnected Ir nano-network (Fig. 1b and Fig. S1–S2 in ESI,† denoted hereafter as Ir NN@TiO2). The Ir NN@TiO2 was synthesized using a wet chemical approach, which involved the chemical reaction of TiB2 (Fig. S3, ESI†) with H2IrCl6 in ethyl alcohol-H2O mixed solution (details are provided in the Experimental section, ESI†). During the reaction, the TiB2 was oxidized into a TiO2 support, while IrCl62− was reduced to elemental Ir. It is worth emphasizing that when TiO2 was used to replace TiB2 in the synthesis, highly dispersed Ir nanoparticles on TiO2 supports were formed (denoted Ir NP@TiO2, Fig. S4, ESI†). This comparison indicates that TiB2 is unique in its ability to assist the formation of a fused Ir nano-network on TiO2 supports reported here. This method makes it simple to scale up the Ir NN@TiO2 generated to more than 5 g each batch (Fig. 1c).
As shown in the transmission electron microscopy (TEM) image (Fig. 1d) and N2 adsorption–desorption isotherms (Fig. S5, ESI†), Ir NN@TiO2 is composed of spatially interconnected nanoparticles with a particle size of ca. 1.2 nm, and has a large BET surface area of 43 m2 g−1. The high-resolution TEM result confirms that the Ir nanoparticles as building blocks are connected via grain boundaries (GBs) to form a fused Ir nano-network on TiO2 supports (Fig. 1e). The interplanar spacings of Ir NN@TiO2, which are ca. 0.22 nm and 0.19 nm, are attributed to the (111) and (200) crystallographic planes of face-centered-cubic (fcc) phase Ir. Element distribution analysis shows that Ir is highly dispersed on TiO2 (Fig. S6, ESI†). The Ir loadings of both Ir NN@TiO2 and Ir NP@TiO2 are around 30 wt%, which are checked by the inductively coupled plasma atomic emission spectroscopy (ICP-OES). The Ir NN@TiO2 presents a high electrical conductivity with over 0.2 S cm−1 (Fig. 1f), which is 5 orders of magnitude higher compared with Ir NP@TiO2. The result indicates that the fused Ir nano-network on TiO2 supports largely enhance the electrical conductivity of the catalysts.
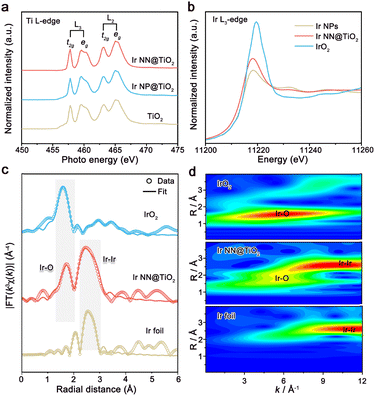
The powder X-ray diffraction (XRD) patterns of Ir NN@TiO2 and Ir NP@TiO2 are shown in Fig. S7 (ESI†). Both Ir NN@TiO2 and Ir NP@TiO2 samples show the diffraction peaks of the TiO2 support, and the broadened diffraction peaks of Ir at 40–45°, implying the very small size of Ir on TiO2. We further measure Ti L-edge X-ray absorption near-edge structure (XANES) spectra of Ir NN@TiO2, Ir NP@TiO2 and TiO2 (Fig. 2a). Both these spectra feature L2 and L3 doublets, which arise from the electron excitation in Ti, specifically from Ti 2p1/2 and Ti 2p3/2 to unoccupied 3d orbitals, respectively. The L2 and L3 edges are further divided into eg and t2g peaks as a result of crystal field splitting in an octahedral symmetry.14 The relative intensity and peak position of Ir NN@TiO2 and Ir NP@TiO2 in the L2 and L3 band are almost the same as those of TiO2. These results indicate that the TiO2 supports for Ir NN@TiO2 and Ir NP@TiO2 exhibit no essential differences, and the much higher electrical conductivity of Ir NN@TiO2 is originated from the fused Ir nano-network.
The electronic structure and local coordination environment of the Ir were investigated by X-ray absorption spectroscopy. The maximum of the absorption peak of Ir NN@TiO2 is shifted to a higher energy value compared to metallic Ir from the Ir L3-edge XANES spectra (Fig. 2b), indicating the formation of iridium oxide layer on the Ir NN@TiO2 surface. In the Fourier transforms of the extended X-ray absorption fine structure (EXAFS) at the Ir L3-edge (Fig. 2c and Table S1, ESI†), there are two prominent peaks for Ir NN@TiO2, which correspond to the Ir–Ir bond and the Ir–O bond. The wavelet transform analysis (Fig. 2d) also exhibits the atomic distances for both Ir–Ir and Ir–O. In addition, the surface oxidation of Ir for Ir NN@TiO2 is further supported by X-ray photoelectron spectroscopy (XPS, Fig. S8 in ESI†), which shows a mixed oxidation state of Ir0 and Ir4+ for Ir NN@TiO2.
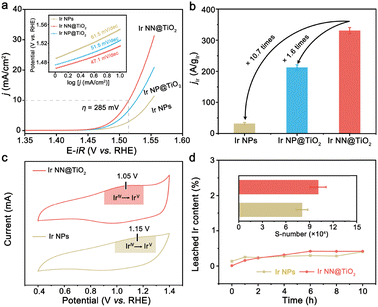
The electrocatalytic activity of Ir NN@TiO2 for the OER was then assessed with a standard three-electrode cell in acidic solution (0.1 M HClO4, see Experimental section in ESI†). For comparison, the same test conditions were used to evaluate the electrocatalytic activities of Ir NP@TiO2 and unsupported Ir NPs (see Experimental section in ESI† for synthetic details). The polarization curves of the Ir NN@TiO2, Ir NP@TiO2 and Ir NPs are shown in Fig. 3a. The Ir NN@TiO2 requires a lower overpotential (285 mV) than Ir NP@TiO2 (297 mV) and Ir NPs (321 mV) in order to reach a 10 mA cm−2 current density. Hence, Ir NN@TiO2 is a better electrocatalyst than Ir NP@TiO2 and Ir NPs for the OER. The better activity of Ir NP@TiO2 is consistent with its smaller Tafel slope (Fig. 3a, inset). The former gives a lower value of 47.1 mV dec−1 than those measured by Ir NP@TiO2 (51.5 mV dec−1) and Ir NPs (61.5 mV dec−1). At 1.55 V versus reversible hydrogen electrode (RHE), Ir NN@TiO2 presents an Ir mass activity of 331 A gIr−1 (Fig. 3b), which is about 1.6 and 10.7 times more than that of the Ir NP@TiO2 (212 A gIr−1) and Ir NPs (31 A gIr−1).
To further compare the specific activities of Ir NN@TiO2 and Ir NPs, the electrochemical surface areas (ECSAs), which are calculated from the electrochemical double-layer capacitance value,15 were used to normalize the measured currents (Fig. S9 in ESI†). The specific activity (jECSA) of Ir NN@TiO2 is approximately 8.9 times higher than that of Ir NPs at 1.55 V, suggesting the higher intrinsic activity of Ir NN@TiO2. We investigate cyclic voltammetry (CV) curves of Ir NN@TiO2 and Ir NPs in a potential range from 0.4 to 1.4 V vs. RHE, prior to OER potential (Fig. 3c). The redox peak between 1.1 V and 1.2 V vs. RHE is identified to the IrIV/IrV redox peaks.16 Compared with Ir NPs, the IrIV/IrV redox peak of Ir NN@TiO2 shifts to a lower potential, allowing Ir NN@TiO2 to catalyze the OER more efficiently. The low redox peak potential and high intrinsic activity of Ir NN@TiO2 can be attributed to the high coverage of surface hydroxyl groups, as supported by Fourier transform infrared spectroscopy (Fig. S10, ESI†). Ir NN@TiO2 demonstrates remarkable stability at a 10 mA cm−2 current density, maintaining catalytic performance for over 200 h without significant fluctuation (Fig. S11, ESI†). Ir NN@TiO2 delivers nearly 100% faradaic efficiency (Fig. S12, ESI†), indicating that the current measured is exclusively used for the OER.
To study structural stability, ICP–OES experiments were performed to monitor the quantity of Ir ion dissolution in the electrolyte during the OER. The amount of dissolved Ir ions for Ir NN@TiO2 is close to that for Ir NPs during 10 h electrocatalysis for the OER (Fig. 3d). Subsequently, we calculate the stability number to study structural stability,16 which represents the number of O2 molecules generated per iridium atom dissolution (Fig. 3d, inset). The Ir NN@TiO2 presents a higher S-number (1.0 × 10⁵) than the Ir NPs (8.8 × 10⁴). Moreover, there is negligible Ti leaching (0.03 wt%) from Ir NN@TiO2 during the OER. We further characterized Ir NN@TiO2 after the OER. The SEM and TEM images show that Ir NN@TiO2 retains the original morphology after the OER (Fig. S13, ESI†). We compare the L3-edge EXAFS spectra (Fig. S14, ESI†) and XRD patterns (Fig. S15, ESI†) for Ir NN@TiO2 before and after the OER. There is an obvious electrochemical oxidation of Ir during the acidic OER.
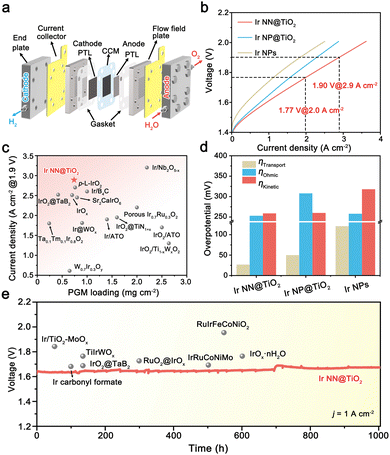
We used an Ir NN@TiO2 catalyst as the anode catalyst, 40% Pt/C as the cathode catalyst, and Nafion 115 membrane as the PEM (thickness = 125 μm) to assemble a single cell PEMWE with a 5 cm2 working area (Fig. 4a). The CCM is prepared by an ultrasonic spraying method. ICP-OES indicates that the Ir and Pt loadings are regulated to 0.30 mgIr cm−2 and 0.44 mgPt cm−2. According to the SEM image of CCM, both Ir NN@TiO2 and Pt/C on the PEM surface generate evenly distributed agglomerates with a thickness of around 2 μm for the anode and 10 μm for the cathode catalyst layers (Fig. S16, ESI†). For comparison, the PEMWEs using Ir NP@TiO2 and Ir NP anodes are assembled under the same conditions.
As shown in Fig. 4b, the polarization curve of PEMWE using Ir NN@TiO2 delivers 2.9 and 3.6 A cm−2 current densities at cell voltages of 1.9 and 2.0 V at 80 °C. The performance is significantly superior to those PEMWEs using the Ir NP@TiO2 anode (2.3 A cm−2@1.9 V) and Ir NPs anode (1.8 A cm−2@1.9 V). Notably, the Ir NN@TiO2-based cell's performance surpasses the majority of previously reported PEMWEs that use efficient Ir-based anode electrocatalysts (Fig. 4c and Table S2, ESI†), including supported catalysts (e.g., Ir@WOx, IrO2@TaB2 and IrO2@TiN1+x) and solid solution catalysts (e.g., Ta0.1Tm0.1Ir0.8O2, W0.7Ir0.3Oy and Ir0.7Ru0.3O2).17–22
To explore the reasons behind the excellent performance of the Ir NN@TiO2-based cell, we examine the contributions of three main causes of total voltage losses in a PEMWE: ohmic overvoltage, transport overvoltage, and kinetic overvoltage (Fig. S17–S19, ESI†).23 For comparison, we also calculate the voltage loss components for cells based on Ir NP@TiO2 and Ir NPs (Fig. S20, ESI†). As shown in Fig. 4d, the kinetic overvoltage for the Ir NN@TiO2-based cell is lower than that of Ir NP-based cells, attributed to the higher activity of the Ir NN@TiO2 catalyst. The ohmic overvoltage of the Ir NN@TiO2-based cell is significantly reduced compared to the Ir NP@TiO2-based cell, thanks to its superior electrical conductivity. In addition, the transport overpotential of the Ir NN@TiO2 anode cell is much smaller than that of the Ir NP anode cell, indicating favorable transport of O2 and water within the CCM. Taken together, these results highlight that both the optimal reaction kinetics, high electrical conductivity and efficient mass transport are essential for achieving high-performance PEMWE for Ir NN@TiO2.
The stability of CCM is a crucial factor for the practical use of PEMWE. To assess the long-term catalytic stability, we conducted a chronopotentiometry measurement for the Ir NN@TiO2-based cell at a steady 1 A cm−2 current density (Fig. 4e). The electrocatalytic durability of PEMWEs using recently developed Ir-based anode catalysts is generally under 500 h (Table S3, ESI†). By comparison, the Ir NN@TiO2-based cell exhibits nearly unchanged electrocatalytic performance over 1000 hours, with an average degradation rate of 30.8 μV h−1, indicating its remarkable catalytic stability.
In conclusion, Ir NN@TiO2 possesses not only high intrinsic activity and high structural stability for the acidic OER but also high electrical conductivity. The PEMWE using the Ir NN@TiO2 anode delivers 2.9 A cm−2 current density at a cell voltage of 1.9 V with a low Ir content of 0.3 mgIr cm−2, while giving excellent activity retention at 1 A cm−2 for over 1000 hours. This performance represents one of the highest levels reported for PEMWEs.
This work was supported by the State Grid Headquarter Science and Technology project (5419-202158490A-0-5-ZN).
Data availability
The data supporting this article have been included as part of the ESI.†Conflicts of interest
There are no conflicts to declare.Notes and references
- M. Chatenet, B. G. Pollet, D. R. Dekel, F. Dionigi, J. Deseure, P. Millet, R. D. Braatz, M. Z. Bazant, M. Eikerling, I. Staffell, P. Balcombe, Y. Shao-Horn and H. Schäfer, Chem. Soc. Rev., 2022, 51, 4583–4762 RSC.
- Y. Wang, Y. Pang, H. Xu, A. Martinez and K. S. Chen, Energy Environ. Sci., 2022, 15, 2288–2328 RSC.
- Q. Wu, Y. Wang, K. Zhang, Z. Xie, K. Sun, W. An, X. Liang and X. Zou, Mater. Chem. Front., 2023, 7, 1025–1045 RSC.
- Q. Liu, K. Liu, J. Huang, C. Hui, X. Li and L. Feng, Dalton Trans., 2024, 53, 3959–3969 RSC.
- R.-T. Liu, Z.-L. Xu, F.-M. Li, F.-Y. Chen, J.-Y. Yu, Y. Yan, Y. Chen and B. Y. Xia, Chem. Soc. Rev., 2023, 52, 5652–5683 RSC.
- K. Zhang, X. Liang, L. Wang, K. Sun, Y. Wang, Z. Xie, Q. Wu, X. Bai, M. S. Hamdy, H. Chen and X. Zou, Nano Res. Energy, 2022, 1, 9120032 CrossRef.
- R. J. Ouimet, J. R. Glenn, D. De Porcellinis, A. R. Motz, M. Carmo and K. E. Ayers, ACS Catal., 2022, 12, 6159–6171 CrossRef CAS.
- Z. Shi, J. Li, J. Jiang, Y. Wang, X. Wang, Y. Li, L. Yang, Y. Chu, J. Bai, J. Yang, J. Ni, Y. Wang, L. Zhang, Z. Jiang, C. Liu, J. Ge and W. Xing, Angew. Chem., Int. Ed., 2022, 61, e202212341 CrossRef CAS PubMed.
- H. Yu, Y. Ji, C. Li, W. Zhu, Y. Wang, Z. Hu, J. Zhou, C.-W. Pao, W.-H. Huang, Y. Li, X. Huang and Q. Shao, J. Am. Chem. Soc., 2024, 146, 20251–20262 CrossRef CAS PubMed.
- Y. N. Regmi, E. Tzanetopoulos, G. Zeng, X. Peng, D. I. Kushner, T. A. Kistler, L. A. King and N. Danilovic, ACS Catal., 2020, 10, 13125–13135 CrossRef CAS.
- J. Islam, S.-K. Kim, P. T. Thien, M.-J. Kim, H.-S. Cho, W.-C. Cho, C.-H. Kim, C. Lee and J. H. Lee, J. Power Sources, 2021, 512, 230506 CrossRef CAS.
- C. Baik, J. Cho, J. I. Cha, Y. Cho, S. S. Jang and C. Pak, J. Power Sources, 2023, 575, 233174 CrossRef CAS.
- H. W. Park, B. G. Seo, J. W. Shim, N. Il Kim, Y. S. Choi and J. H. Shim, Appl. Catal., B, 2023, 337, 122956 CrossRef CAS.
- L. Pan, M. Ai, C. Huang, L. Yin, X. Liu, R. Zhang, S. Wang, Z. Jiang, X. Zhang, J.-J. Zou and W. Mi, Nat. Commun., 2020, 11, 418 CrossRef CAS PubMed.
- S. Trasatti and O. A. Petrii, Pure Appl. Chem., 1991, 63, 711–734 CrossRef CAS.
- S. Geiger, O. Kasian, M. Ledendecker, E. Pizzutilo, A. M. Mingers, W. T. Fu, O. Diaz-Morales, Z. Li, T. Oellers, L. Fruchter, A. Ludwig, K. J. J. Mayrhofer, M. T. M. Koper and S. Cherevko, Nat. Catal., 2018, 1, 508–515 CrossRef CAS.
- M. Faustini, M. Giraud, D. Jones, J. Rozière, M. Dupont, T. R. Porter, S. Nowak, M. Bahri, O. Ersen, C. Sanchez, C. Boissière, C. Tard and J. Peron, Adv. Energy Mater., 2019, 9, 1802136 CrossRef.
- S. Hao, H. Sheng, M. Liu, J. Huang, G. Zheng, F. Zhang, X. Liu, Z. Su, J. Hu, Y. Qian, L. Zhou, Y. He, B. Song, L. Lei, X. Zhang and S. Jin, Nat. Nanotechnol., 2021, 16, 1371–1377 CrossRef CAS PubMed.
- G. Jiang, H. Yu, Y. Li, D. Yao, J. Chi, S. Sun and Z. Shao, ACS Appl. Mater. Interfaces, 2021, 13, 15073–15082 CrossRef CAS PubMed.
- S. Wang, H. Lv, S. Bi, T. Li, Y. Sun, W. Ji, C. Feng and C. Zhang, Mater. Chem. Front., 2021, 5, 8047–8055 RSC.
- Y. Wang, M. Zhang, Z. Kang, L. Shi, Y. Shen, B. Tian, Y. Zou, H. Chen and X. Zou, Nat. Commun., 2023, 14, 5119 CrossRef CAS PubMed.
- T. Yan, S. Chen, W. Sun, Y. Liu, L. Pan, C. Shi, X. Zhang, Z.-F. Huang and J.-J. Zou, ACS Appl. Mater. Interfaces, 2023, 15, 6912–6922 CrossRef CAS PubMed.
- Z. Kang, M. Wang, Y. Yang, H. Wang, Y. Liu, J. Mo, J. Li, P. Deng, C. Jia and X. Tian, Int. J. Hydrogen Energy, 2022, 47, 5807–5816 CrossRef CAS.
Footnote |
| † Electronic supplementary information (ESI) available. See DOI: https://doi.org/10.1039/d4cc06170e |
| This journal is © The Royal Society of Chemistry 2025 |


