 Open Access Article
Coordination polymers constructed from bis-pyridyl-bis-amides and 1,4,5,8-naphthalenetetracarboxylic acid: ligand transformation and metal ion sensing†
Wei-Hao
Chen
a,
Yen-Hsin
Chen
a,
Kedar Bahadur
Thapa
b,
Shih-Miao
Liu
*c and
Jhy-Der
Chen
 *a
*a
aDepartment of Chemistry, Chung Yuan Christian University, Chung-Li, Taiwan, R.O.C.. E-mail: jdchen@cycu.edu.tw
bMakawanpur Multiple Campus, affiliated to Tribhuvan University, Municipality Rd, Hetauda, Nepal
cCenter for General Education, Hsin Sheng Junior College of Medical Care and Management, Longtan, Taiwan, R.O.C.. E-mail: lsm0301@hsc.edu.tw
First published on 27th December 2024
Abstract
Hydrothermal reactions of 1,4,5,8-naphthalenetetracarboxylic acid (1,4,5,8-H4NTC) with various bis-pyridyl-bis-amides, N,N′-di(pyridin-3-yl)adipamide (L1), N,N′-di(pyridin-3-yl)succinamide (L2), N,N′-di(pyridin-3-yl)oxalamide (L3) or N,N′-bis(pyridin-3-ylmethyl)oxalamide (L4) and transition metal salt afforded seven coordination polymers (CPs) and one dinuclear complex, including [Cd(L1)0.5(1,4,5,8-NTC′)(H2O)2]n (1,4,5,8-H2NTC′ = 1,4,5,8-naphthalenetetracarboxylic acid 1,8-monoanhydride), 1, {[Zn(L2)0.5(1,4,5,8-NTC′)(H2O)2]·H2O}n, 2, {[Cd(L2)0.5(1,4,5,8-NTC′)(H2O)2]·H2O}n, 3, {[Zn(L5)(1,4,5,8-NTC′)(H2O)]·0.5OA}n, {L5 = 2,7-di(pyridin-3-yl)benzo[lmn][3,8]phenanthroline-1,3,6,8(2H,7H)-tetraone}, 4, [Cd(L5)(1,4,5,8-NTC′)(H2O)]n, 5a, {[Cd(L5)(1,4,5,8-NTC′)(H2O)]·2H2O}n, 5b, [Zn2(L4)(1,4,5,8-NTC′)2(H2O)6], 6, and {[Cd(L4)(1,4,5,8-NTC)0.5(H2O)]·0.5H2O}n (1,4,5,8-H4NTC = 1,4,5,8-naphthalenetetracarboxylic acid), 7. These CPs and the dinuclear complex were structurally characterized by using X-ray single-crystal diffraction. CPs 1, 2, and 3 exhibit one-dimensional (1D) structures with the 2,3C2 topology and 4 and 5 display two-dimensional (2D) structures with the 2,4L1 topology, whereas 6 is a dinuclear complex and 7 shows a three-dimensional (3D) framework with the mog topology. Ligand transformations from 1,4,5,8-H4NTC to 1,4,5,8-NTC′2− and L3 to L5 are observed. The evaluation of the metal ion sensing properties of 1, 2, 3, 6, and 7 shows that 7 has the highest potential for detecting Fe3+ ions in aqueous solution with 1.06 × 10³ M−1 and 1.99 × 10⁻⁴ M for the Stern–Volmer constant (KSV) and the limit of detection (LOD), respectively.
Introduction
Coordination polymers (CPs) have been widely researched by scientists in recent years due to their intriguing structural diversity and various applicable functions.1,2 By careful evaluation of the factors that govern the structural diversity of CPs, including metal types, the softness, length, coordination ability and coordination direction of organic ligands, and reaction conditions such as solvent, temperature and reaction time, CPs with different characteristics can be designed.3,4 Through metal–ligand bonds, CPs form infinitely extending one- (1D), two- (2D) or three-dimensional (3D) structures.5–8 CPs are applicable in various fields such as gas storage and separation, sensors, magnetism, conductive material, catalysis, degradation of dyes or pollutants, drug delivery, etc.9–19Di-, tri- and tetracarboxylate ligands have been used frequently to prepare CPs with interesting structural topologies. The bis-pyridyl-bis-amide (bpba)-based CPs constructed from 1,2,4,5-benzenetetracarboxylic acid (1,2,4,5-H4BETC) have been extensively investigated.8,20–22 Structural comparisons of the Co(II),20,21 Zn(II)22 and Cu(II)8 CPs thus prepared indicate that their structural diversity is manipulated by the flexibility of the bpba ligands, which is also subject to the coordination and co-crystallization of the solvent molecules. The structural diversity of these CPs demonstrates that the combination of the flexible bpba and 1,2,4,5-H4BETC under suitable conditions may form diverse and interesting structures.
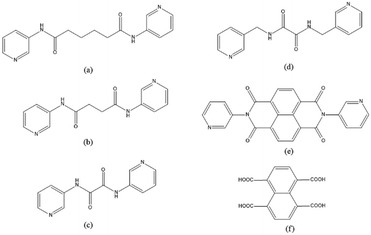
To further investigate the role of the tetracarboxylate ligand in determining the structural diversity of bpba-based CPs, 1,4,5,8-naphthalenetetracarboxylic acid (1,4,5,8-H4NTC) was invoked to react with the bpba ligand, N,N′-di(pyridin-3-yl)adipamide (L1), N,N′-di(pyridin-3-yl)succinamide (L2), N,N′-di(pyridin-3-yl)oxalamide (L3) or N,N′-bis(pyridin-3-ylmethyl)oxalamide (L4), and Zn(II) or Cd(II) salt to synthesize new CPs. Fig. 1 shows the structures of the bpba ligands and 1,4,5,8-H4NTC used in this investigation. Herein, the syntheses and structures of [Cd(L1)0.5(1,4,5,8-NTC′)(H2O)2]n (1,4,5,8-H2NTC′ = 1,4,5,8-naphthalenetetracarboxylic acid 1,8-monoanhydride), 1, {[Zn(L2)0.5(1,4,5,8-NTC′)(H2O)2]·H2O}n, 2, {[Cd(L2)0.5(1,4,5,8-NTC′)(H2O)2]·H2O}n, 3, {[Zn(L5)(1,4,5,8-NTC′)(H2O)]·0.5OA}n, (L5 = 2,7-di(pyridin-3-yl)benzo[lmn][3,8]phenanthroline-1,3,6,8(2H,7H)-tetraone), 4, [Cd(L5)(1,4,5,8-NTC′)(H2O)]n, 5a, {[Cd(L5)(1,4,5,8-NTC′)(H2O)]·2H2O}n, 5b, [Zn2(L4)(1,4,5,8-NTC′)2(H2O)6], 6, and {[Cd(L4)(1,4,5,8-NTC)0.5(H2O)]·0.5H2O}n, 7, form the subject of this report. The structural diversity and ligand transformation of these CPs and the complex are discussed and their metal ion sensing capabilities evaluated.
Experimental details
General procedures
IR spectra (KBr disk) were obtained with a Thermo Nicolet IS5 FT-IR spectrometer. Elemental analyses were performed on an Elementar Vario EL III or an Elementar Vario EL cube type analyzer. Thermal gravimetric analyses (TGA) measurements were carried out on a SII Nano Technology Inc. TG/DTA 6200 over the temperature range of 30 to 900 °C at a heating rate of 10 °C min−1 under N2. Powder X-ray diffraction measurements were performed on a Bruker D2 PHASER diffractometer with CuKα (λα = 1.54 Å) radiation. X-ray photoelectron spectroscopy (XPS) was on performed on a ULVAC-PHI (Quantes) spectrometer. Emission spectra were collected by using a Hitachi F-7000 spectrometer and the setting of PMT voltage was 250 V. Gas sorption measurements were conducted on a Micromeritics ASAP 2020 system.Materials
The reagent Cd(OAc)2·2H2O and Zn(OAc)2·2H2O was purchased from Fisher Scientific Co. and 1,4,5,8-naphthalenetetracarboxylic acid was purchased from Nova Materials Co., Ltd. The ligands L1, L2, L3, L4, and L5 was prepared according to published procedures.12,23X-ray crystallography
The diffraction data for the CPs and dinuclear complex were collected on a Bruker AXS SMART APEX II CCD diffractometer, which was equipped with a graphite-monochromated Mo Kα (λα = 0.71073 Å) radiation. Data reduction was carried out by standard methods with use of well-established computational procedures.24 The structure factors were obtained after Lorentz and polarization corrections. An empirical absorption correction based on “multi-scan” was applied to the data. The position of some of the heavier atoms were located by the direct or Patterson method. The remaining atoms were found in a series of alternating difference Fourier maps and least-square refinements, while the hydrogen atoms except those of the water molecules were added by using the HADD command in SHELXTL 6.1012.25 The solvent molecules of 5a were seriously disordered and were squeezed.26 The calculated structure factors of 5a were thus reported without solvent contribution. Table 1 lists the crystal data for 1–7.| CP/complex | 1 | 2 | 3 | 4 | 5a | 5b | 6 | 7 |
|---|---|---|---|---|---|---|---|---|
| a R 1 = ∑||Fo| − |Fc||/∑|Fo|. b wR2 = [∑w(Fo2 − Fc2)2/∑w(Fo2)2]1/2. w = 1/[σ2(Fo2) + (ap)2 + (bp)], p = [max(Fo2 or 0) + 2(Fc2)]/3. a = 0.0482, b = 0.4052 for 1; a = 0.0229, b = 0.5143 for 2; a = 0.0749, b = 2.0348 for 3; a = 0.1042, b = 8.3159 for 4; a = 0.0596, b = 2.4584 for 5a; a = 0.0666, b = 0.0000 for 5b; a = 0.0426, b = 0.1291 for 6; a = 0.0210, b = 0.0000 for 7. c Quality-of-fit = [∑w(|Fo2| − |Fc2|)2/(Nobserved − Nparameters)]1/2. | ||||||||
| Formula | C22H17CdN2O10 | C21H17ZnN2O11 | C21H17CdN2O11 | C39H19ZnN4O14 | C38H18CdN4O12 | C38H22CdN4O14 | C42H34Zn2N4O22 | C21H19CdN4O7.5 |
| Formula weight | 581.77 | 538.73 | 585.77 | 832.95 | 834.96 | 870.99 | 1077.47 | 559.80 |
| Temperature, K | 296(2) | 296(2) | 296(2) | 293(2) | 296(2) | 293(2) | 296(2) | 299(2) |
| Crystal system | Triclinic | Triclinic | Triclinic | Triclinic | Triclinic | Triclinic | Triclinic | Triclinic |
| Space group |
P![[1 with combining macron]](https://www.rsc.org/images/entities/char_0031_0304.gif) |
P![[1 with combining macron]](https://www.rsc.org/images/entities/char_0031_0304.gif) |
P![[1 with combining macron]](https://www.rsc.org/images/entities/char_0031_0304.gif) |
P![[1 with combining macron]](https://www.rsc.org/images/entities/char_0031_0304.gif) |
P![[1 with combining macron]](https://www.rsc.org/images/entities/char_0031_0304.gif) |
P![[1 with combining macron]](https://www.rsc.org/images/entities/char_0031_0304.gif) |
P![[1 with combining macron]](https://www.rsc.org/images/entities/char_0031_0304.gif) |
P![[1 with combining macron]](https://www.rsc.org/images/entities/char_0031_0304.gif) |
| a, Å | 7.5267(6) | 8.103(4) | 8.328(3) | 10.256(3) | 10.4465(6) | 10.24(3) | 6.546(4) | 10.1088(13) |
| b, Å | 11.4086(9) | 10.232(5) | 10.399(3) | 12.694(4) | 12.6964(7) | 12.29(4) | 12.633(7) | 10.4401(13) |
| c, Å | 13.3971(10) | 12.720(6) | 12.543(4) | 13.590(5) | 13.5740(8) | 13.58(5) | 12.865(7) | 11.9209(14) |
| α, ° | 114.8797(16) | 97.593(12) | 95.415(6) | 97.295(9) | 97.2892(13) | 97.39(9) | 97.026(19) | 106.047(3) |
| β, ° | 91.182(2) | 99.913(11) | 97.524(6) | 99.972(10) | 99.3233(13) | 99.45(13) | 95.24(2) | 94.160(3) |
| γ, ° | 94.865(2) | 91.322(13) | 92.705(9) | 105.313(8) | 105.7654(13) | 104.61(11) | 96.96(2) | 112.725(3) |
| V, Å3 | 1037.85(14) | 1028.7(8) | 1070.1(6) | 1652.6(9) | 1681.83(17) | 1604(10) | 1041.9(10) | 1092.2(2) |
| Z | 2 | 2 | 2 | 2 | 2 | 2 | 1 | 2 |
| D calc, Mg m−3 | 1.862 | 1.739 | 1.818 | 1.674 | 1.649 | 1.803 | 1.717 | 1.702 |
| F(000) | 582 | 550 | 586 | 846 | 836 | 876 | 550 | 562 |
| μ(Mo Kα), mm−1 | 1.119 | 1.265 | 1.089 | 0.829 | 0.725 | 0.769 | 1.249 | 1.054 |
| Range (2θ) for data collection, ° | 3.36 ≤ 2θ ≤ 56.30 | 3.28 ≤ 2θ ≤ 52.00 | 3.29 ≤ 2θ ≤ 51.99 | 3.09 ≤ 2θ ≤ 50.14 | 3.09 ≤ 2θ ≤ 52.00 | 3.48 ≤ 2θ ≤ 51.99 | 3.20 ≤ 2θ ≤ 52.00 | 4.46 ≤ 2θ ≤ 52.00 |
| Independent reflections | 5049 [R(int) = 0.0363] | 3990 [R(int) = 0.1255] | 4203 [R(int) = 0.0418] | 5836 [R(int) = 0.1137] | 6620 [R(int) = 0.0649] | 6249 [R(int) = 0.0430] | 4092 [R(int) = 0.0829] | 4276 [R(int) = 0.0847] |
| Data/restraints/parameters | 5049/0/332 | 3990/0/316 | 4203/0/316 | 5836/2/508 | 6620/0/496 | 6249/1/519 | 4092/0/316 | 4276/0/302 |
| Quality-of-fit indicatorc | 1.034 | 1.064 | 1.123 | 1.048 | 1.005 | 1.015 | 1.027 | 1.012 |
| Final R indices [I > 2σ(I)]a,b | R 1 = 0.0332, wR2 = 0.0607 | R 1 = 0.0742, wR2 = 0.0917 | R 1 = 0.0493, wR2 = 0.1295 | R 1 = 0.0838, wR2 = 0.2025 | R 1 = 0.0438, wR2 = 0.0852 | R 1 = 0.0467, wR2 = 0.1104 | R 1 = 0.0463, wR2 = 0.0899 | R 1 = 0.0378, wR2 = 0.0598 |
| R indices (all data) | R 1 = 0.0517, wR2 = 0.0663 | R 1 = 0.1386, wR2 = 0.1055 | R 1 = 0.0565, wR2 = 0.1334 | R 1 = 0.1468, wR2 = 0.2372 | R 1 = 0.0675, wR2 = 0.0926 | R 1 = 0.0716, wR2 = 0.1226 | R 1 = 0.0857, wR2 = 0.1029 | R 1 = 0.0636, wR2 = 0.0655 |
Results and discussion
Syntheses and ligand transformation
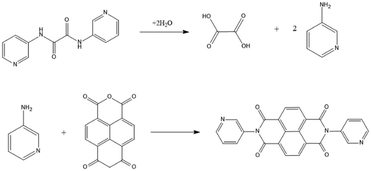
Seven CPs, [Cd(L1)0.5(1,4,5,8-NTC′)(H2O)2]n, 1, {[Zn(L2)0.5(1,4,5,8-NTC′)(H2O)2]·H2O}n, 2, {[Cd(L2)0.5(1,4,5,8-NTC′)(H2O)2]·H2O}n, 3, {[Zn(L5)(1,4,5,8-NTC′)(H2O)]·0.5OA}n, 4, [Cd(L5)(1,4,5,8-NTC′)(H2O)]n, 5a, {[Cd(L5)(1,4,5,8-NTC′)(H2O)]·2H2O}n, 5b, and {[Cd(L4)(1,4,5,8-NTC)0.5(H2O)]·0.5H2O}n, 7, and one dinuclear complex, [Zn2(L4)(1,4,5,8-NTC′)2(H2O)6], 6, have been synthesized. A distinctive feature showing the transformation from 1,4,5,8-H4NTC to 1,4,5,8-NTC′2− can be observed in 1–6, presumably due the condensation of the carboxylate groups of 1,4,5,8-H4NTC under the influence of the metal ion, as shown in Fig. 2. Such a transformation has been observed in {[Cd2(H2Me4bpz)(ntcaa)2(H2O)]H2O}n (ntcaa = 1,4,5,8-NTC′2−).27 In a marked contrast, in 7, the metal ion is coordinated with the unmodified 1,4,5,8-NTC4−.On the other hand, in CPs 4 and 5a, the starting L3 has been transformed to L5, indicating the hydrolysis of L3 to form oxalic acid and 3-aminopyridine, as shown in Fig. 3, followed by the reaction of 3-aminopyridine with 1,4,5,8-naphthalenetetracarboxylic dianhydride (1,4,5,8-NTC′′) to establish L5. Oxalic acid was found co-crystallizing in the crystal structure of 4. To confirm the formation of L5 and 5a, L5 was synthesized by the reaction of 3-aminopyridine and NTC′′,23 which was then reacted with 1,4,5,8-H4NTC and Cd(II) salt to afford 5b.
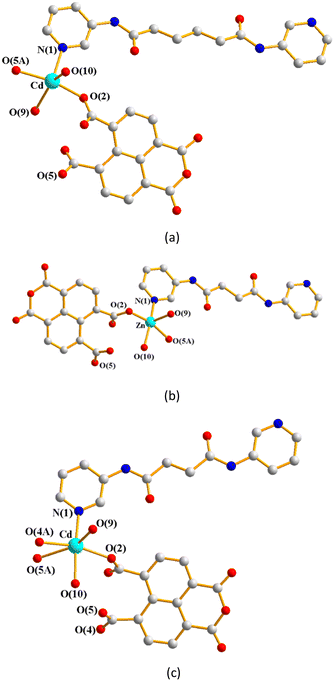
![[1 with combining macron]](https://www.rsc.org/images/entities/char_0031_0304.gif) , with each asymmetric unit consisting of one M(II) (M = Cd, 1; Zn, 2; Cd, 3) cation, a half of a bpba ligand (bpba = L1, 1; L2, 2 and 3), one 1,4,5,8-NTC′2− ligand and two coordinated water molecules, as well as one co-crystallized water molecule in each of 2 and 3. Fig. 4(a)–(c) depict drawings showing the coordination environments about the metal ions of 1–3. Both the Cd(II) ion of 1 and Zn(II) ion of 2 adopt the distorted square pyramidal geometry (τ5 = 0.30, 1; 0.05, 2).28 The Cd(II) ion of 1 is coordinated by two oxygen atoms from two different 1,4,5,8-NTC′2− ligands [Cd–O = 2.1876(19)–2.1933(18) Å], two oxygen atoms from two coordinated water molecules [Cd–O = 2.230(3)–2.368(8) Å] and one pyridyl nitrogen atoms from the L1 ligand [Cd–N = 2.271(2) Å], whereas the Zn(II) center of 2 is coordinated by two oxygen atoms from two different 1,4,5,8-NTC′2− ligands [Zn–O = 2.049(3)–2.060(3) Å], two oxygen atoms from two coordinated water molecules [Zn–O = 2.026(3)–2.114(3) Å] and one pyridyl nitrogen atoms from the L2 ligand [Cd–N = 2.069(4) Å]. On the other hand, the Cd(II) ion of 3 is coordinated by three oxygen atoms from two different 1,4,5,8-NTC′2− ligands [Cd–O = 2.226(4)–2.534(4) Å], two oxygen atoms from two coordinated water molecules [Cd–O = 2.250(4)–2.336(4) Å] and one pyridyl nitrogen atoms from the L2 ligand [Cd–N = 2.253(5) Å], resulting in a distorted octahedral geometry.
, with each asymmetric unit consisting of one M(II) (M = Cd, 1; Zn, 2; Cd, 3) cation, a half of a bpba ligand (bpba = L1, 1; L2, 2 and 3), one 1,4,5,8-NTC′2− ligand and two coordinated water molecules, as well as one co-crystallized water molecule in each of 2 and 3. Fig. 4(a)–(c) depict drawings showing the coordination environments about the metal ions of 1–3. Both the Cd(II) ion of 1 and Zn(II) ion of 2 adopt the distorted square pyramidal geometry (τ5 = 0.30, 1; 0.05, 2).28 The Cd(II) ion of 1 is coordinated by two oxygen atoms from two different 1,4,5,8-NTC′2− ligands [Cd–O = 2.1876(19)–2.1933(18) Å], two oxygen atoms from two coordinated water molecules [Cd–O = 2.230(3)–2.368(8) Å] and one pyridyl nitrogen atoms from the L1 ligand [Cd–N = 2.271(2) Å], whereas the Zn(II) center of 2 is coordinated by two oxygen atoms from two different 1,4,5,8-NTC′2− ligands [Zn–O = 2.049(3)–2.060(3) Å], two oxygen atoms from two coordinated water molecules [Zn–O = 2.026(3)–2.114(3) Å] and one pyridyl nitrogen atoms from the L2 ligand [Cd–N = 2.069(4) Å]. On the other hand, the Cd(II) ion of 3 is coordinated by three oxygen atoms from two different 1,4,5,8-NTC′2− ligands [Cd–O = 2.226(4)–2.534(4) Å], two oxygen atoms from two coordinated water molecules [Cd–O = 2.250(4)–2.336(4) Å] and one pyridyl nitrogen atoms from the L2 ligand [Cd–N = 2.253(5) Å], resulting in a distorted octahedral geometry.
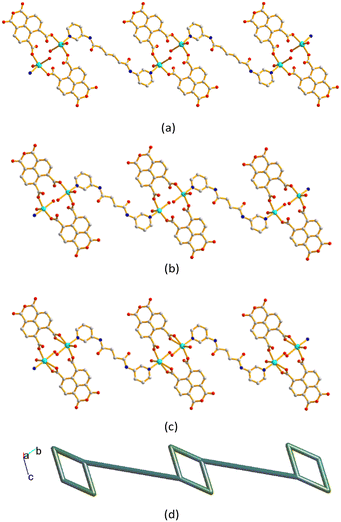
The metal ions are further linked together by 1,4,5,8-NTC′2− and bpba ligands to afford 1D decorated zigzag chains, Fig. 5(a)–(c). If the metal ions are defined as 3-connected nodes, the 1,4,5,8-NTC′2− ligands as 2-connected nodes, while the bpba ligands as linkers, the structures of CPs 1–3 can be regarded as 1D looped chains with the (4)-2,3C2 topology, as shown in Fig. 5(d), as determined using ToposPro.29 The structural types of 1–3 are thus subject to the formation of 1,4,5,8-NTC′2−, regardless of the identities of the metal ions and the bpba ligands.
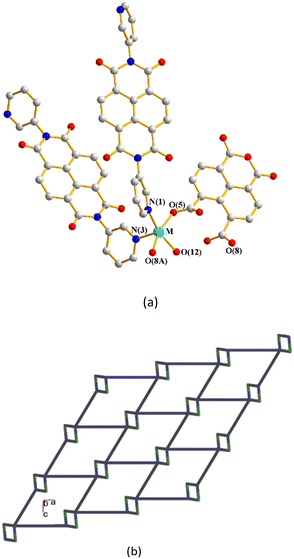
![[1 with combining macron]](https://www.rsc.org/images/entities/char_0031_0304.gif) . Each of the asymmetric units consists of one M(II) cation (M = Zn, 4; Cd, 5a; Cd, 5b), two halves of an L5 ligand, one 1,4,5,8-NTC′2− ligand and one coordinated water molecule. In addition, there are a half of a co-crystallized oxalic acid in 4 and two cocrystallized water molecule in 5b, respectively. Fig. 6(a) depicts a representative drawing showing the coordination environment about the metal ion, which is five-coordinated by two oxygen atoms from two 1,4,5,8-NTC′2− ligands [Zn–O = 2.063(5)–2.084(6) Å for 4; Cd–O = 2.234(3)–2.246(3) Å for 5a; Cd–O = 2.234(3)–2.246(3) Å for 5b], one oxygen atom from the coordinated water molecule [Zn–O = 2.029 (5) Å for 4; Cd–O = 2.231(2) Å for 5a; Cd–O = 2.231(2) Å for 5b] and two pyridyl nitrogen atoms from two different L5 ligands [Cd–N = 2.084(6)–2.119(6) Å for 4; Cd–N = 2.292(3)–2.279(3) Å for 5a; Cd–N = 2.292(3)–2.279(3) Å for 5b], resulting in a distorted square pyramidal geometry (τ5 = 0.03 for 4; 0.06 for 5a; 0.03 for 5b). The M(II) ions are further linked by 1,4,5,8-NTC′2− and L5 ligands to afford a 2D structure. If the M(II) ions are defined as 4-connected nodes and 1,4,5,8-NTC′2− ligands as 2-connected nodes, while L5 as linkers, the structures of these CPs can be regarded as 2D nets with the {4·85}{4}-2,4L1 topology, Fig. 6(b). Similar to 1–3, the structural types of 4–5 are subject to the formation of 1,4,5,8-NTC′2−.
. Each of the asymmetric units consists of one M(II) cation (M = Zn, 4; Cd, 5a; Cd, 5b), two halves of an L5 ligand, one 1,4,5,8-NTC′2− ligand and one coordinated water molecule. In addition, there are a half of a co-crystallized oxalic acid in 4 and two cocrystallized water molecule in 5b, respectively. Fig. 6(a) depicts a representative drawing showing the coordination environment about the metal ion, which is five-coordinated by two oxygen atoms from two 1,4,5,8-NTC′2− ligands [Zn–O = 2.063(5)–2.084(6) Å for 4; Cd–O = 2.234(3)–2.246(3) Å for 5a; Cd–O = 2.234(3)–2.246(3) Å for 5b], one oxygen atom from the coordinated water molecule [Zn–O = 2.029 (5) Å for 4; Cd–O = 2.231(2) Å for 5a; Cd–O = 2.231(2) Å for 5b] and two pyridyl nitrogen atoms from two different L5 ligands [Cd–N = 2.084(6)–2.119(6) Å for 4; Cd–N = 2.292(3)–2.279(3) Å for 5a; Cd–N = 2.292(3)–2.279(3) Å for 5b], resulting in a distorted square pyramidal geometry (τ5 = 0.03 for 4; 0.06 for 5a; 0.03 for 5b). The M(II) ions are further linked by 1,4,5,8-NTC′2− and L5 ligands to afford a 2D structure. If the M(II) ions are defined as 4-connected nodes and 1,4,5,8-NTC′2− ligands as 2-connected nodes, while L5 as linkers, the structures of these CPs can be regarded as 2D nets with the {4·85}{4}-2,4L1 topology, Fig. 6(b). Similar to 1–3, the structural types of 4–5 are subject to the formation of 1,4,5,8-NTC′2−.
![[1 with combining macron]](https://www.rsc.org/images/entities/char_0031_0304.gif) and the asymmetric unit comprises one Zn(II) cation, a half of an L4 ligand, one 1,4,5,8-NTC′2− ligand and three coordinated water molecules. Fig. 7(a) depicts a drawing showing the dinuclear structure of 6, in which the two Zn(II) ions are bridged by the L4 ligand. Each of the two Zn(II) ions is six-coordinated by two oxygen atoms from the 1,4,5,8-NTC′2− ligand [Zn–O = 2.203(3)–2.230(3) Å], three oxygen atoms from three coordinated water molecules [Zn–O = 2.039(3)–2.154(3) Å] and one pyridyl nitrogen atoms from the L4 ligand [Zn–N = 2.061(3) Å], resulting in a distorted octahedral geometry. Moreover, the dinuclear molecules are interlinked extensively through O–H---O [O–H⋯O = 2.1010–2.2237 Å] hydrogen bonds. Considering molecules of 6 as nodes that are linked by the hydrogen bonds, a topological (412·63)-pcu supramolecular structure can be obtained, as shown in Fig. 7(b).
and the asymmetric unit comprises one Zn(II) cation, a half of an L4 ligand, one 1,4,5,8-NTC′2− ligand and three coordinated water molecules. Fig. 7(a) depicts a drawing showing the dinuclear structure of 6, in which the two Zn(II) ions are bridged by the L4 ligand. Each of the two Zn(II) ions is six-coordinated by two oxygen atoms from the 1,4,5,8-NTC′2− ligand [Zn–O = 2.203(3)–2.230(3) Å], three oxygen atoms from three coordinated water molecules [Zn–O = 2.039(3)–2.154(3) Å] and one pyridyl nitrogen atoms from the L4 ligand [Zn–N = 2.061(3) Å], resulting in a distorted octahedral geometry. Moreover, the dinuclear molecules are interlinked extensively through O–H---O [O–H⋯O = 2.1010–2.2237 Å] hydrogen bonds. Considering molecules of 6 as nodes that are linked by the hydrogen bonds, a topological (412·63)-pcu supramolecular structure can be obtained, as shown in Fig. 7(b).
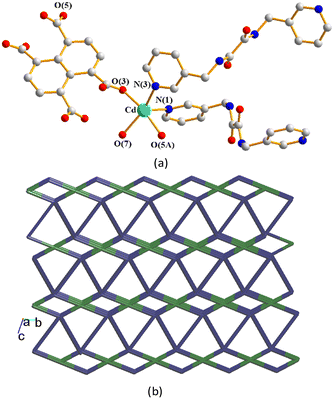
![[1 with combining macron]](https://www.rsc.org/images/entities/char_0031_0304.gif) and the asymmetric unit consists of one Cd(II) cation, two halves of an L4 ligand, a half of a 1,4,5,8-NTC4− ligand, one coordinated water molecule, and a half of a cocrystallized water molecule. Fig. 8(a) depicts a drawing showing the coordination environment about of Cd(II) ion of 7, which is five-coordinated by two oxygen atoms from two 1,4,5,8-NTC4− ligands [Cd–O = 2.227(2)–2.229(2) Å], one oxygen atom from the coordinated water molecule [Cd–O = 2.279(2) Å] and two pyridyl nitrogen atoms from two L4 ligands [Cd–N = 2.271(2) Å], resulting in a distorted square pyramidal geometry (τ5 = 0.21). The Cd(II) ions are further linked together by 1,4,5,8-NTC4− and L4 ligands to afford a 3D structure. If the Cd(II) atoms are defined as 4-connected nodes, 1,4,5,8-NTC4− as 4-connected nodes, while L4 as linkers, the structure of CP 7 can be simplified as a 3D net with the {4·64·8}2{42·62·82}-mog topology, Fig. 8(b). A structural comparison of 6 and 7 indicates that the metal identity governs the structural diversity.
and the asymmetric unit consists of one Cd(II) cation, two halves of an L4 ligand, a half of a 1,4,5,8-NTC4− ligand, one coordinated water molecule, and a half of a cocrystallized water molecule. Fig. 8(a) depicts a drawing showing the coordination environment about of Cd(II) ion of 7, which is five-coordinated by two oxygen atoms from two 1,4,5,8-NTC4− ligands [Cd–O = 2.227(2)–2.229(2) Å], one oxygen atom from the coordinated water molecule [Cd–O = 2.279(2) Å] and two pyridyl nitrogen atoms from two L4 ligands [Cd–N = 2.271(2) Å], resulting in a distorted square pyramidal geometry (τ5 = 0.21). The Cd(II) ions are further linked together by 1,4,5,8-NTC4− and L4 ligands to afford a 3D structure. If the Cd(II) atoms are defined as 4-connected nodes, 1,4,5,8-NTC4− as 4-connected nodes, while L4 as linkers, the structure of CP 7 can be simplified as a 3D net with the {4·64·8}2{42·62·82}-mog topology, Fig. 8(b). A structural comparison of 6 and 7 indicates that the metal identity governs the structural diversity.
Ligand conformations and bonding modes
The L1 and L2 can be arranged in A and G conformations when the C–C–C–C torsion angle (θ) is 180 ≥ θ > 90° and 0 ≤ θ ≤ 90°, respectively, and based on the relative orientation of the C![[double bond, length as m-dash]](https://www.rsc.org/images/entities/char_e001.gif) O groups, each conformation can adopt a cis or trans arrangement.12 Due to the difference in the orientations of the pyridyl nitrogen atom positions, three more orientations, anti–anti, syn–anti and syn–syn, are possible for the ligands L1, L2 and L4. By determining the orientation of the nitrogen on the pyridine, the conformation of L5 can be classified into cis or trans. Accordingly, the ligand conformations of 1–7 are assigned and listed in Table 2. On the other hand, the polycarboxylate ligands show various coordination modes in 1–7. While the 1,4,5,8-NTC′2− ligands in 1, 2, 4, 5a, and 5b bridge two metal ions through two of the carboxylate oxygen atoms, that in 3 bridges two metal ions through a chelation mode. In complex 6, the 1,4,5,8-NTC′2− ligand chelates a metal ion through the two oxygen atoms of one carboxylate group, and the 1,4,5,8-NTC4− ligand in 7 bridges four metal ions through four oxygen atoms from four carboxylate groups.
O groups, each conformation can adopt a cis or trans arrangement.12 Due to the difference in the orientations of the pyridyl nitrogen atom positions, three more orientations, anti–anti, syn–anti and syn–syn, are possible for the ligands L1, L2 and L4. By determining the orientation of the nitrogen on the pyridine, the conformation of L5 can be classified into cis or trans. Accordingly, the ligand conformations of 1–7 are assigned and listed in Table 2. On the other hand, the polycarboxylate ligands show various coordination modes in 1–7. While the 1,4,5,8-NTC′2− ligands in 1, 2, 4, 5a, and 5b bridge two metal ions through two of the carboxylate oxygen atoms, that in 3 bridges two metal ions through a chelation mode. In complex 6, the 1,4,5,8-NTC′2− ligand chelates a metal ion through the two oxygen atoms of one carboxylate group, and the 1,4,5,8-NTC4− ligand in 7 bridges four metal ions through four oxygen atoms from four carboxylate groups.
Powder X-ray analysis
In order to check the bulk purities of the products, powder X-ray diffraction (PXRD) patterns have been measured for 1–7. As shown in Fig. S1–S8,† the peak positions of the experimental and simulated PXRD patterns are in agreement with each other, which demonstrate that the crystal structures are representative of the bulk materials. The differences in intensity may be owing to the preferred orientation of the powder samples.Thermal properties
Thermal gravimetric analysis (TGA) was carried out to examine the thermal decomposition of 1–7. The samples were recorded from about 30 to 800 °C at 10 °C min−1 under a N2 atmosphere, as shown in Fig. S9–S16† and Table 3. Two-step decompositions involving losses of solvents and organic ligands are observed.| CP/complex | Solvent, T, °C (found/calc), % | Ligand, T, °C (found/calc), % |
|---|---|---|
| 1 | 2H2O | L 1 + 1,4,5,8-NTC′2− |
| 30–190 (6.19/5.62) | 230–800 (74.49/79.39) | |
| 2 | 3H2O | L 2 + 1,4,5,8-NTC′2− |
| 30–190 (3.18/4.25) | 235–800 (74.60/79.15) | |
| 3 | 2.5H2O | L 2 + 1,4,5,8-NTC′2− |
| 30–153 (9.04/9.22) | 240–800 (72.41/71.58) | |
| 4 | 1H2O + 0.5EDA | L 5 + 1,4,5,8-NTC′2− |
| 30–143 (9.33/7.57) | 320–800 (76.16/84.13) | |
| 5a | 1H2O | L 5 + 1,4,5,8-NTC′2− |
| 30–88 (4.67/2.11) | 192–800 (79.48/82.61) | |
| 5b | 2H2O | L 5 + 1,4,5,8-NTC′2− |
| 30–100 (7.06/4.14) | 147–800 (78.90/82.63) | |
| 6 | 2H2O | L 4 + 1,4,5,8-NTC′2− |
| 30–100 (10.30/10.03) | 180–800 (77.64/77.83) | |
| 7 | 1.75H2O | L 4 + 1,4,5,8-NTC4− |
| 30–173 (3.33/4.05) | 200–900 (75.61/75.84) |
Chemical stability
To select the solvent for subsequent metal ion sensing experiments, 10 mg of each of 1–3, 6, and 7 was immersed in 10 ml of 10 different solvents for seven days. Afterward, the samples were vacuum-dried and PXRD patterns measured. As shown in Fig. S17–S21,†1 and 7 maintain their crystal structures in all of the 10 different solvents, whereas 2 undergoes complete structural changes in DMF and dissolves completely in DMA, whereas 3 experiences complete collapse of its crystal structure in MeOH, DMA and DMF and 6 shows structural changes in DMA, DMF and ether. The results indicate that these 1–7 are stable in water for seven days.Luminescent properties
The excitation and emission spectra of L1, L2, and L4 and 1–3, 6, and 7 in the solid state are shown in Fig. S22–S26.†Table 4 lists their corresponding parameters. The spectra of L1, L2, L4 and 1,4,5,8-H4NTC show emissions in the range of 459–496 nm, which may be ascribed to the intraligand (IL) n to π* or π to π* transitions. Since Zn(II) and Cd(II) ions are not easily oxidized or reduced, the emissions of 1–3, 6, and 7, which are in the range 404–510 nm, are not due to ligand-to-metal charge transfer (LMCT) or metal-to-ligand charge transfer (MLCT), but most probably ligand-to-ligand charge transfer (LLCT) or intra-ligand charge transfer.30,31| Compound | λ ex (nm) | λ em (nm) | Compound | λ ex (nm) | λ em (nm) |
|---|---|---|---|---|---|
| L 1 | 411 | 459 | L 4 | 347 | 473 |
| L 2 | 368 | 496 | 1,4,5,8-H4NTC | 400 | 472 |
| 1 | 338 | 404 | 6 | 405 | 445 |
| 2 | 367 | 510 | 7 | 442 | 500 |
| 3 | 410 | 443 |
Metal cation detection
For each experiment, 30 mg of the sample was immersed in 10 mL of 10−2 M aqueous solutions of different metal ions, involving Fe(NO3)3 and M(OAc)2 (M = Fe2+, Co2+, Ni2+, Cu2+, Zn2+) at room temperature for 24 hours. The sample was filtered, washed with water and dried under vacuum, and then its solid-state emission spectrum measured. Fig. S27–S31† display the emission spectra and the bar charts showing the percentages of quenching of 1–3, 6, and 7. Fig. 9 depicts the bar charts showing the average quenching percentages of three experiments. The percentages of quenching of 1–3, 6, and 7 toward Fe3+ are 66, 71, 64, 80 and 90%, respectively, indicating that 7 affords the best quenching efficiency.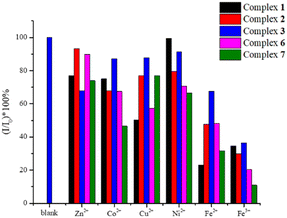 | ||
| Fig. 9 Bar charts showing the average quenching percentages of the 1–3, 6, and 7 in the various cations. | ||
Electron transfer, structure collapse, competitive absorption, and cation exchange are the main causes of fluorescence quenching.32 The PXRD patterns of 7 before and after immersion in Fe3+ solution are thus compared. Fig. S32† indicates that no significant change of the PXRD patterns can be observed, revealing that the quenching is not due to the structural collapse. Fig. S33† shows that the absorption spectrum of the Fe3+ solution partially overlaps with the excitation spectrum of 7, therefore, the fluorescence quenching can be ascribed to competitive absorption. SEM-EDX spectra, as shown in Fig. S34,† demonstrate that Fe3+ ions are indeed adsorbed by 7.
FT-IR and XPS spectroscopy are applied for the investigation of the interactions between the Fe3+ ion and 7. As shown in Fig. S35,† the amide C![[double bond, length as m-dash]](https://www.rsc.org/images/entities/char_e001.gif) O stretching frequency shifted slightly from ν = 1676 cm−1 to ν = 1659 cm−1, indicating a red shift due to the weak interaction between Fe3+ and the amide oxygen atom. Fig. S36† shows the XPS spectra of 7 before and after immersing in Fe3+. The fitting analysis reveals four signals at 531.0, 531.8, 532.5 and 533.8 eV, Fig. S37,† assignable to O*
O stretching frequency shifted slightly from ν = 1676 cm−1 to ν = 1659 cm−1, indicating a red shift due to the weak interaction between Fe3+ and the amide oxygen atom. Fig. S36† shows the XPS spectra of 7 before and after immersing in Fe3+. The fitting analysis reveals four signals at 531.0, 531.8, 532.5 and 533.8 eV, Fig. S37,† assignable to O*![[double bond, length as m-dash]](https://www.rsc.org/images/entities/char_e001.gif) C–N, O*
C–N, O*![[double bond, length as m-dash]](https://www.rsc.org/images/entities/char_e001.gif) C–O, O
C–O, O![[double bond, length as m-dash]](https://www.rsc.org/images/entities/char_e001.gif) C–O* and H2O*, respectively.33,34 There is no significant change in the binding energy of O 1s electrons before and after the sensing experiments, therefore, the changes in the intensities are evaluated. The intensity of the peak at 531.0 eV decreased from 19 to 11%, while that at 531.8 eV increased from 39 to 45%, indicating the possible interaction between the oxygen atom of O*
C–O* and H2O*, respectively.33,34 There is no significant change in the binding energy of O 1s electrons before and after the sensing experiments, therefore, the changes in the intensities are evaluated. The intensity of the peak at 531.0 eV decreased from 19 to 11%, while that at 531.8 eV increased from 39 to 45%, indicating the possible interaction between the oxygen atom of O*![[double bond, length as m-dash]](https://www.rsc.org/images/entities/char_e001.gif) C–N and Fe3+, which further verifies the result from the investigation of the IR spectra.
C–N and Fe3+, which further verifies the result from the investigation of the IR spectra.
Quenching efficiency
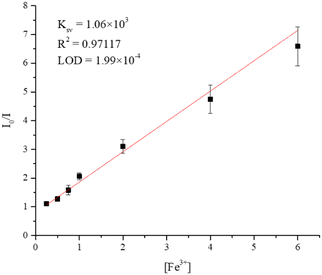
To understand the dependence of the quenching efficiency of 7 on the concentration of Fe3+ ions in aqueous solution, the sample of 7 was immersed in solutions of different concentrations (0.25–6 mM) of Fe3+ for 24 hours, followed by the measurement of the emission spectrum after immersion. The quenching efficiency of Fe3+ ions by 7 was analyzed by using the Stern–Volmer (SV) equation: (I0/I) = 1 + KSV[M],35 where I0 is the emission intensity of the intact sample, I is the emission intensity after immersion, KSV is the quenching constant and [M] is the molar concentration of Fe3+ ion. Fig. S38† shows the dependence of emission intensity of 7 on the concentration of Fe3+ ions, which decreases as the concentration of Fe3+ ions increases. Fig. 10 displays the Stern–Volmer (SV) plot of Fe3+ ions, indicating that at low concentrations (6–0.25 mM), the variation of (I0/I) is linear, giving 1.06 × 10³ M−1 and 1.99 × 10⁻⁴ M for the Stern–Volmer constant (KSV) and the limit of detection (LOD), respectively.Recycling capability
To evaluate the recycling capability, CP 7 was immersed in Fe3+ solution for one day, filtered, washed with water and then subjected to the measurement of PXRD patterns. As shown in Fig. S39,† the structure of 7 may probably remain stable for five cycles.Gas adsorption
N2 adsorption measurements of 1, 2, 3, 6, and 7 were conducted at 77 K, with the results shown in Fig. S40–S49.† The BET surface areas of 1, 2, 3, 6 and 7 are 273.32, 180.59, 266.25, 418.44 and 102.61 m2 g−1, respectively. Additionally, the pore-size distribution curves show that the pore sizes of 1, 2, 3, 6 and 7 are 6.22, 7.77, 8.26, 7.02 and 5.99 nm, respectively. While 7 gives the best quenching efficiency, its BET surface area and pore size are not the largest among 1, 2, 3, 6 and 7, indicating the stable 3D framework of 7 may enhance the quenching efficiency.Conclusions
Seven new CPs and one dinuclear complex ranging from 0D to 1D, 2D and 3D CPs have been successfully synthesized through hydrothermal reactions by using bpba, 1,4,5,8-H4NTC and metal salt. Ligand transformations from 1,4,5,8-H4NTC to 1,4,5,8-H2NTC′2 and L3 to L5 are observed in 1–6, whereas in 7, the 1,4,5,8-NTC4− anion retains its structure. CPs 1, 2, and 3 exhibit 1D chains with the 2,3C2 topology and 4, 5a, and 5b show 2D layers with the 2,4L2 topology, whereas 6 is dinuclear, exhibiting a 3D supramolecular structure with the pcu topology, and 7 has a 3D structure with the mog topology. The structural diversities of 1–7 are subject to the formation of 1,4,5,8-NTC′ and the identities of the bpba ligands. CPs 1, 2, 3 and 7 and the dinuclear complex 6 exhibit fluorescence properties, giving the 3D 7 the highest potential for detecting Fe3+ ions in aqueous solution with 1.06 × 10³ M−1 and 1.99 × 10⁻⁴ M for KSV and LOD, respectively.Data availability
The data supporting this article have been included as part of the ESI.† Crystallographic data for complexes 1–7 has been deposited at the CCDC with no. 2395512–2395519.Author contributions
Investigation, W.-H. C.; data curation, Y.-H. C.; review and supervision, K. B. T., S.-M. L. and J.-D. C. All authors have read and agreed to the published version of the manuscript.Conflicts of interest
There are no conflicts to declare.Acknowledgements
We are grateful to National Science and Technology Council of the Republic of China for support.References
- S. R. Batten, N. R. Champness, X.-M. Chen, J. Garcia-Martinez, S. Kitagawa, L. Öhrström, M. O'Keeffe, M. P. Suh and J. Reedijk, Pure Appl. Chem., 2013, 85, 1715–1724 CrossRef
.
-
E. R. T. Tiekink and J. J. Vittal, Frontiers in Crystal Engineering, John Wiley & Sons, Ltd., England, 2006 Search PubMed
.
- C.-Yi. Lee, M. Usman, S.-W. Wang, K. B. Thapa, T.-R. Chen and J.-D. Chen, CrystEngComm, 2024, 26, 5099–5107 RSC
.
- C.-Yi. Lee, Y.-H. Ye, S.-W. Wang and J.-D. Chen, Molecules, 2024, 29, 1748 CrossRef PubMed
.
- X.-K. Yang, W.-T. Lee, J.-H. Hu and J.-D. Chen, CrystEngComm, 2021, 23, 4486–4493 RSC
.
- C.-J. Chen, C.-L. Chen, T.-H. Liu, W.-T. Lee, J.-H. Hu, P. M. Chhetri and J.-D. Chen, Chemistry, 2021, 3, 1–12 CrossRef
.
- K. B. Thapa and J.-D. Chen, CrystEngComm, 2015, 17, 4611–4626 RSC
.
- T.-T. Liao, M. Usman, Y.-H. Ye, K. B. Thapa and J.-D. Chen, Inorg. Chim. Acta, 2023, 574, 122368 CrossRef
.
- X. Yan, J. Lei, Y.-P. Li, P. Zhang and Y. Wang, CrystEngComm, 2022, 24, 2264–2269 RSC
.
-
S. R. Batten, S. M. Neville and D. R. Turner, Coordination Polymers: Design, Analysis and Application, Royal Society of Chemistry, Cambridge, UK, 2009 Search PubMed
.
- S. Li, B. Wang, G. Liu, X. Li, C. Sun, Z. Zhang and X. Wang, Inorg. Chem. Front., 2024, 11, 1561–1572 RSC
.
- M. Govindaraj, S.-Y. Zhong, C.-H. Lin and J.-D. Chen, Molecules, 2023, 28, 2226 CrossRef
.
- F. Nie and D. Yan, Angew. Chem., Int. Ed., 2023, 62, e202302751 CrossRef PubMed
.
- X.-Y. Ren, F.-Y. Chen, C.-H. Zhang, Z.-G. Liang, X.-Y. Yu, S.-D. Han and G.-M. Wang, Chem. – Eur. J., 2024, 30, e202402581 CrossRef PubMed
.
- X.-G. Yang, Y.-J. Chen, P.-P. Yin, Y. Li, S.-Y. Yang, Y.-M. Li and L.-F. Ma, Chem. Sci., 2024, 15, 14202–14208 RSC
.
- X.-G. Yang, J.-H. Qin, Y.-D. Huang, Z.-M. Zhai, L.-F. Ma and D. Yan, J. Mater. Chem. C, 2020, 8, 17169–17175 RSC
.
- Y. Chen, A.-G. Liu, P.-D. Liu, Z.-T. Chen, S.-Y. Liu and B. Li, J. Mater. Chem. A, 2023, 11, 18236–18246 RSC
.
- G. C. Liu, Y. Li, J. Chi, N. Xu, X. L. Wang, H. Y. Lin and Y. Q. Chen, Dyes Pigm., 2020, 174, 108064 CrossRef
.
- B. Fu, J. Chen, Y. Cao, H. Li, F. Gao, D.-Y. Guo, F. Wang and Q. Pan, Sens. Actuators, B, 2022, 369, 132261 CrossRef
.
- Y.-F. Liu, J.-H. Hu, W.-T. Lee, X.-K. Yang and J.-D. Chen, Cryst. Growth Des., 2020, 20, 7211–7218 CrossRef
.
- T.-T. Liao, S.-Y. Lin and J.-D. Chen, CrystEngComm, 2023, 25, 1723–1730 RSC
.
- Y.-H. Liu, T.-T. Liao, S.-Y. Lin, S.-Y. Zhong, T.-R. Chen and J.-D. Chen, Inorg. Chim. Acta, 2023, 556, 121641 CrossRef
.
- S. Fang, E. Li, D. Zhu, G. Wu, Q. Zhang, C. Lin, F. Huang and H. Li, Chem. Commun., 2021, 57, 6074–6077 RSC
.
- Bruker AXS, APEX2, V2008.6; SAD ABS V2008/1; SAINT+V7.60A; SHELXTL V6.14, Bruker AXS Inc., Madison, Wisconsin, USA, 2008
.
- G. M. Sheldrick, Acta Crystallogr., Sect. C: Struct. Chem., 2015, 71, 3–8 Search PubMed
.
- A. L. Spek, Acta Crystallogr., Sect. C: Struct. Chem., 2015, 71, 9–18 CrossRef
.
- Y.-Q. Sun, S. Deng, S.-Z. Ge, Q. Liu and Y.-P. Chen, J. Cluster Sci., 2013, 24, 605–617 CrossRef CAS
.
- A. W. Addison, T. N. Rao, J. Reedijk, J. van Rijn and G. C. Verschoor, J. Chem. Soc., Dalton Trans., 1984, 1349–1356 RSC
.
- V. A. Blatov, A. P. Shevchenko and D. M. Proserpio, Cryst. Growth Des., 2014, 14, 3576–3586 CrossRef CAS
.
- D. Sun, Z.-H. Yan, V. A. Blatov, L. Wang and D.-F. Sun, Cryst. Growth Des., 2013, 13, 1277–1289 CrossRef CAS
.
- J.-X. Yang, Z. Xin, Y.-Y. Qin and Y.-G. Yao, Cryst. Growth Des., 2020, 20, 6366–6381 CrossRef CAS
.
- M. Pamei and A. Puzari, Nano-Struct. Nano-Objects, 2019, 19, 100364 CrossRef CAS
.
- NIST X-ray Photoelectron Spectroscopy Database, NIST Standard Reference Database Number 20, National Institute of Standards and Technology, Gaithersburg, M. D., 2000 Search PubMed.
-
G. Beamson and D. Briggs, High Resolution XPS of Organic Polymers: The Scienta ESCA300 Database, Wiley, New York, NY, 1992 Search PubMed
.
- S. S. Nagarkar, B. Joarder, A. K. Chaudhari, S. Mukherjee and S. K. Ghosh, Angew. Chem., Int. Ed., 2013, 52, 2881–2885 CrossRef CAS
.
Footnote |
| † Electronic supplementary information (ESI) available: PXRD patterns (Fig. S1–S8, S17–S21 and S32). TGA curves (Fig. S9–S16). Emission spectra (Fig. S22–S31 and S38). UV-vis absorption spectrum (Fig. S33). EDX data (Fig. S34). IR spectra (Fig. S35). XPS spectra (Fig. S36 and S37). Nitrogen adsorption–desorption isotherm (Fig. S39–S48). CCDC no. 2395512–2395519 contain the supplementary crystallographic data for this paper. For ESI and crystallographic data in CIF or other electronic format see DOI: https://doi.org/10.1039/d4ce01119h |
| This journal is © The Royal Society of Chemistry 2025 |

