
 Open Access Article
 This Open Access Article is licensed under a Creative Commons Attribution-Non Commercial 3.0 Unported Licence
A high sensitivity prostate-specific antigen SERS detection platform based on laser resonance nanoparticles†
Shi-Ying Fua,
Shanshan Xua,
Hongmei Lia,
Xian-Ming Guoa,
Jia-Sheng Lina,
Bing Guana,
Bin Chena,
Tao Wang*a,
Yue-Jiao Zhang
 *a and
Jian-Feng Li*ab
*a and
Jian-Feng Li*ab
aThe Key Laboratory of Urinary Tract Tumours and Calculi, Department of Urology, The First Affiliated Hospital of Xiamen University, School of Medicine, College of Chemistry and Chemical Engineering, College of Energy, and Discipline of Intelligent Instrument and Equipment, Xiamen University, Xiamen 361005, China. E-mail: taowang@xmu.edu.cn; zhangyuejiao@xmu.edu.cn; li@xmu.edu.cn
bScientific Research Foundation of State Key Laboratory of Vaccines for Infectious Diseases, Xiang An Biomedicine Laboratory, Xiamen 361005, China
First published on 24th January 2025
Abstract
Accurate quantitative analysis of cancer-related specific biomarkers in clinical serum is very important for the early diagnosis and treatment of cancer. Hospitals often use serum prostate-specific antigen (PSA) as a biomarker associated with prostate cancer diagnosis and prognosis, and prostate cancer cells often produce more PSA than benign cells, leading to elevated PSA levels in the blood. In this study, an immunoassay based on surface-enhanced Raman scattering (SERS) was established for the detection of PSA employing magnetic beads along with SERS nanotags. The hospital currently takes two hours to test the results, the equipment price is high, and the detection price is high, and the penetration rate in township hospitals in China is low. SERS has super-sensitive and fast detection ability, and the availability of the detection result in 10 minutes significantly reduces the waiting time. Besides, the detection method is simple, cheap and portable, making it suitable for township health centers. To evaluate the clinical applicability of this method, 75 male clinical serum samples were tested, most of which were in the gray area of 4.0–10.0 ng mL−1. The experimental results show that our detection method has good agreement with the results measured by the electrochemical luminescence (ECL) system in the hospital clinical laboratory. Our detection limit for actual samples from patients can reach 0.029 ng mL−1. Therefore, our clinical serum PSA marker detection method based on SERS has a great potential market in towns and villages.
 Yue-Jiao Zhang | Yue-Jiao Zhang obtained her Ph.D. in chemistry from the College of Chemistry and Chemical Engineering, Xiamen University in 2020. She is currently an associate professor at the College of Energy, Xiamen University. Her present research interests focus on plasmonic core–shell nanomaterials, surface-enhanced Raman spectroscopy (SERS), in situ spectroscopy for rapid Raman detection of disease, food, hazardous chemical substances, and electrocatalysis. She has published more than 50 papers, in journals including Nat. Rev. Methods Primers, J. Am. Chem. Soc., Angew. Chem. Int. Ed., Adv. Mater., ACS Nano, Small Methods, Nano Lett., Anal. Chem. and so on. |
Introduction
Cancer is one of the major social public health security and economic issues in the 21st century. Prostate cancer (PCa) is the most prevalent cancer among men and ranks as one of the top causes of cancer-related deaths.1,2 The most common test for prostate cancer is the detection of prostate-specific antigen (PSA) levels in serum, which can mitigate the harm of overdiagnosis caused by targeting molecular markers and magnetic resonance imaging biopsies. Serum PSA testing can greatly avoid these problems. PSA is a Kallikrein-like serine protease that has received approval from the U.S. Food and Drug Administration (FDA) as a biomarker associated with prostate cancer diagnosis and prognosis.3 When prostatitis, benign prostatic hyperplasia (BPH), or PCa occurs, serum PSA levels in patients are elevated. In particular, PSA levels in older men also rise to abnormal levels as they age. The identification of prostate cancer, prostate hyperplasia and normal samples has aroused the interest of many researchers.4,5 Before the patient undergoes a prostate biopsy, the doctor usually performs an initial screening for PCa by testing the patient's serum PSA. The amount of PSA is used by doctors as a reference in the general diagnosis of prostate cancer. Serum PSA above 10.0 ng mL−1 indicates a serious risk of prostate cancer. In contrast, when the PSA level is below 4.0 ng mL−1, the likelihood of prostate cancer is lower.6 The existing detection technology in hospitals takes a long time and the detection efficiency is not high. Therefore, it is necessary to be able to quickly and accurately detect human PSA levels in order to accurately screen patients for PCa as an early diagnosis. So far, various detection methods have been used for direct detection of PSA, such as fluorescence immunoassay,7–9 electrochemical immunosensing,10,11 electrochemical luminescence,12 mass spectrometry13 and so on. However, the disadvantages of the present methods are the time consuming and complicated operation methods. In China, due to the large equipment needed for testing, the high price and long analysis time, the testing work is mainly completed in large hospitals, and the penetration rate of townships is low.Surface-enhanced Raman scattering (SERS) is a surface-sensitive technique that improves the Raman scattering efficiency of molecule adsorbates on rough nanostructures, typically silver or gold nanomaterials.14 It can increase the sensitivity of analytical methods by several orders of magnitude (ranging from 104 to 1011).15,16 SERS detection has emerged as a promising and powerful spectroscopy technique by providing ultra-sensitive and unique chemical fingerprint details. The sensitivity of biological samples directly measured for complex systems is relatively limited, and signals need to be transduced by labels to obtain extremely high sensitivity. Labels can use dye molecules. Therefore, rapid and sensitive SERS detection technology for disease diagnosis is becoming more and more popular.17–20 Some studies have shown that immunoassay technology for PSA detection based on SERS can improve the diagnostic accuracy of PSA.21,22 The gold-up conversion nanoparticle assembled pyramid structure constructed by Hao et al.23 can simultaneously detect PSA and thrombin with high sensitivity. The process of assembling the pyramid was complicated and took more than 8 hours. Ouhibi et al.24 utilized a substrate modified with silver nanoparticles on silicon nanowires to achieve highly sensitive and selective detection of PSA with good stability. It can be detected within 30 minutes with a detection limit of 0.1 μg L−1. Turan et al.25 combined magnetic molecularly imprinted polymers with SERS, improving the specificity and accuracy of detection with a detection limit as low as 0.9 pg mL−1. The whole test process takes more than 90 minutes. Wang et al.26 formed a DNA nano firecracker structure through a concatenated hybridization chain reaction to realize ultrasensitive detection with a detection limit of 0.94 fg mL−1. The whole process involves multiple steps and takes more than 6 hours. Zhao et al.27 constructed a SERS immunosensor based on magnetic beads. They used the biotin–streptavidin interaction to amplify the signal for detecting PSA, with a detection limit as low as 0.87 pg mL−1. The whole test process takes more than 2 hours. Our detection method is similar to this work, and we have the advantage of being able to obtain accurate results in a shorter time. These research achievements provide more accurate and efficient detection means for the early diagnosis of prostate cancer and are expected to promote the development of clinical detection technology. However, the shortcomings of these methods are that the material preparation process is complex and time-consuming, and the operation method is also cumbersome. Our proposed detection approach features straightforward operation. It merely requires the addition of diverse components into the system for reaction, eliminating the necessity of performing multiple steps under varying conditions. The entire detection process can be completed within 10 minutes. This method is characterized by low cost, simplified detection procedures, rapid response, high sensitivity, and strong selectivity. We conducted blind tests on dozens of human blood samples from hospitals, and the experimental results showed stability and reliability.
SERS has been widely used in the analysis of complex biomolecules because of its non-destructive, ultra-sensitive, reliable and rapid detection ability.28,29 Immunoassays rely on specific interactions between antibodies and complementary antigens to identify, detect, and quantify a wide range of clinical and environmental analytes with a high degree of specificity through direct or indirect detection of antigens. This is a mature bioanalysis tool. It has become a powerful analytical tool for clinical diagnosis, biochemical analysis and environmental monitoring.30,31 This method of analysis is based on the formation of an immune complex between one or two antibodies and antigens, and then the signal generated by the tag attached to the reagent is measured. The combination of SERS and the sandwich principle has attracted much attention from researchers.32,33 Here, we performed a SERS-based PSA biomarker immunoassay. We rapidly mixed and incubated aqueous phases including PSA biomarkers, magnetic beads (MB) and SERS tags. The immune complex was isolated using a permanent magnet and the PSA biomarker level was measured by SERS. The advantages of high sensitivity and fast detection speed of SERS were combined with the advantages of high affinity and strong specificity of antigen and antibody. IR808 with a large Raman cross-section is selected as a signal molecule to provide a positive signal. Through the enrichment of magnetic beads, the signal is amplified, and the sensitivity of detection is improved.34–37 Ultra-fast and sensitive detection results were achieved within 10 minutes, and the experimental results were highly consistent with the results of electrochemical luminescence in the hospital. Compared with the standard assay in the hospital, the operation of this study was simpler and faster, and the Raman instrument used for detection was small in size and simple to operate, which could be extended to the early screening of prostate cancer in towns and villages.
Experimental
Materials and reagents
Chloro-auric acid hydrate (HAuCl4·4H2O) and trisodium citrate were purchased from Sinopharm Chemical Reagent Co., Ltd (Shanghai, China). Boric acid buffer (BB) and Dynabeads MyOne carboxylic acid (1 μm, 10 mg mL−1) were purchased from Thermo Fisher Scientific. Disodium hydrogen phosphate (Na2HPO4) and disodium hydrogen phosphate (NaH2PO4) were produced by Xilong Technology Co., Ltd, China. Bovine serum albumin (BSA) was purchased from Sigma-Aldrich Corporation. Tween-20 and 2-morpholinoethanesulfonic acid (MES) were acquired from Beijing Inno Chem Science & Technology Co., Ltd (China). 1-Ethyl-3-(3-(dimethylamino)-propyl) carbodiimide (EDC) was purchased from Sangon Biotech (Shanghai) Co., Ltd. N-Hydroxysuccinimide (NHS) was obtained from Shanghai Yuanye Bio-Technology Co., Ltd. PSA antibodies and antigens were purchased from ABclonal Technology (China). Near infrared fluorescent cyanamide dye (IR808) was purchased from Shaanxi Xinyan Bomei Biotechnology Co., Ltd. The water used in the experiment was ultrapure Milli-Q water (18.2 MΩ cm).Equipment
The UV-vis absorption spectra were measured with a UV–vis spectrophotometer (Shimadzu, UV 1280). Field emission scanning electron microscopy (SEM) images were obtained using a Zeiss Gemini SEM 500 instrument (Germany) at an accelerating voltage of 5 kV. Transmission electron microscopy (TEM) images were obtained by using a JEOL JEM-2100plus microscope under 200 kV acceleration voltage. Dynamic light scattering (DLS) measurements were performed with a Zetasizer NANO-ZS instrument (Malvern, U.K.). The portable Raman spectrometer (SHINS-P785V) laser of Xiamen SHINs Technology Co., Ltd was used for Raman spectrum acquisition.Synthesis of Au nanoparticles (AuNPs)
According to the Frens method38 as described in the literature, 55 nm AuNPs were prepared by slightly adjusting the method. To put it simply, 100 mL of an aqueous solution of HAuCl4 with a mass fraction of 0.01% was heated to boiling, and a freshly prepared 1% trisodium citrate solution was rapidly added to the continuously stirred solution. The colour of the solution slowly changed from the previous light yellow to black, and quickly changed to brownish red after 2–3 minutes. After that, the solution was boiled for another 40 minutes to stop the reaction. The solution was continuously stirred and cooled to room temperature, resulting in red AuNPs with a diameter of about 55 nm.Preparation of PSA detection antibody conjugated SERS tags
The Raman signal detector of the coupled antibody was prepared with reference to the procedure reported30 and with minor modifications. To fix the Raman reporter modification to the AuNPs surface, 4 μL of 0.75 mM IR808 was dripped into 1 mL of 55 nm AuNPs with 1 OD UV absorption, and the AuNPs and IR808 mixture was gently stirred for 5 minutes. After the reaction, the mixture was centrifuged at 8000 rpm for 10 min to remove the free signal molecules and the modified AuNPs were separated. The resulting mixture was washed with 1.0 mL of 2 mM BB (pH 7.4). Finally, the mixture was centrifuged at 8000 rpm for 10 min. After removing the supernatant, the precipitation was washed twice with 2 mM BB (pH 7.4), continuously centrifuged, and then dispersed. The obtained nanoprobes were stored at 4 °C and could be stably stored for about two weeks. The signalling molecule IR808 contains two carboxylic acid functional groups, which are covalently coupled to the amino group of the antibody by activating the carboxylic acid functional group. Freshly prepared EDC (5 μL, 25 mM) and NHS (5 μL, 25 mM) were vigorously mixed with modified nanoprobes at 25 °C for 30 min. The excess EDC and NHS were washed three times from the activated nanoparticles and re-suspended in PBS (10 mM, pH 7.4). AuNPs with an activated carboxyl group and a PSA detection antibody (4 μL, 1 mg mL−1) were reacted in a centrifuge tube at 4 °C for 8 h. The excess antibodies were removed by 3 rounds of centrifugation (8000 rpm, 10 min) and re-suspended in PBS (10 mM, pH 7.4). The modified antibody nanoprobes were stored at 4 °C and could be stably stored for about two months.Preparation of PSA capture antibody conjugated magnetic beads
The preparation of the trapping probe is achieved by covalently coupling an amino group on the antibody with a carboxyl group on the surface of the magnetic bead, using EDC and NHS as coupling agents. First, EDC (5 μL, 0.1 M) and NHS (5 μL, 0.1 M) solutions were added to the magnetic beads diluted to a certain concentration, and the magnetic beads were incubated for 30 min to activate carboxyl groups. After incubation, the magnetic beads were separated with permanent magnets and then washed twice with PBS (10 mM, pH 7.4). The magnetic beads were resuspended with 0.5 mL of PBS (10 mM, pH 7.4), gently shaken with 5 μL and 1 mg mL−1 PSA to capture the antibodies and incubated at 4 °C for 8 hours. Finally, the capture magnetic beads were obtained with the aid of a permanent magnet. Unbound antibodies were washed twice with PBS (10 mM, pH 7.4). The unreacted COOH group was inactivated with 10 μL of 1% BSA solution for 2 h. The MB of the final antibody coupling was stored in 10 mM PBS (pH 7.4) at 4 °C for the next step.BCA protein quantification kit
1. Preparation of the BCA working solution: according to the number of samples, an appropriate amount of BCA working solution was prepared by mixing 50 volumes of BCA Reagent A with 1 volume of BCA Reagent B (50![[thin space (1/6-em)]](https://www.rsc.org/images/entities/char_2009.gif) :1), and mixed well.
:1), and mixed well.
2. Drawing of the standard curve: a 96-well plate was taken and the reagent was diluted according to a certain concentration gradient.
3. Sample preparation: the protein sample to be tested was diluted with deionized water to an appropriate concentration. 20 μL of the sample was taken and 200 μL of BCA working solution was added to it.
4. Oscillation and mixing: after oscillation and mixing, the resultant mixture was placed at 37 °C for 20–30 minutes.
5. Measurement with an enzyme-linked immunosorbent meter: the absorbance value was measured at A562 nm with an enzyme-linked immunosorbent meter, using the absorbance value without BSA as the blank control.
6. Drawing of the standard curve: the protein content (μg) was taken as the abscissa and the absorbance value as the ordinate to draw the standard curve.
7. Calculation of the protein content in samples: according to the measured absorbance value, the protein content in the sample can be calculated on the standard curve.
8. Calculation of protein concentration: the measured protein content was divided by the sample volume of 20 μL and multiplied by the corresponding dilution factor to obtain the actual concentration of the sample to be tested.
Assay procedure
First, 40 μL of SERS labels and 20 μL of magnetic beads were re-suspended in incubation buffers containing different concentrations of antigens. The resulting solution was mixed together and incubated for a few minutes. Finally, the mixture was separated with a permanent magnet and washed twice with PBST (TW-20 0.4%) buffer. After separation, 10 μL of PBS solution was added to the mixture, 3 μL of heavy suspension was absorbed for detection, and the SERS signal was obtained.Preparation of clinical serum samples
In order to evaluate the practicability of the SERS sensing platform developed, we collaborated with the First Hospital of Xiamen University to obtain serum from hospital patients. Blood samples were processed within 4 hours of collection according to the hospital's protocol, and final serum samples were collected for study. The serum samples were stored in the refrigerator at −80 °C, and all the tested serum samples were only subjected to one freeze–thaw cycle.Results and discussion
The basic principle of this study was based on double antibody sandwich immunoassay combined with SERS technology, which achieved the advantages of high sensitivity, fast detection speed and strong specificity.18 In this study, IR808, which has a large Raman cross-section and resonates with a 785 nm laser, was selected as a signal molecule to provide positive detection signals.39 The UV-vis absorption spectrum of IR808 is shown in Fig. S1.† The capture antibody modified magnetic beads (MBs) were used as the carrier, and the detection antibody modified gold nanoparticles were used as the sensing probe. MBs with a surface-modified carboxyl group were selected as the trapping substrate, which was easy to collect and concentrate. The surface modified carboxyl group can be activated and coupled to an antibody to prepare antibody coupled magnetic beads MB@Ab. Enrichment of magnetic beads can achieve the purpose of signal collection and amplification. Au NPs had the function of signal enhancement and antibody loading to provide an enhanced IR808 Raman signal for the system and were used to prepare SERS labels Au-IR808@Ab to improve the detection sensitivity. The experimental process is shown in Scheme 1, including incubation, washing, magnetic absorption, detection and other steps. Ultra-fast and sensitive test results were obtained within 10 minutes. | ||
| Scheme 1 Schematic diagram of the PSA biosensor detection process based on SERS. | ||
Fig. 1 shows the sequential process of preparing PSA antibody coupled SERS nanotags and PSA antibody coupled carboxyl magnetic beads for the detection of PSA antigen in serum. As shown in Fig. 1A, the signal molecule IR808 is fixed to the surface of the AuNPs by electrostatic adsorption. The green structure in the upper right corner of Fig. 1E is the IR808 signalling molecule. Because IR808 itself has carboxyl groups, it can directly conjugate with the amino group on the antibody to form peptide bonds. The PSA antibody was fixed to the AuNP surface by 1-ethyl-3-(3-(dimethylamino-propyl)carbodiimide) (EDC)/N-hydroxysuccinimide (NHS) promoting the coupling reaction.40 In this study, carboxylic acid functionalized magnetic beads were used to prepare the trapping substrate, and the magnetic beads were coupled with antibodies through the carboxylic groups on their surface. The magnetic bead surface was activated using EDC and NHS, and then the PSA antibody was fixed to the magnetic bead surface, as shown in Fig. 1B. These PSA antibodies capture the PSA antigen in the serum through an antibody–antigen reaction. Fig. 1D shows a scanning electron microscopy (SEM) image of SERS nanotags, and the small image in its upper right corner is a transmission electron microscope (TEM) image. The diameter is estimated to be 50 ± 5 nm. The particle size increases from 52 nm to 56 nm after the gold nanoparticle binds the signal molecule IR808, and that of AuNPs increases from 56 nm to 64 nm after coupling with the antibody, which indicates that the modification of the signal molecule and antibody is successful, as shown in Fig. S2.† UV-vis measurements also confirmed the size distribution of AuNPs and antibody conjugated SERS nanotags, as shown in Fig. 1C. The stability of Au nanoparticles is due to the double charge of negative ions on the surface. After being modified by signal molecules and antibodies, the particle size of the modified particles changes somewhat due to the certain structural size of the signal molecules and antibodies. As we all know, a certain amount of protein has a good protective effect on stable nanoparticles, and antibodies themselves are proteins. The antibodies have a certain mutual repulsion between the electrical properties, so they can effectively stabilize the particles.30,41–43 Fig. 1C also shows that although the modified particles IR808 and Au-IR808@Ab can still disperse stably in solution, they show an obvious new peak at 700 nm, which may be caused by charge-induced micro clusters of nanoparticles during the modification process. Interestingly, the absorption peak of the particle near 700 nm is close to that of the 785 nm incident laser used in the experiment, and the absorption of the signal molecule IR808 is also very close, which demonstrates the Raman resonance effect. The sensitivity of the detection system is significantly improved.30 After the basic characterization of the synthesized particles, we obtained the Raman signals before and after particle modification. As shown in Fig. 1E, the signal molecule IR808 was successfully modified and showed its unique Raman signal at 555 cm−1.39
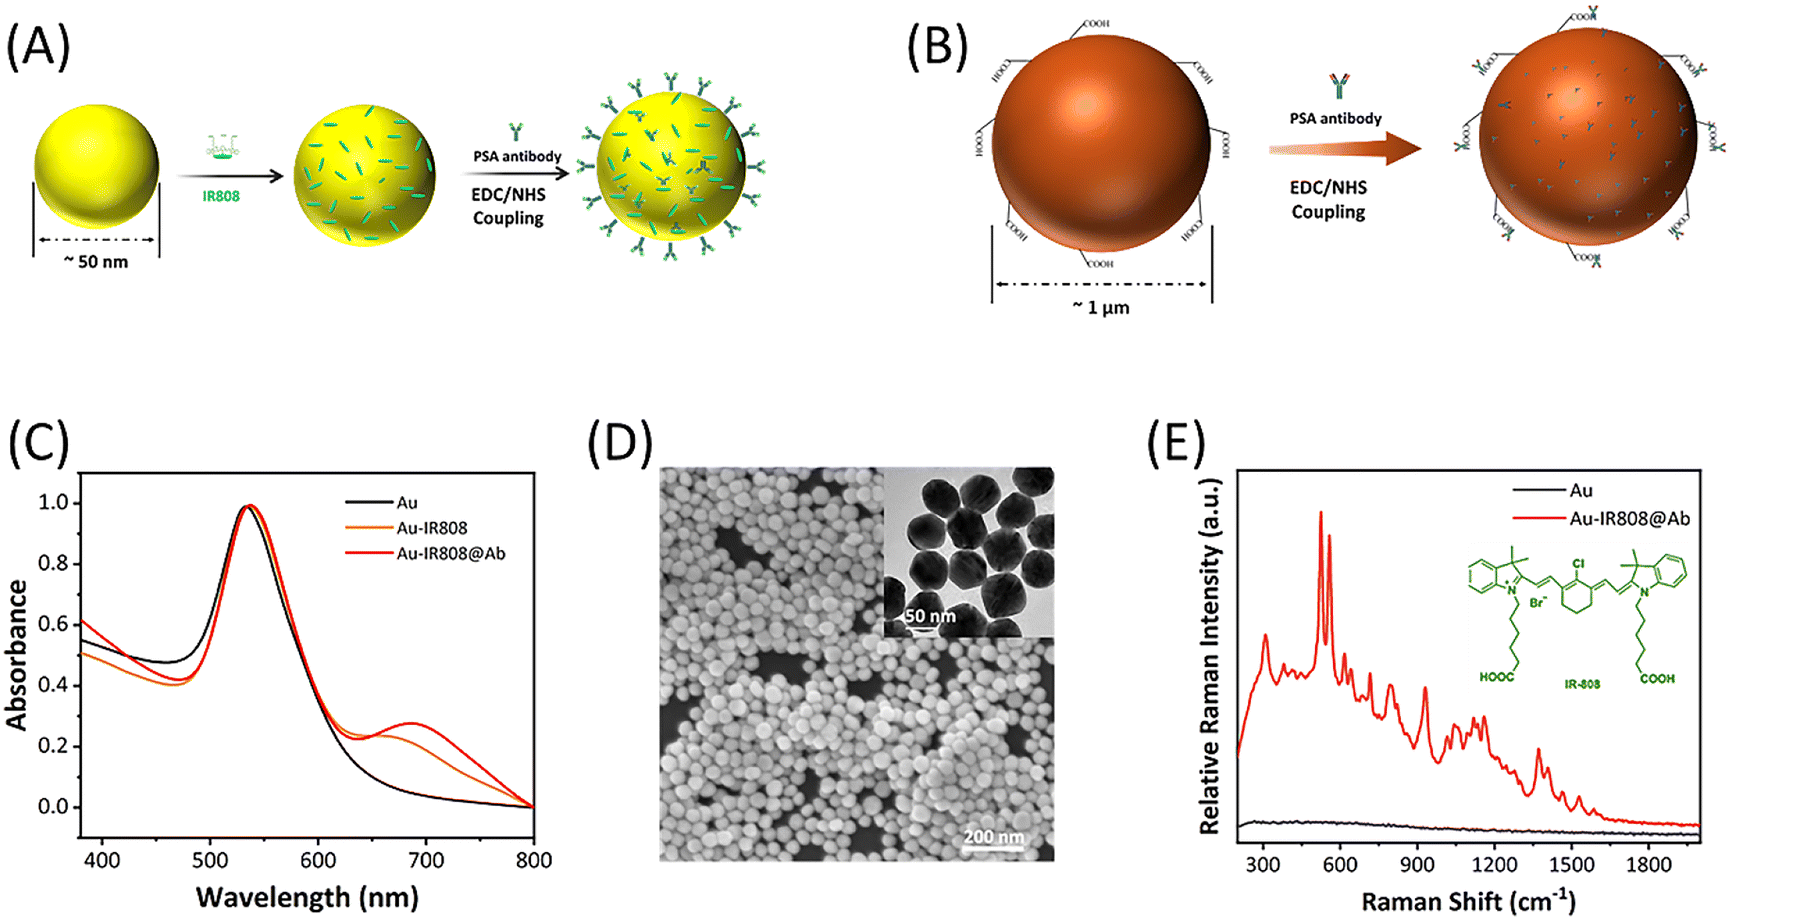 | ||
| Fig. 1 (A) Sequential process for preparing antibody conjugated SERS nanotags. (B) The antibody is coupled to the surface of the magnetic bead. (C) UV-vis spectra of AuNPs (black), Au-IR808 (yellow) and Au-IR808@Ab (red). (D) SEM image of SERS nanotags, and the upper right corner small image is the TEM image. (E) Raman spectra of AuNPs (black) and Au-IR808@Ab (red), with IR808 structural formula in the upper right corner. | ||
In order to obtain better performance of the SERS biosensor detection system, we explored and improved the detection conditions. The experiment explored the amount of signal molecules added, including the concentration of signal molecules and the volume of molecules added. The volume of gold nanoparticles was fixed to 1 mL, other conditions remained unchanged during the particle preparation process, and the added volume of fixed molecules was 4 μL. The concentration of signal molecules was explored, as shown in Fig. 2A. When the concentration of signal molecules was 0.75 mM, the SERS signal particles prepared had the best detection signal. Using the optimal concentration of signal molecules, other conditions remain unchanged, changing the volume of the added signal molecules. The investigation results are shown in Fig. 2B. When the amount of signal molecules added is 4 μL, the signal particles have the best detection performance. It is well known that pH has a large impact on the immune detection system. We need to consider the pH of the test system. The experiment mainly uses specific recognition between antigen and antibody, so the experiment first needs to control the pH value of the solution. Fig. S3† further confirms that the particle detection process of antibody modification with different contents shows the best detection effect in the pH 7.5 environment system. After optimizing the conditions, the subsequent experiments were carried out in this pH system. On the premise of determining the above conditions, we further explored the amount of antibody modification of AuNPs and magnetic beads. The experimental results for AuNPs are shown in Fig. 2D. When other conditions are consistent, the positive signal reaches the maximum strength when the amount of antibody reaches 20 μg mL−1. At this time, further antibodies continue to be added, and the Raman positive signal does not further improve significantly. This indicates that 20 μg mL−1 antibody can already saturate the number of surface modified antibodies of nanoparticles, and further addition of antibodies is ineffective for signal enhancement. The experimental results of antibody modification on the surface of magnetic beads are shown in Fig. 2E. We used 1 mg mL−1 magnetic beads, and the optimal amount of antibody modification was 40 μg mL−1. Therefore, we fixed the amount of gold antibody modification of the signal at 20 μg mL−1 and the amount of magnetic bead modification at 40 μg mL−1 in subsequent experiments to meet our experimental requirements. At 4 °C, the modified antibody probe can maintain signal stability for a minimum of two months, as shown in Fig. S4.† It is well known that the specificity of SERS biosensors is crucial to the whole system. As shown in Fig. 3F, several commonly used antigens were selected for specific detection under the PSA antigen detection system. Bovine serum albumin (BSA), COVID-19 spike protein (S Pro), COVID-19 nucleocapsid protein (N Pro), cardiac troponin T (cTnT), creatine kinase isoenzyme (CKMB), epithelial adhesion molecule (Ep-CAM) and cytokeratin 19 (CK19) 7 groups of analytes comprised the negative control group, PSA was the test group, and female serum was the blank control group. As shown in Fig. 2F, the signal difference between the experimental group and the control group was significant, and the results showed that the antibody had good specificity and no cross-reactivity with the common antigens measured. As shown in Fig. S5,† we investigated the influence of the reaction time of the experiment in the detection system on the detection signal. It can be easily observed from the figure that the signal of the positive sample will gradually increase with the extension of time in a certain time range, and the signal saturation is basically reached at 60 min; continuing to increase the reaction time does not significantly help the signal.
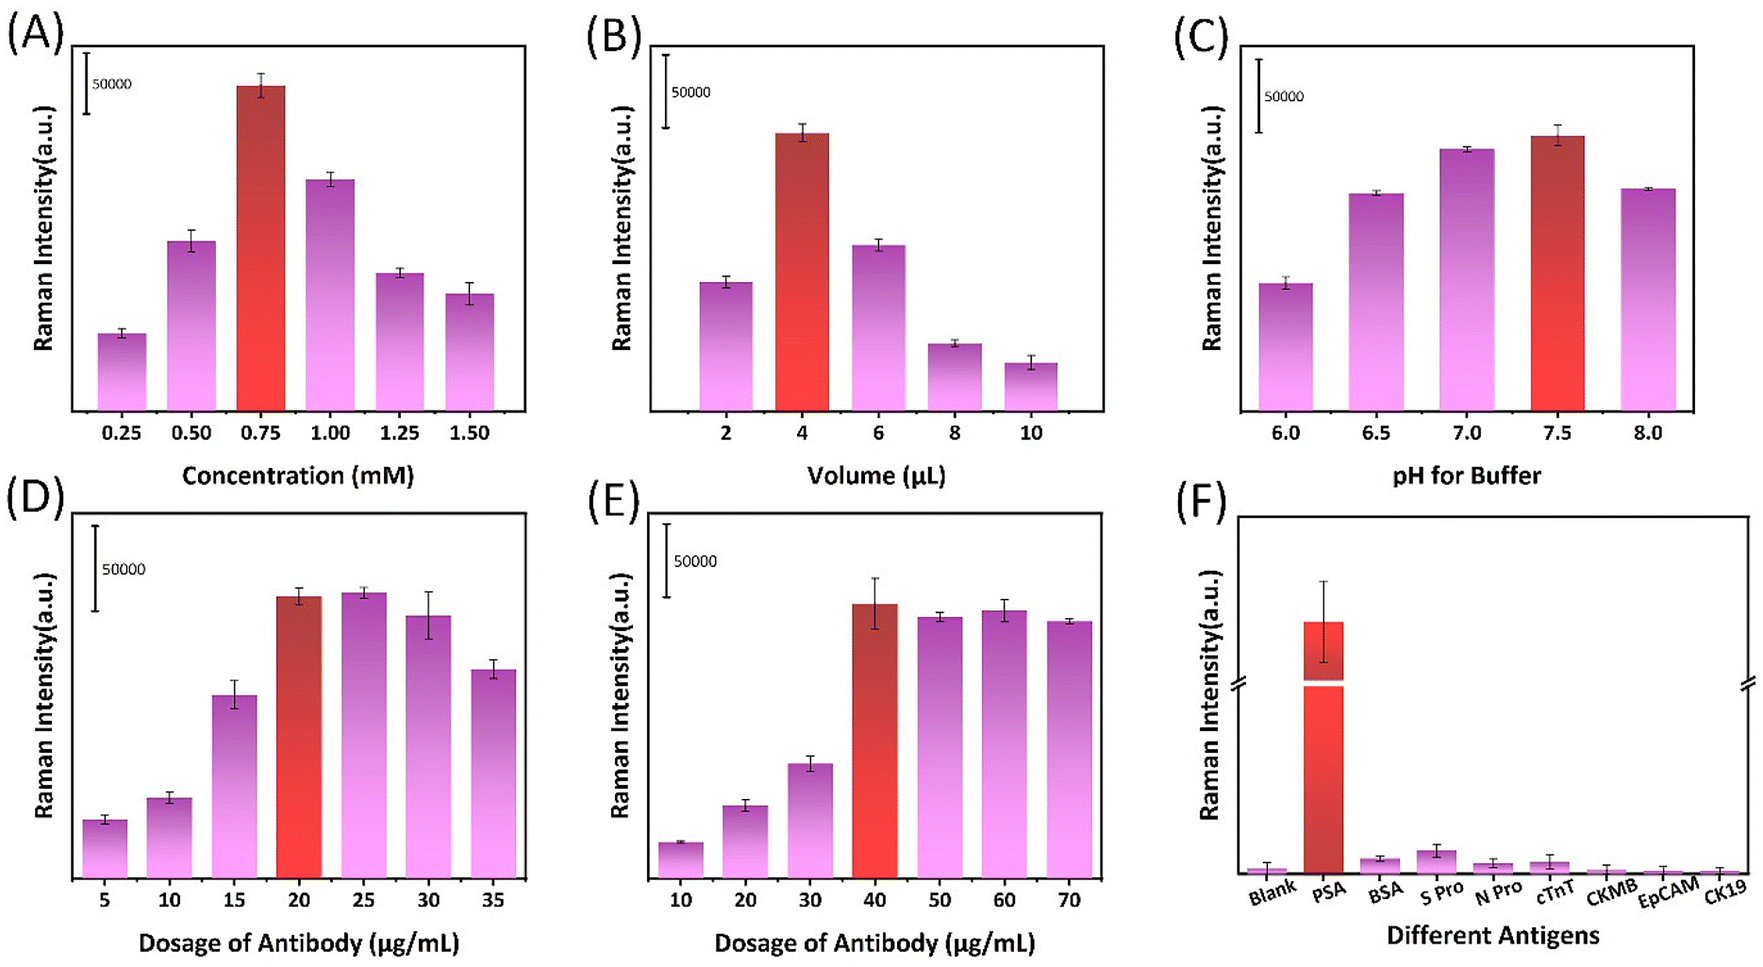 | ||
| Fig. 2 Optimized testing. (A) Influence of signal molecule concentration on detection. (B) Influence of signal molecule dosage on detection. (C) The influence of pH of the detection system on detection, and the PSA target concentration (6 ng mL−1). (D) The influence of the number of gold-modified antibodies on detection. (E) Influence of the amount of magnetic bead modified antibody on detection. (F) Specificity of the test system. The antigen concentration was 6 ng mL−1, and the blank was female serum. The error bar represents the standard deviation of the five measurements. | ||
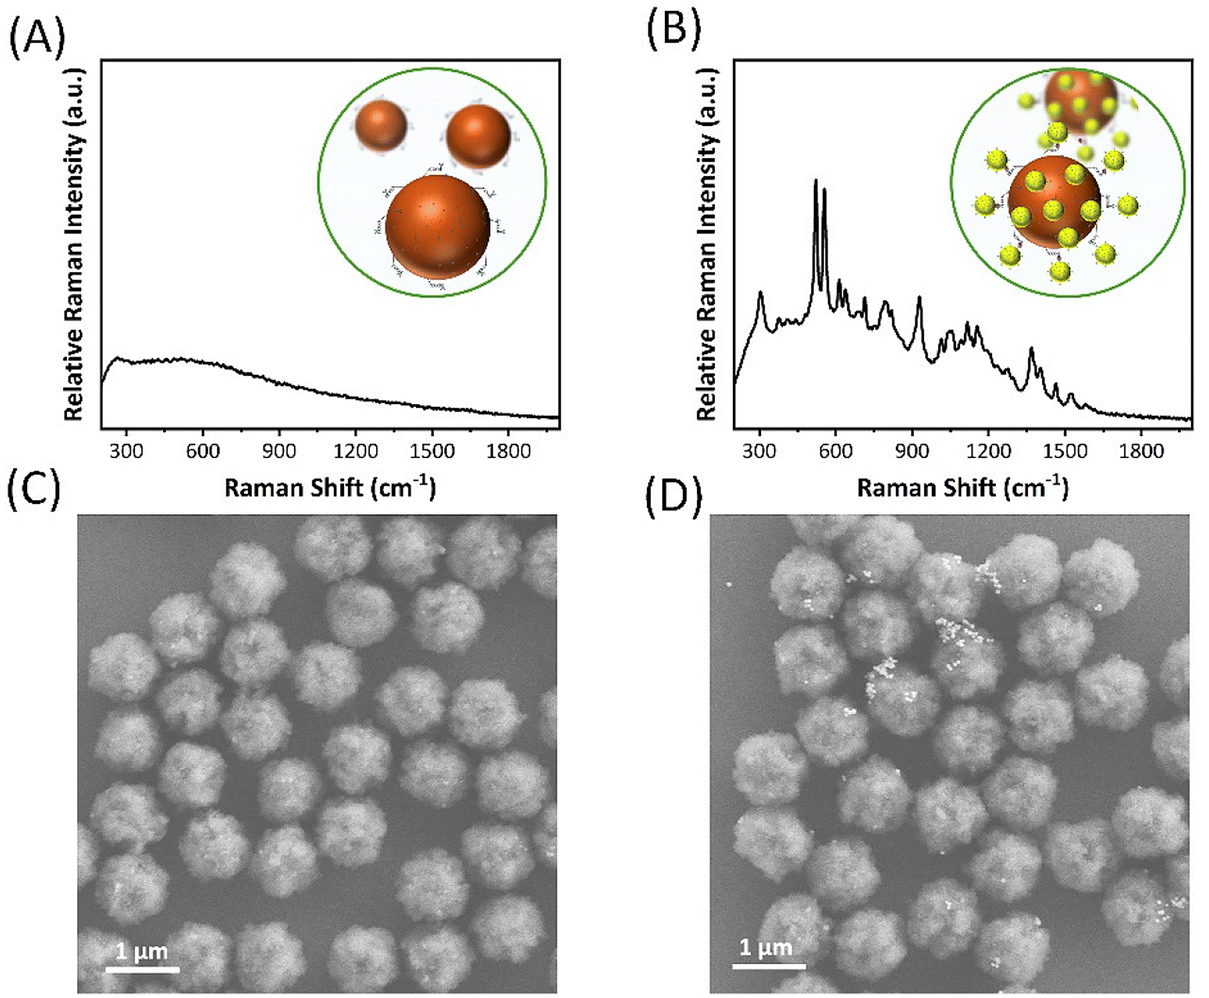 | ||
| Fig. 3 (A) Post-reaction Raman signals in blank samples without PSA. (B) Raman signal after the reaction of a positive sample containing PSA. (C) SEM images of magnetic beads of the magnetic immune complex formed after the reaction of blank samples without PSA. (D) SEM images of magnetic beads forming a magnetic immune complex after the reaction of positive samples containing PSA. | ||
Therefore, in theory, the best detection results can be obtained when the reaction was analysed for an hour. However, considering that the experiment needs to achieve rapid detection while ensuring adequate sensitivity, we determined the incubation time of 8 minutes as the point for subsequent experiments. For more than six times the time effort, the signal strength increased by only three times. Therefore, according to the requirements of our work plan and the performance demonstrated by the experimental results, we chose an incubation time of 8 minutes for the following experiments because it balances the need for rapid detection and sensitivity.
In order to more intuitively observe the impact of the presence or absence of antigens on the detection system, PBS blank samples and clinical serum containing PSA antigen were mixed with antibody-conjugated magnetic beads in microtubules, respectively. The antigen-containing serum is captured on the surface of the magnetic bead by the antibody–antigen reaction, and Au-IR808@Ab particles are added to the sample, respectively, where they form sandwich immune complexes. As shown in Fig. 3A, the blank sample could not bind the signal. The sample containing PSA antigen had an IR808 Raman signature peak, as shown in Fig. 3B. The magnetic immune complex was separated using a magnet to prepare SEM samples for imaging. As shown in Fig. 3C, no PSA antigen is able to bind signal AuNPs, while Fig. 3D contains antigen binding signal gold to form sandwich immune complexes.
After a series of optimization conditions, the experimental detection system was determined. We verified the sensitivity of the system by detecting different concentrations of PSA. The target PSA antigen was diluted step by step with female serum solution, by which process 0–20 ng mL−1 samples were obtained. Five sets of parallel samples were tested for each concentration, and the peak area between the 540 cm−1 peak and the 570 cm−1 peak was calculated. The experimental spectral results are shown in Fig. 4A. The peak area intensity at 540 cm−1 and 570 cm−1 gradually increased with increased PSA antigen addition, and the relationship between the two was linear. As shown in Fig. 4B, the linear simulation equation is Y = 15580X − 333.4 (X = PSA concentration, R2 = 0.9897). (YLOD = μblank + 3σ, where YLOD denotes the LOD in the signal domain, μblank is the expected mean blank value, and σ is the standard deviation of the blank.) The theoretical detection limit of 0.029 ng mL−1 was calculated.
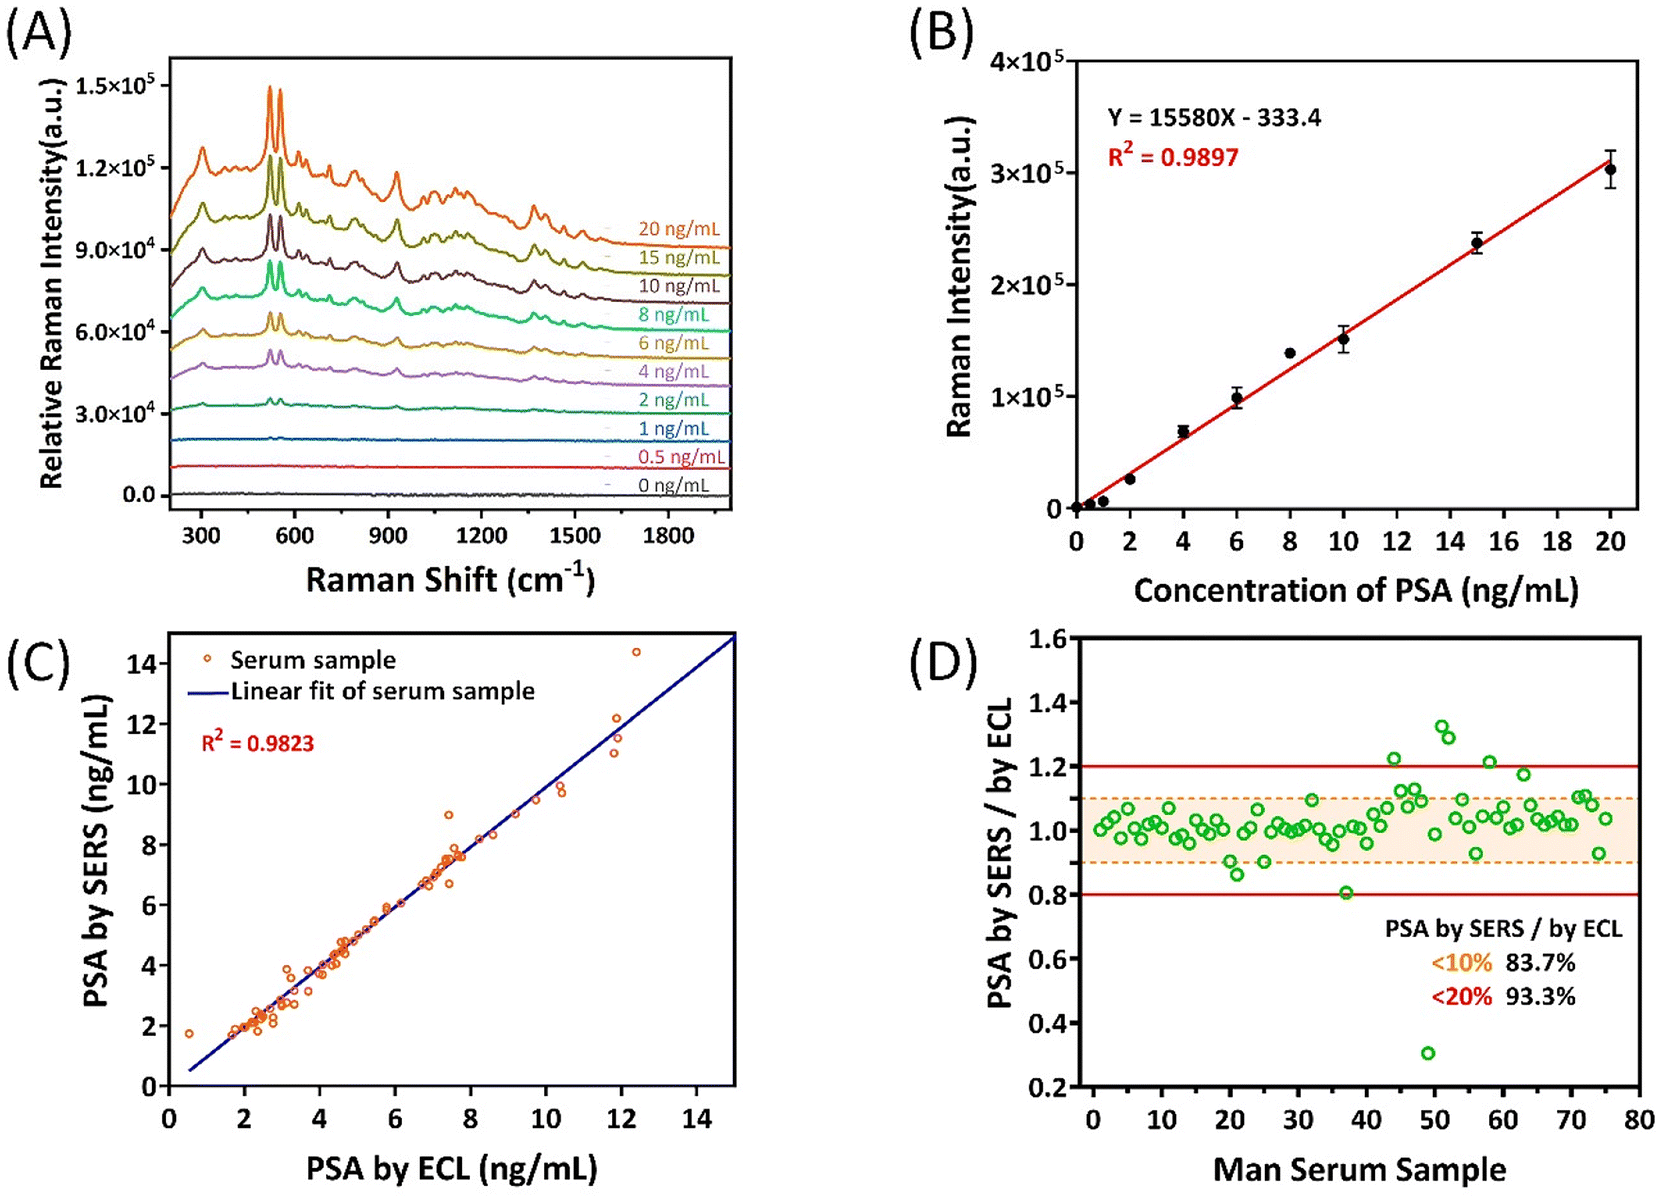 | ||
| Fig. 4 (A) SERS spectrum based on PSA concentration and (B) the corresponding calibration curve. The concentration of PSA in human serum ranges from 0 to 20 ng mL−1. The change of SERS intensity of the 555 cm−1 peak was used for quantitative analysis of PSA. (C) Data analysis was conducted on 75 male serum samples with SERS and ECL, and the comparison charts of serum samples with different PSA target concentrations were used to verify the accuracy of SERS clinical detection. (D) Accuracy analysis of clinical test data. The error bar represents the standard deviation of the five measurements. | ||
Current tests used in hospitals typically take up to two hours to produce results. In contrast, our system can deliver results within 10 minutes, significantly reducing patient waiting times. As a real-time detection method, the efficiency and applicability of clinical detection are very important. Therefore, the detection method designed by us has the advantages of simple operation, short detection time (10 min) and high sensitivity. The clinical reference value of PSA was 4 ng mL−1 and by applying our detection system to actual sample detection, we tested 110 samples from volunteers, thus verifying the accuracy and applicability of the method. The study was approved by the Ethics Committee of Xiamen University. Informed consent was obtained from all patients in accordance with guidelines for conducting clinical studies. Among the 110 serum samples, 35 were from female serum, as shown in Fig. S6.† The content of PSA in female serum is extremely low, and the detection results can exclude the interference of the substance of the serum itself on the experimental results. As shown in Fig. 4C, 75 male clinical samples were respectively detected by our SERS immune method and commercial ECL in the hospital, the latter being the gold standard method in hospitals. By comparing the two assays, the results show good agreement between the two analysis methods, as the data points show a strong linear relationship. Our results found only two cases of bias due to sample concentrations being too close to clinical reference values (4 ng mL−1 and 10 ng mL−1). The accuracy of our assay for these serum samples was 97.3%, R2 = 0.9823. In addition, the test results were statistically processed to analyse the accuracy of each sample. Fig. 4D shows that out of 75 samples, 62 samples have an absolute error value of less than 10% and 70 samples have an absolute error value of less than 20%. The results are 82.67% and 93.33% respectively, indicating that our detection method is accurate in the detection of PSA in actual samples of human serum. Therefore, our research method provides a convenient and rapid method for the accurate detection of PSA targets.
Conclusions
Here, our research successfully developed a sensor based on SERS technology with high sensitivity and accuracy for detecting PSA. By using SERS tags that resonate with a 785 nm laser, we were able to quickly complete the detection in 10 min to meet the detection needs of the hospital. The specific recognition of PSA is achieved through the interaction of antigen and antibody. The optimal sensitivity scheme of the sensor was determined through systematic research and optimization of various parameters of the detection system. Under the conditions of our study, a detection limit of 0.029 ng mL−1 was reached, which was higher than the clinical requirements. The immune SERS platform was used for a clinical study on detecting PSA targets in human serum, which is of great significance for the popularization of early prostate cancer screening in township hospitals across the country because of its simplicity, speed and low equipment requirements. This work not only provides a powerful and sensitive platform for biomarker detection but is also a promising method for early screening of prostate cancer. It also provides a valuable reference for similar research in this field.Author contributions
T. Wang, Y.-J. Zhang and J.-F. Li directed these studies. S.-Y. Fu conducted all the experiments, collated the results, and wrote the first draft. S. S. Xu, H. M. Li, X.-M. Guo, J.-S. Lin, B. Guan, and B. Chen discussed the data and wrote the paper. All the authors reviewed the manuscript.Data availability
The datasets generated for this study are available on request to the corresponding author.The authors confirm that the data supporting the findings of this study are available within the article and/or its ESI.†
Conflicts of interest
The authors declare no conflict of interest.Acknowledgements
This work was supported by the Science and Technology Planning Project of Fujian Province (2023Y0002), and the Raman Medical Collaboration Project of The First Affiliated Hospital of Xiamen University (XFLM2023001).References
- F. Bray, M. Laversanne, H. Sung, J. Ferlay, R. L. Siegel, I. Soerjomataram and A. Jemal, CA-Cancer J. Clin., 2024, 74, 229–263 CrossRef.
- R. L. Siegel, A. N. Giaquinto and A. Jemal, CA-Cancer J. Clin., 2024, 74, 12–49 CrossRef.
- L. C. Trantham, M. E. Nielsen, L. R. Mobley, S. B. Wheeler, W. R. Carpenter and A. K. Biddle, Cancer, 2013, 119, 3523–3530 CrossRef.
- H. Lilja, D. Ulmert and A. J. Vickers, Nat. Rev. Cancer, 2008, 8, 268–278 CrossRef CAS.
- J. J. Fenton, M. S. Weyrich, S. Durbin, Y. Liu, H. Bang and J. Melnikow, J. Am. Med. Assoc., 2018, 319, 1914 CrossRef.
- P. R. Slev, S. L. La'ulu and W. L. Roberts, Am. J. Clin. Pathol., 2008, 129, 952–958 CrossRef CAS PubMed.
- B. Zhang, W. Gao, J. Piao, Y. Xiao, B. Wang, W. Peng, X. Gong, Z. Wang, H. Yang and J. Chang, ACS Appl. Mater. Interfaces, 2018, 10, 14549–14558 CrossRef CAS PubMed.
- X. Li, W. Li, Q. Yang, X. Gong, W. Guo, C. Dong, J. Liu, L. Xuan and J. Chang, ACS Appl. Mater. Interfaces, 2014, 6, 6406–6414 CrossRef CAS.
- A. Miglione, F. Di Nardo, S. Cavalera, T. Serra, C. Baggiani, S. Cinti and L. Anfossi, Anal. Chem., 2024, 96, 2297–2302 CrossRef CAS.
- Q. Zhou, Y. Lin, K. Zhang, M. Li and D. Tang, Biosens. Bioelectron., 2018, 101, 146–152 CrossRef CAS PubMed.
- E. Spain, S. Gilgunn, S. Sharma, K. Adamson, E. Carthy, R. O'Kennedy and R. J. Forster, Biosens. Bioelectron., 2016, 77, 759–766 CrossRef CAS PubMed.
- Y.-Z. Wang, S.-Y. Ji, H.-Y. Xu, W. Zhao, J.-J. Xu and H.-Y. Chen, Anal. Chem., 2018, 90, 3570–3575 CrossRef CAS.
- J. Han, Y. Li, L. Zhan, J. Xue, J. Sun, C. Xiong and Z. Nie, Chem. Commun., 2018, 54, 10726–10729 RSC.
- J. F. Li, Y. F. Huang, Y. Ding, Z. L. Yang, S. B. Li, X. S. Zhou, F. R. Fan, W. Zhang, Z. Y. Zhou, D. Y. Wu, B. Ren, Z. L. Wang and Z. Q. Tian, Nature, 2010, 464, 392–395 CrossRef CAS.
- Y. Ding, H. Shang, X. Wang and L. Chen, Analyst, 2020, 145, 6079–6084 RSC.
- Y. Zhu, Y. Sun, Y. Shi, Y. Ding, C. Liu, F. Yang, F. Chen, Y. Cao and J. Qin, Biosens. Bioelectron., 2023, 242, 115718 CrossRef CAS PubMed.
- D. Cialla-May, X.-S. Zheng, K. Weber and J. Popp, Chem. Soc. Rev., 2017, 46, 3945–3961 RSC.
- C. Zong, M. Xu, L.-J. Xu, T. Wei, X. Ma, X.-S. Zheng, R. Hu and B. Ren, Chem. Rev., 2018, 118, 4946–4980 CrossRef CAS.
- Y. Zhao, A. Kumar and Y. Yang, Chem. Soc. Rev., 2024, 53, 1004–1057 RSC.
- L. Troncoso-Afonso, G. A. Vinnacombe-Willson, C. García-Astrain and L. M. Liz-Márzan, Chem. Soc. Rev., 2024, 53, 5118–5148 RSC.
- X. Bi, J. Wang, B. Xue, C. He, F. Liu, H. Chen, L. L. Lin, B. Dong, B. Li, C. Jin, J. Pan, W. Xue and J. Ye, Cell Rep. Med., 2024, 5, 101579 CrossRef CAS.
- L. Yuan, J. Tatineni, K. M. Mahoney and G. J. Freeman, Trends Immunol., 2021, 42, 209–227 CrossRef CAS.
- T. Hao, X. Wu, L. Xu, L. Liu, W. Ma, H. Kuang and C. Xu, Small, 2017, 13, 1603944 CrossRef.
- A. Ouhibi, A. Raouafi, N. Lorrain, M. Guendouz, N. Raouafi and A. Moadhen, Sens. Actuators, B, 2021, 330, 129352 CrossRef CAS.
- E. Turan, A. Zengin, Z. Suludere, N. Ö. Kalkan and U. Tamer, Talanta, 2022, 237, 122926 CrossRef CAS PubMed.
- J. R. Wang, C. Xia, L. Yang, Y. F. Li, C. M. Li and C. Z. Huang, Anal. Chem., 2020, 92, 4046–4052 CrossRef CAS PubMed.
- J. Zhao, S. Guo, Y. Liu, E. Park, S. Jin, Y. Park, X. Han, B. Zhao and Y. M. Jung, Sens. Actuators, B, 2024, 413, 135865 CrossRef CAS.
- P.-C. Guan, H. Zhang, Z.-Y. Li, S.-S. Xu, M. Sun, X.-M. Tian, Z. Ma, J.-S. Lin, M.-M. Gu, H. Wen, F.-L. Zhang, Y.-J. Zhang, G.-J. Yu, C. Yang, Z.-X. Wang, Y. Song and J.-F. Li, Anal. Chem., 2022, 94, 17795–17802 CrossRef CAS.
- S.-H. Liu, X.-M. Lin, Z.-L. Yang, B.-Y. Wen, F.-L. Zhang, Y.-J. Zhang and J.-F. Li, Talanta, 2022, 245, 123488 CrossRef CAS.
- S. Xu, X.-H. Wu, L. Wu, J.-M. Zhai, S.-J. Li, Y. Kou, W. Peng, Q.-N. Zheng, J.-H. Tian, Y.-J. Zhang and J.-F. Li, Anal. Chem., 2024, 96, 6784–6793 CrossRef CAS PubMed.
- M. Li, S. K. Cushing, J. Zhang, S. Suri, R. Evans, W. P. Petros, L. F. Gibson, D. Ma, Y. Liu and N. Wu, ACS Nano, 2013, 7, 4967–4976 CrossRef CAS PubMed.
- S. Jeong, M.-J. Park, W. Song and H.-S. Kim, Clin. Biochem., 2020, 78, 43–57 CrossRef CAS PubMed.
- Z. Farka, T. Juřík, D. Kovář, L. Trnková and P. Skládal, Chem. Rev., 2017, 117, 9973–10042 CrossRef CAS PubMed.
- X.-R. Bai, L.-H. Wang, J.-Q. Ren, X.-W. Bai, L.-W. Zeng, A.-G. Shen and J.-M. Hu, Anal. Chem., 2019, 91, 2955–2963 CrossRef CAS PubMed.
- Z. Wang, S. Zong, Y. Wang, N. Li, L. Li, J. Lu, Z. Wang, B. Chen and Y. Cui, Nanoscale, 2018, 10, 9053–9062 RSC.
- Y. Wang, Q. Ruan, Z.-C. Lei, S.-C. Lin, Z. Zhu, L. Zhou and C. Yang, Anal. Chem., 2018, 90, 5224–5231 CrossRef CAS PubMed.
- Y. Zhang, B. Chen, M. He, B. Yang, J. Zhang and B. Hu, Anal. Chem., 2014, 86, 8082–8089 CrossRef CAS PubMed.
- G. Frens, Nat. Phys. Sci., 1973, 241, 20–22 CrossRef CAS.
- M.-M. Gu, P.-C. Guan, S.-S. Xu, H.-M. Li, Y.-C. Kou, X.-D. Lin, M. Kathiresan, Y. Song, Y.-J. Zhang, S.-Z. Jin and J.-F. Li, J. Chem. Phys., 2023, 158, 024203 CrossRef CAS PubMed.
- Z. Cheng, N. Choi, R. Wang, S. Lee, K. C. Moon, S.-Y. Yoon, L. Chen and J. Choo, ACS Nano, 2017, 11, 4926–4933 CrossRef CAS PubMed.
- Y. Wang, J. E. Q. Quinsaat, T. Ono, M. Maeki, M. Tokeshi, T. Isono, K. Tajima, T. Satoh, S. Sato, Y. Miura and T. Yamamoto, Nat. Commun., 2020, 11, 6089 CrossRef CAS PubMed.
- S. J. Soenen, W. J. Parak, J. Rejman and B. Manshian, Chem. Rev., 2015, 115, 2109–2135 CrossRef CAS PubMed.
- M. Mahmoudi, I. Lynch, M. R. Ejtehadi, M. P. Monopoli, F. B. Bombelli and S. Laurent, Chem. Rev., 2011, 111, 5610–5637 CrossRef CAS PubMed.
Footnote |
| † Electronic supplementary information (ESI) available. See DOI: https://doi.org/10.1039/d4nr04510f |
| This journal is © The Royal Society of Chemistry 2025 |