 Open Access Article
Monitoring and controlling zeolite synthesis via reactor-based solutions: a fed-batch strategy†
Amirhossein
Javdani
 ,
Gleb
Ivanushkin
 ,
Aron
Deneyer
and
Michiel
Dusselier
 *
*
Center for Sustainable Catalysis and Engineering (CSCE), KU Leuven, 3001 Leuven, Belgium. E-mail: michiel.dusselier@kuleuven.be
First published on 28th November 2024
Abstract
Most conventional zeolite synthesis takes place in closed batch autoclaves that cannot be monitored or controlled during the process. Moreover, the study of time-dependent parameters of the synthesis with the conventional “cooling-opening” procedure not only reduces accuracy as a series of reactors (never 100% identical) needs to be started in parallel (and stopped at different times), it is also labor intense. Furthermore, the classic batch concept does not permit the intermediate addition of species without disrupting synthesis and the cooling-reheating effects. In this study, we developed a technique for zeolite synthesis monitoring in one-pot experiments using the sampling feature of fed-batch (FB) reactors. These one-pot syntheses can save time and ingredients instead of performing plenty of classic batch experiments. In addition, we could control and manipulate the zeolite synthesis by using the feeding function of the FB reactor and the intermediate addition of precursors at operational temperatures and pressures. Stannosilicate and zincosilicate syntheses were carried out via the FB reactor to investigate the intermediate timed-addition and the possibility of optimizing feeding rates of heteroatoms opposed to a classic synthesis, which faces challenges when a high amount of heteroatom precursor presents at the start. Finally, a modified FB platform was further developed to be able to monitor essential kinetic and synthetic parameters on-line (T, P, and also pH) on-line without intervention. For instance, pH profiles can allow one to estimate key events in zeolite synthesis, but in the art, these profiles are always measured ex situ (including cooling effects etc.).
Introduction
Zeolites are porous materials widely used in many industrial applications such as catalysis, ion exchange, and adsorption. Generally, their crystalline structure is composed of silicon and aluminum oxide moieties. Approximately 99% of academic literature describes zeolite syntheses which occur in classic batch reactors (stainless steel autoclaves with Teflon-made liners).1 The operational parameters (temperature and autogenous pressure) are typically guesswork in these classic batch zeolite syntheses. In the zeolite literature, the discontinuous addition of ingredients or sampling is common (i.e., cooling, handling, reheating), but this contributes to a loss of control as abrupt temperature profiles drastically alter solubility (e.g., nucleation). Hence, there is a need to develop reactors and methods to gain access to the zeolite formation during synthesis (at working T and P), monitor it, and even manipulate it to obtain particular properties or solve phase selectivity issues.Recently, the continuous mode for zeolite synthesis in tubular reactors has gained attention due to improved heat and mass transfer and potential time savings in continuous work.2–8 Continuous flow synthesis can overcome the drawbacks of classic batch synthesis in terms of low energy efficiency since it benefits from an ultrafast heating system and has some advantages, such as controllable flow patterns and projected ease of scaling up.9 While process parameters, such as reaction temperature and residence time, in the flow reactor can be measured, the primary goal is the ultrafast synthesis of zeolites, typically within minutes or even seconds. Very few semi-continuous (and semi-batch) studies have also been reported that focus on studying crystallization through continuous feeding of ingredients and semi-continuous sample extraction.10–13 Still, critical on-line information about zeolite formation (such as temperature, pressure, and pH) was lacking due to insufficient monitoring. Moreover, the concept of intermediate (timed) addition at temperature and pressure has not been addressed in the literature despite its significant potential to enhance zeolite synthesis. While existing reactor-based studies provided insights into synthesis mechanisms and faster (continuous) synthesis, they do not often end up with unique zeolite products (e.g., heteroatom ratios). Here, we propose a conceptual reactor design for zeolite synthesis featuring sample extraction and intermediate addition (fed-batch reactor). It could be an interesting platform that, to our knowledge, has been studied sparsely in zeolite science. The ability to add and extract along the way of a synthesis (feeding and sampling) makes this type of reactor very attractive for controlled-medium synthesis. Samples could be extracted without thermal cooling disturbance, which is not feasible with the classic methods. Hence, this concept would be beneficial for understanding and monitoring the intermediate events (steps, stages) in zeolite synthesis. Furthermore, the time-controlled feeding feature of the fed-batch (FB) reactor allows to add species while syntheses are at temperature and pressure, potentially leading to novel zeolite compositions.
Based on the classic engineering concept of the FB reactor, we have developed an active tool that facilitates synthetic fine-control and a better understanding of temporal effects in zeolite formation by monitoring and sampling options. Temperature and pressure logging, on-line/off-line pH measurements, and yield extrapolation were used to time-map a synthesis. Sample extraction at operational temperature and pressure along the synthesis could provide a more accurate picture of growing structures. This precise picture of zeolite formation would make a FB reactor more efficient than conventional batch systems and will lead to a better understanding of unknown interactions and gradients that could determine zeolite synthesis kinetics. Although zeolites are considered one of the most complex crystallization systems, it is accepted that a changing precursor assembly would have practical impacts on pathways of crystal growth and phase selection.14 There have been many attempts by optimizing precursors, concentrations, and other synthetic factors initially (at the start of a batch reaction), but what is missing here is the ability to manipulate the zeolite assembly during its synthesis. Due to the nature of batch reactors, the interactions of specific compounds or mid-synthesis concentration changes cannot be accessed directly. Accessing this is the primary idea of using FB reactors, i.e., to directly impact concentration profiles by a timed and gradual ingredient feeding (such as heteroatoms, silica and alumina source, or organic structure-directing agents) during synthesis.
Heteroatom (other than Si and/or Al: e.g., Sn, Ti, Zn…) incorporation into the zeolite framework has become a significant strategy to improve their performance in catalysis and adsorption.15–19 Heteroatom-containing zeolites can be obtained by classic bottom-up synthesis or by top-down post-treatments. In the bottom-up approach, the existence of a high amount of heteroatom precursor at the start could heavily interfere with the critical synthesis events and hinder nucleation.19,20 Therefore, performing the intermediate addition via the FB reactor could affect crystallization in different ways and, here, we investigate practical examples of stannosilicate and zincosilicate zeolite syntheses. Our hypothesis is that the timed-addition of heteroatoms through the feeding option of the FB could minimize the interference with the nucleation step and allow for unique concentration control during the growth stage. Additionally, with the time-mapping of synthesis in hand, it would be possible to determine the optimum feeding period for the FB platform. Our aim is to provide a practical demonstration of the feeding option of the FB reactor as well as the monitoring capabilities in zeolite synthesis. Based on the knowledge gained, a reactor design was also developed to facilitate the on-line monitoring of kinetic and synthetic parameters (T, P, and pH) and enable time-mapping without sample extraction.
Results and discussion
Reactor design and practicalities surrounding its sampling and feeding
Zeolite synthesis was conducted in a custom-made FB set-up (180 ml) with Teflon interiors and feeding/sampling tubes. The reactor body (BR-300 of Berghof) consists of a lid made of stainless steel 316 Ti with PTFE liner, a vessel made of stainless steel 316 Ti with the possibility of inserting a Teflon cup, and a heating jacket is used in the construction. It is possible to take samples during synthesis through a liquid sampling PTFE dip tube. Additionally, ingredients can be added during synthesis via a PTFE tube situated above the synthesis medium. Limited blockage and stable low feeding rates (minimum 20 μl min−1) are key features of the peristaltic pump (SF-10 reagent pump by Vapourtec) for the addition of different types of solutions (such as suspensions or viscous solutions) while operating at temperature and under pressure (<10 bar). Taking into account feeding and sampling, the operating volume of the fed-batch reactor varies (from 50 to 140 ml). The lower limit guarantees efficient agitation (PTFE shaft stirring) and correct measurement of the actual temperature. The upper limit guarantees a safe working environment and that adding droplets of ingredients is always from above (instead of in) the synthesis medium. Temperature (T) and pressure (P) are constantly logged via sensors inside the synthesis medium. Here, profiles can be immediately plotted through a connection between the software on the PC and the reactor controller (BTC-3000 temperature controller and data logger of Berghof). The technical scheme and set-up pictures of the FB platform are shown in Fig. 1.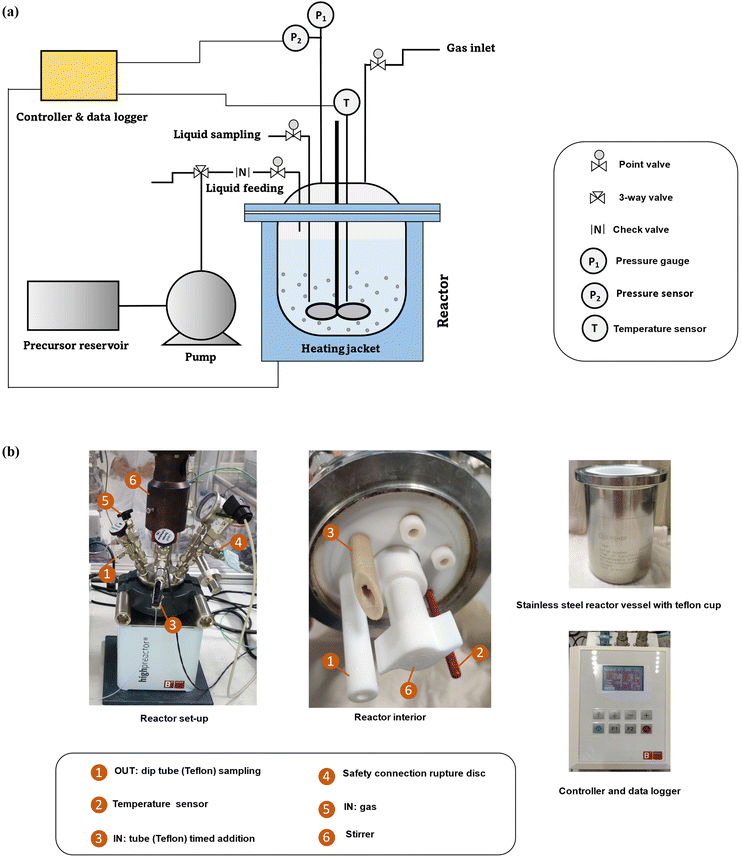 | ||
| Fig. 1 (a) The technical scheme of FB set-up and (b) pictures of the interior and different parts of set-up. | ||
Sudden fluctuations in temperature could have adverse effects on zeolite formation. Thus, it is essential to adjust the reactor's PID (proportional–integral–derivative) parameters for each experiment based on the operating temperature. For example, in experiments at 90 °C, the optimized values are 3–125–250 (for P–I–D, respectively) due to less temperature fluctuations, as shown in Fig. S1.† On average, the reactor takes 45 minutes time to reach 90 °C, while for 160 °C, it takes 1 hour. The heating rate could be changed, but there is a trade-off between a faster heating rate and higher temperature fluctuations.
It is possible to take samples during synthesis without cooling the reactor and to use them for elemental analysis, PXRD, SEM, et cetera. However, there are certain empirical rules we found important during the sampling process:
1) To ensure the homogeneity of the mixture inside, the stirring rate should be increased prior to extraction time.
2) Before each sampling time, the remaining species (from the previous sample) inside the sampling tube should be extracted and discarded.
3) The minimum sample size required for further analysis (PXRD, yield calculation, pH measurement) is 2 ml, but it may vary depending on the total synthesis yield and liquid viscosity.
4) The volume of total samples should not exceed about 20% of the total synthesis mixture volume. During zeolite formation, it is crucial to minimize interference to avoid impacting the entire synthesis process. Taking more additional samples could increase the margin of error and result in less reliable outcomes.
5) The sampling procedure should be completed within a short time, preferably less than 30 seconds, and the sampling valve should not remain open for an extended period to prevent temperature drop or sudden pressure release.
6) During low operational pressures, sampling does not affect the pressure inside. However, under high operational pressures, a pressure drop could occur during the sampling procedure. In such cases, low-pressure N2 can be inserted into the reactor to maintain pressure and counteract the pressure drop.
For the feeding procedure, extra time should be considered to completely fill the dead volume (∼2 ml, flowrate × time) in the channels with a higher flowrate, and then switch to the working feeding rate before releasing the first drops into the mixture. The precise timing for the timed-addition procedure is particularly crucial. Moreover, diluted solutions are favorable for the fed-batch approach. After every experiment, the pump tubes and all reactor parts, especially the feeding tube, should be thoroughly cleaned with Milli-Q water to prevent any probable accumulation of species. In addition to blocking the feeding tube, accumulated species could also reduce the accuracy of the results.
Time-mapping of zeolite synthesis: monitoring and sampling
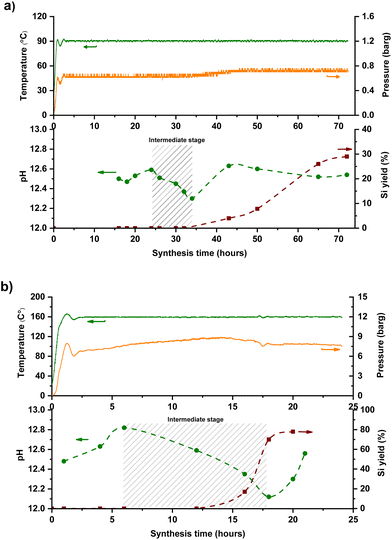
Even though the main idea behind the FB concept is the ability to facilitate the intermediate addition of target ingredients, it's not possible to utilize a “timed-control feeding” without having an accurate time-map of zeolite formation. This precise map would help differentiate critical steps of zeolite formation and identify the specific period or point at which intermediate addition could occur. Time-mapping of one-pot synthesis (‘one-pot’ as a term is used, opposed to starting, e.g., 5 different batch reactors and stopping them at different times) is possible in the FB platform through temperature and pressure logs, ex situ pH measurements, and yield extrapolation. Silicalite-1 (MFI topology) was used as a model synthesis system and time-mapped at 90 °C and 160 °C, monitoring of its crystallization is shown in Fig. 2. Minor temperature fluctuations could be visualized for both temperature profiles, corresponding to ±5% precision of the set temperature. The pressure inside the reactor was in line with the temperature, corresponding to the autogenous pressure of water at that temperature (T and P profiles in the top parts of Fig. 2a and b).The yield curve of MFI synthesis, which utilizes the sampling feature of FB, is consistent with similar ones that used classic batch synthesis.19,21 FB thus allows for one experiment to be performed instead of several discrete classic batches, saving time and ingredients as well as giving (likely) more reliable results since samples are extracted from a single batch. It's an efficient way to build crystallization S-curves22 from one-pot synthesis without interference, enabling us to investigate the zeolite evaluation and distinguish between different stages of zeolite formation. As depicted in the bottom parts of Fig. 2(a and b), the pH in the samples (ex situ) follows the yield curve meaningfully: it gradually decreases and then increases again with yield improvement. This trend has been addressed to phase transformations from the amorphous phase to the crystalline phase.
Silica species act as an acid in the highly alkaline synthesis mixture, neutralizing much of the strong base OH− (Scheme 1). During the intermediate stage, silica molecules are hydrolyzed, and hydroxyl groups are formed (Si–OH), while free OH− anions are consumed.23,24 Therefore, the pH decreases during the transition from amorphous to the intermediate phase, then rises again after transferring from the intermediate phase to the crystalline phase (expulsion of OH−). Interestingly, no apparent kinetic disturbance or temperature drop (as shown in Fig. 2) occurred during sampling (which is fast), which makes this method unique because crucial information could be extracted from one batch without the conventional cooling-opening procedure.
 | ||
| Scheme 1 Different stages of phase transformation from the amorphous phase to the crystalline phase. | ||
Timed-addition approach in FB platform
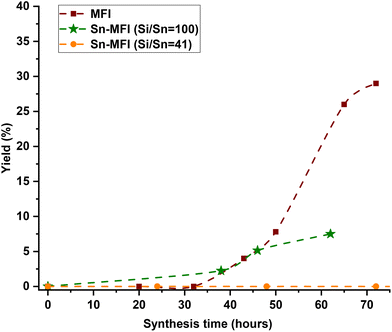
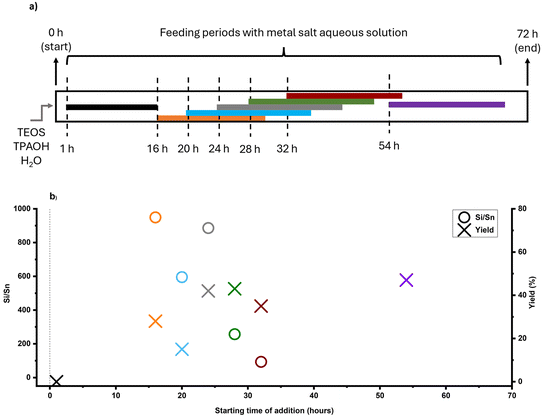
Mapping helps understanding a particular synthesis and the timing of its key events. On top of that, a FB reactor would be able to impact local concentrations of key ingredients at key events (or before) through the timed-addition of heteroatoms, silica, or even organics and alkali. Here, we explore the FB approach for the heteroatom aspect of two heteroatom feeding cases: Sn and Zn.FB strategy allows for the timed-addition of desired metal before or after critical synthesis events. As mentioned earlier, time-mapping of zeolite formation, through sampling and monitoring features of FB, would help us to identify these synthesis events. With a kinetic profile in hand, this targeted dosing of a heteroatom could prevent such a delay in nucleation. In addition to timing, feeding rate is another key parameter in the FB platform that allows control over local concentrations of species through different release modes (e.g., burst or slow-release). As a tin precursor, tin chloride pentahydrate (SnCl4·5H2O) was used since it is easily soluble in water and (more) stable (see section 4 in the ESI† for other precursor trials). As other sources of tin are not readily soluble in water and FB feeding procedures have limitations, a dilute solution is preferred. The water solubility of other tin sources (such as tin acetate) increases with heating, and there is a risk of tin oxide (Sn(OH)x and SnO2) being produced in the initial feeding mixture. As indicated in Fig. 4a, the aqueous solution of the selected tin precursor was added at a slow-feeding rate of 20 μl min−1 in different time intervals, providing a better understanding of the timed-addition process.
The feeding times were selected based on the time-mapping for MFI synthesis at 90 °C, and the amount of added tin was equaled to Si/Sn: 41 at the end of a feeding process (for more precise characteristics – see section 2.3 in the ESI†). As shown in Fig. 2a, the first crystalline material with MFI topology was collected after 32 hours of synthesis. Moreover, the intermediate stage occurred approximately after 25 hours of synthesis and lasted about 10 hours, so appearance of high tin concentrations at this period (25–35 h) can prolong synthesis. In the case, when the feeding was started from the initial moment of synthesis (1 h), there was no crystalline product as expected due to the heavy interference of crystallization due to the early presence of tin metal ions along with the nucleation. However, in the other experiments, tin concentrations were kept low during the intermediate period, and MFI structures were obtained. PXRD patterns of these samples (Fig. S2†) show typical diffraction characteristics for MFI structures and no peaks related to extra-framework tin oxide clusters were detected (although presence of sub-nano clusters is still possible). Fig. 4b shows the final Si/Sn ratios and yields of Sn-MFI experiments based on addition time differences. Adding tin precursor at different times either led to interfering, synergetic, or ignoring behavior: in early periods (addition at 16 h or 20 h), tin species interfered, likely with nuclei formation and crystal growth, and reduced yields below 20%, while addition near the intermediate stage (addition at 28 h and 32 h) minimized this interference and resulted in lower Si/Sn ratio. On the contrary, addition at 24 h (onset of the intermediate stage) resulted in a high Si/Sn ratio and a high yield. It can be concluded that the formation of nuclei would not be affected because the yield is high, although the tin species were neglected. Furthermore, adding after the intermediate stage leads to a complete disregard of tin species since crystals had already formed, preventing tin species from being incorporated and causing them to be ignored. Fig. S3a† shows the theoretical concentration of tin species inside the FB reactor based on synthesis time. A gradual increase in tin concentration during the intermediate stage results in a lower Sn/Si ratio and more cooperative behavior. Thus, keeping tin concentration low during the intermediate stage would be necessary. The crucial impact of tin concentration profiles on stannosilicate zeolite crystallization was also noted by our group (Ivanushkin and Dusselier).19 They showcased increased tin incorporation in zeolites by keeping tin concentration low during the nucleation stage, while the heteroatom was dosed and timed (e.g., amount and time of addition) by the novel electro-assisted synthesis (EAS) approach, based on metal release by anodic oxidation.17,19
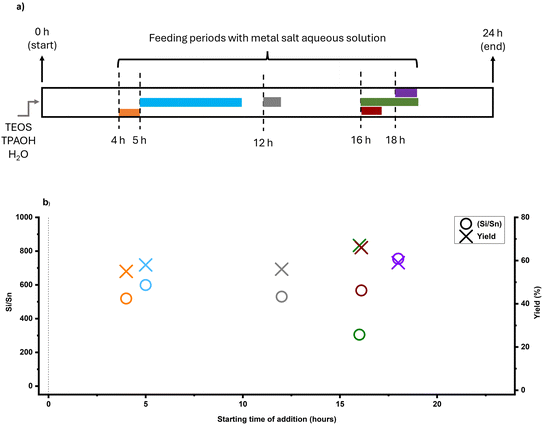
Feeding rate (e.g., feeding duration for a set Si/Sn target) and operational temperature are also important variables. For comparison, Sn-MFI samples were synthesized at 160 °C in a separate set of experiments. With such a high temperature, low feeding rates and long feeding durations gave rise to the formation of tin oxide in the feed lines (i.e., caused blockages, Fig. S10†), so here we had to approach higher feeding rates (e.g., 60–310 μl min−1) and shorted total feeding durations (e.g., 1–5 h). As shown in Fig. 2b, time-mapping of MFI synthesis was developed at an elevated temperature, and different stages of synthesis could be distinguished based on the previously described trend. The intermediate stage, which occurred earlier due to the higher temperature than for the 90 °C experiment, roughly began after 6 hours of synthesis and lasted up to the 16 hour based on time-mapping. Regardless of addition time, pumping the tin solution to the synthesis media led to crystalline MFI zeolites after 24 hours due to the high synthesis temperature (Fig. 5a). As a result, utilizing higher temperatures could eliminate the hindering effect of high concentrations of tin species during the nucleation phase. Fig. 5a shows the timed-addition procedure for 160 °C experiments on the FB platform, utilizing different combinations of feeding rate and starting addition time based on the time-mapping of synthesis.
Fig. 5b shows the final Si/Sn ratios and yields of Sn-MFI high temperature experiments based on addition time. With a fixed feeding duration of 1 hour (feeding rate: 310 μl min−1), adding tin species at different times, either before or during the intermediate stage, did not significantly affect the Si/Sn ratio. However, there was a slight increase in yield when tin species were added after 16 hours of synthesis. It was previously demonstrated (at 90 °C experiments) that maintaining a low tin concentration during the intermediate stage is crucial in the timed-addition procedure, while the feeding rate also plays a significant role. Using a low feeding rate (79 μl min−1) and maintaining a low tin concentration during the intermediate stage resulted in the lowest (for high-temperature experiments) Si/Sn ratio (Si/Sn: 335).
A summary of all the experiments can be seen in Table S1.† The results showed neither timing nor feeding rate significantly affected surface area and microporous volume, while only synthesis conditions (temperature and time) affected textural properties. As shown in Fig. S4,† nitrogen physisorption isotherms of all samples exhibit a highly microporous property as indicated by a type I isotherm. In 90 °C experiments, the high values for surface area are in good agreement with the reported values for nano-sized tin-containing MFI zeolites.29 Likely this is due to the low synthesis temperature, which is favorable to produce nano-zeolites.29,30 This is consistent with the SEM images of the 90 °C experiment (Fig. S7†). Nano-sized spherical shapes are found in these samples, whereas micro-sized coffin shapes are found in 160 °C samples (Fig. S8†). Some samples exhibited high levels of aggregation relative to other samples, which could result in the formation of intraparticle voids in the materials. These materials showed more nitrogen adsorption in the micropore region (P/P0 < 0.2), which exhibits small hysteresis in N2 physisorption graphs.
As a benchmark, Sn-MFI zeolites were prepared in classic batch conditions (described in ESI;† synthesis conditions: (a) 90 °C, 216 hours; (b) 160 °C, 24 hours). At 90 °C, the FB platform demonstrated greater efficiency than the batch reactor, resulting in higher yield, lower Si/Sn ratio (i.e., higher Sn content), and shorter synthesis time of Sn-MFI zeolites (Table S1†). However, the batch reactor performed better at a higher temperature (160 °C), achieving a lower bulk Si/Sn ratio than the FB platform, albeit with a lower synthesis yield. It was previously noted that elevated synthesis temperatures could mitigate the impact of high tin concentration on the conventional synthesis of Sn-MFI zeolite.
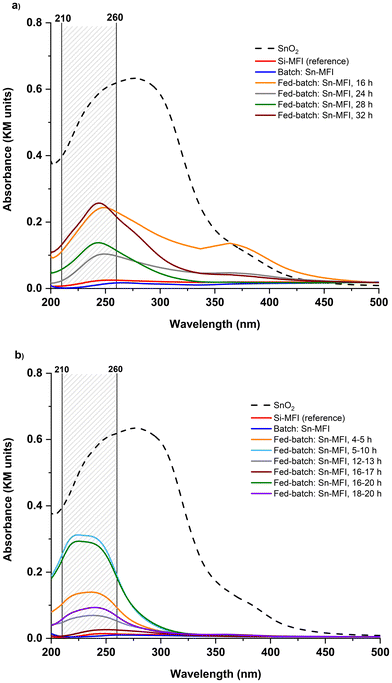
The SnOx species can exist in either tetrahedral coordination in the zeolite framework or as extra-framework tin species typically referred as tin oxides (SnO2).29,30 UV-vis analysis was used to determine the nature of the tin species in zeolites. Incorporated tin species within the structure show a peak at 200 nm. In comparison, the extra-framework SnO2 species can give rise to a peak around 210–260 nm in such UV-vis spectra, as shown in Fig. 6. In 90 °C experiments, Sn-MFI synthesized in the conventional batch mode showed a peak near 200, suggesting an appearance of tetra-coordinated Sn; while Sn-MFI samples in FB contained predominantly extra-framework tin species. In 160 °C experiments, the batch Sn-MFI showed alike behavior, while FB samples synthesized at 160 °C showed different patterns in UV-vis analysis due to different feeding durations. It was observed in 90 °C experiments that using a low feeding rate of 20 μl min−1 would increase the possibility of having extra-framework SnO2 in zeolites. In contrast, higher feeding rates in 160 °C experiments resulted in reduced amount of extra-framework tin oxides as shown in Fig. 6b. For example, the adsorption band assigned to extra-framework tin species was decreased as the feeding rate increased from 79 μl min−1 [fed-batch: 16–20 h] to 310 μl min−1 [fed-batch: 16–17 h] at 160 °C.
Remarkably, all FB samples showed the adsorption band assigned to extra-framework tin species. While the formation of oxides is inevitable even under alkaline conditions, as a remediation, optimizing the feeding rate may keep it suppressed and/or well dispersed within the zeolite phase (if required). Furthermore, comparing two non-conventional platforms, i.e., FB and EAS, the outstanding difference expressed in the incorporation efficiency of the heteroatom can be noticed. Although both methods postulate time-resolved metal addition, within the Sn case, only EAS leads to a high and effective (framework) tin incorporation (e.g., up to bulk Si/Sn 35 and 14, for Sn-MFI and Sn-BEA, respectively; confirmed by UV-vis, FT-IR, and TEM-EDS analyses).17,19 This could be attributed to the different nature and/or lifetime of metallic species utilized in the FB or EAS platforms: aqueous solutions of salts are chosen as a feeding source in the FB, while the EAS system utilizes in situ anodic oxidation of a metal electrode material.
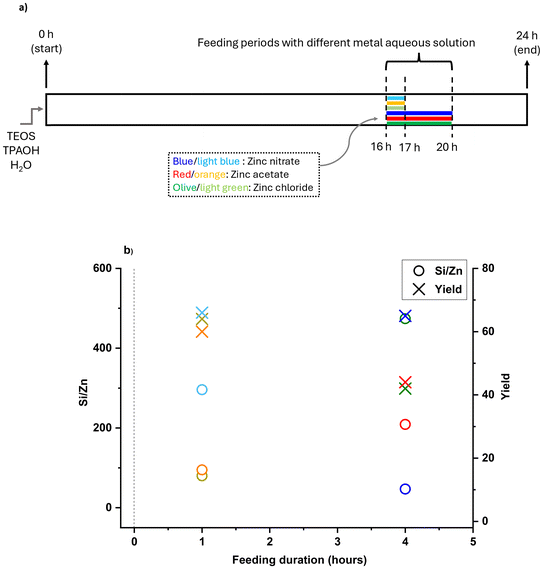
As shown in Fig. 7a, metal species were added after 16 hours of synthesis at feeding rates of 79 and 310 μl min−1, resulting in 4 and 1 hours of feeding, respectively. Additionally, we used different zinc sources (zinc nitrate, acetate, and chloride) compatible with the FB platform to investigate the effect of different soluble sources on incorporation. As shown in Fig. S5,† all zeolites exhibited characteristic MFI peaks regardless of the zinc addition method and no peaks related to extra-framework zinc oxide (ZnO) clusters were detected (although the presence of sub-nano clusters is still possible as similar to Showcase A). Fig. 7b shows the final Si/Zn ratios and yields of Zn-MFI experiments based on feeding duration and the chosen precursor, which substantially impacts the timed-addition approach. The FB feeding of zinc demonstrated better performance than tin in this regard, and some Zn-MFI zeolites gained a bulk Si/Zn ratio below 100 based on ICP results. Furthermore, feeding duration plays a crucial role, as a single metal source can behave differently under different feeding durations. When zinc nitrate was added within 1 hour, the Si/Zn ratio was 459 and yield was around 60%, but when added in 4 hours, the Si/Zn ratio dropped to 47 with the same yield. However, different behavior was observed with other zinc sources such as zinc acetate and zinc chloride. Adding these sources within 1 hour resulted in a Si/Zn ratio of around 80 and a yield of around 60%, whereas a slower feeding rate and longer feeding duration (4 hours) led to a higher Si/Zn ratio (more than 200) and lower yield (around 40%).
As indicated in Table S1,† the feeding duration did not have a significant impact on the microporous volume of zeolites. However, certain zinc-containing samples (fed-batch: Zn-MFI, 16–20 h, zinc acetate and fed-batch: Zn-MFI, 16–20 h, zinc chloride) exhibited a lower external surface area compared to others. Nitrogen physisorption isotherms of all samples exhibit a highly microporous property as indicated by a type I isotherm (Fig. S6†). SEM images (Fig. S9†) of Zn-MFI samples show uniform micro-sized coffin shapes with a low degree of aggregation. It resembles the 160 °C Sn-MFI samples in the previous section and indicates that adding these different metals does not alter the morphology of MFI zeolites, regardless of the addition time or feeding duration.
Zn-MFI zeolites were also prepared in classic batch conditions (described in ESI;† synthesis condition: 160 °C, 24 hours) for a better comparison. As expected, at 160 °C, batch samples had a lower Si/Zn ratio and slightly lower yield than the FB samples (Table S1†). It should be noted that different zinc sources strongly affect the amount of zinc species in FB samples, while batch samples showed similar zinc contents regardless of zinc source.
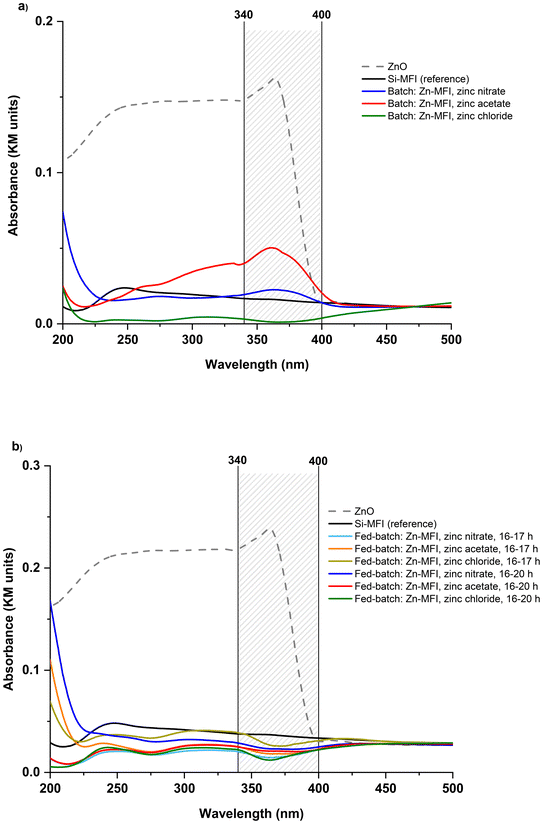
The UV-vis analysis was used to determine the nature of the zinc species in zincosilicate samples, similar to the stannosilicate section. In Fig. 8, it is shown that bulk zinc oxide (ZnO) displays a (very) broad signal area at 250–400 nm with a distinguished peak at around 360 nm, which is attributed to the electron transition from the valence band to the conduction band,36,37 while the band at 200–210 nm is associated with framework Zn. Samples with low Si/Zn ratio (<100), including FB samples (fed-batch: Zn-MFI, 16–20 h, zinc nitrate & fed-batch: Zn-MFI, 16–17 h, zinc acetate & fed-batch: Zn-MFI, 16–17 h, zinc chloride) and batch samples (batch: Zn-MFI, zinc nitrate & batch: Zn-MFI, zinc acetate & batch: Zn-MFI, zinc chloride), show a prominent peak at 200 nm, which could be assigned to isolated Zn sites within the MFI framework. These observations aligned with Si/Zn ratios obtained by the ICP technique. Except for two samples (batch: zinc acetate and nitrate), there are no peaks around 250–400 nm for the other zinc-containing zeolites, which suggests the absence of UV-visible ZnO clusters. The two exceptional samples show a broad peak in the 340–400 nm region, which may be attributed to extra-framework zinc species.
It should be noted that the metal feeding procedure would not have interfered with the pH profile (which was mapped and shown in Fig. 2) since the synthesis media is heavily basic. Specifically, the pH of the pure siliceous MFI synthesis solution (i.e., starting gel) is 13.08, while adjustment of H2O/Si ratio from 20 to 28 (i.e., time-feeding of a solution) lowers it to the value of 13.02. On the other hand, addition of the studied metal sources solution does not considerably impact it. For instance, we only noticed the minor change of pH: to 12.69 and 12.59, after SnCl4 and Zn(NO3)2 precursors were mixed to the (pure siliceous) starting gel, respectively.
Further FB reactor development
Although temperature and pressure are continuously monitored via sensors within the synthesis medium, yield and pH (thus far, Fig. 2) are determined from extracted samples. Therefore, the current method for time-mapping zeolite synthesis combines on-line and off-line measurements. Considering yield and pH as critical parameters for monitoring zeolite formation and distinguishing between different stages (intermediate induction phase and crystal growth), time-mapping should be improved as off-line (ex situ) measurements are error-prone. pH is highly dependent on temperature and the pH measured ex situ at room temperature might differ from the actual pH in the synthesis media at operating temperature. Moreover, the extrapolation of the final yield based on the extracted samples (of a limited volume) could involve errors and depend on the homogeneity of the sample. For example, the stirring rate should be increased before taking any samples. If not increased, the samples would not be well-homogenized, sometimes affecting the calculated yield. Therefore, time-mapping should be improved to provide a precise representation of ongoing events in the media synthesis, and off-line or ex situ measurements should be substituted with an on-line or in situ approach.A modified platform was designed and developed based on the previous FB set-up. This custom-made set-up is equipped with a single junction pH probe fitted on top of the lid and connected to the pH meter. The pH probe can measure within the range of 0 to 14, but it is essential to consider the working conditions (of a zeolite synthesis, in our case). The recommended temperature range for this pH probe is −5 to 100 °C for continuous use and −5 to 110 °C for intermittent use. A unique feature of this set-up is that T, P, and pH are logged via sensors inside the synthesis medium, and these in situ measurements made time-mapping of zeolite synthesis fully on-line. The modified FB platform equipped with the in situ pH probe is shown in Fig. 9.
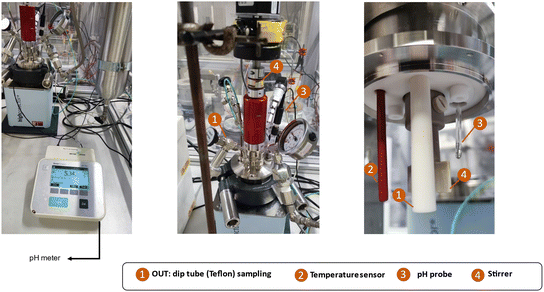 | ||
| Fig. 9 The pictures of the interior and exterior of the modified FB set-up equipped with in situ pH probe. | ||
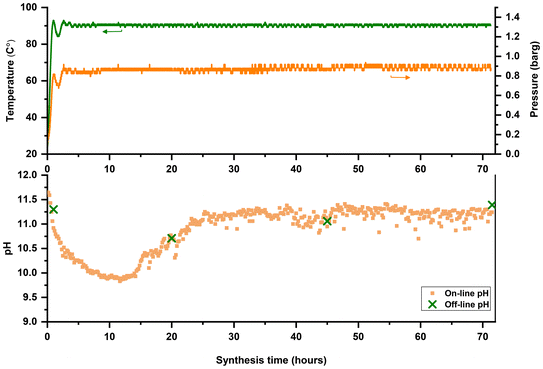
Time-mapping of a zeolite synthesis is carried out in the modified FB platform with online monitoring and logging of temperature, pressure, and pH. For a better comparison, ex situ and off-line pH measurements were also conducted immediately after sample extraction to minimize (or assess) temperature-related effects on pH values. As shown in Fig. 10, silicalite-1 (MFI) synthesis was used as a model synthesis system and time-mapped at 90 °C. It was observed that the pH decreased after 30 minutes (see also Fig. S11†) and then increased after approximately 25 hours. Enhanced monitoring improves the accuracy and reliability for understanding and distinguishing different stages of zeolite formation. As depicted in Fig. 10, off-line measured pH values align with on-line pH profiles. Although the trend (decrease and increase) could be guessable from off-line measurements, critical information will be missed if we only rely on these ex situ measurements, such as the midway region (from 30 min to 25 h) where pH drops to almost 10. This midway region could be used as the intervention point to alter the outcome or change the formation pathway of zeolite synthesis. A critical note, however, is the frequent calibration of the pH probe to maintain measurement consistency and avoid errors.
Summary and outlook
In this contribution, we illustrate, for the first time, the applicability of monitoring and controlling zeolite crystallization in a fed-batch type reactor. This active tool was developed to supervise different stages of zeolite synthesis through ex and in situ measurements, offering many temporal and kinetic insights. Time-mapping of zeolite evaluation could be carried out from one-pot experiments in the FB reactor while saving ingredients and time. Through time-mapping and the feeding capability of FB reactors, ingredients could be manipulated along the path of synthesis. Such interactions or mid-synthesis concentration changes cannot be accessed directly in the classic batch reactors used in zeolite synthesis. As practical showcases, siliceous MFI syntheses were time-mapped by the monitoring and sampling features of the FB platform at two temperatures. Later, these crystallization curves were used as a basis for stanno- and zinco-silicate syntheses via the “timed-addition” (of the corresponding metal) feature, and the materials were studied thoroughly. It was found that the structural incorporation of heteroatoms strongly depends on the type of metal. Stannosilicates mainly contained extra-framework tin species (SnO2), while no peak associated with extra-framework ZnO was observed in zinc-containing FB samples. The FB platform exhibited different behavior compared to other nonconventional reactor platforms (such as EAS: electro-assisted synthesis17,19) due to the distinct nature of the heteroatoms released during the electrochemically-mediated synthesis process. Different features of the FB reactor were discussed, the reactor design was improved, and the final, more advanced, and modified FB platform was developed based on experimental findings. The new platform consists of temperature, pressure, and pH sensors inside the synthesis medium, which offers the possibility of time-mapping of a zeolite synthesis entirely on-line with in situ pH measurements. This on-line “time-mapping” helps to identify and to provide a better understanding of the critical events (i.e., dissolution, induction phase, nucleation, and crystallization) in zeolite synthesis, while the “timed-addition” concept opens up plenty of avenues for non-conventional zeolite synthesis. For one, the FB reactor and its “in situ addition/sampling at temperature” features provide opportunities to investigate concepts such as phase-competitive zeolite formation (e.g., distinguishing competition from pH profiles), structural engineering of zeolites (core–shells or zoning from Si or Al addition, etc.), or cooperative–competitive OSDA effects.38Developing reactor-based methods has good potential to supplement the currently dominant batch processing for zeolite synthesis and its research. While the fed-batch reactor could effectively monitor and manipulate the zeolite synthesis to achieve a desirable outcome, it could not speed up the synthesis process. Continuous flow reactors on the other hand tackle this issue and are heavily being researched from a time-efficiency angle. These flow reactors have shown remarkable performance not only toward ultrafast synthesis but also in terms of cost-effective and flexible synthesis systems due to efficient heat transfer.4,6 Yet, these reactors can face large issues with clogging. On top, real-time monitoring (i.e., pressure buildup and pH profile) and intermediate addition concepts would be nearly impossible in these flow reactors in contrast to the here presented FB platform which has shown useful for these purposes. Hence, it seems various reactor-based approaches are practical solutions for specific objectives, each with their unique capabilities. While the progress is promising, the full potential of nonconventional reactors (also those adding heteroatoms from in situ electric anodic oxidation17,19) remains untapped.
Data availability
The data supporting this article have been included as part of the ESI.†Conflicts of interest
There are no conflicts to declare.Acknowledgements
SACHEM is explicitly thanked for providing the organic structure-directing agents (TPAOH) through an “academic support” program. A. J., G. I., and M. D. thank the European Research Council (ERC) for funding ERC Starting Grant 948449 to M. D. named Z-EURECA: ZEolite synthesis in Unusual Reactors for Enhanced CAtalysts. A. D. acknowledges KU Leuven for a BOF-PDM grant.References
- A. Deneyer, Q. Ke, J. Devos and M. Dusselier, Chem. Mater., 2020, 32, 4884–4919 CrossRef CAS.
- Z. Liu, K. Okabe, C. Anand, Y. Yonezawa, J. Zhu, H. Yamada, A. Endo, Y. Yanaba, T. Yoshikawa, K. Ohara, T. Okubo and T. Wakihara, Proc. Natl. Acad. Sci. U. S. A., 2016, 113, 14267–14271 CrossRef CAS PubMed.
- Z. Liu, N. Nomura, D. Nishioka, Y. Hotta, T. Matsuo, K. Oshima, Y. Yanaba, T. Yoshikawa, K. Ohara, S. Kohara, T. Takewaki, T. Okubo and T. Wakihara, Chem. Commun., 2015, 51, 12567–12570 RSC.
- Z. Liu, T. Wakihara, D. Nishioka, K. Oshima, T. Takewaki and T. Okubo, Chem. Mater., 2014, 26, 2327–2331 CrossRef CAS.
- T. Yoshioka, Z. Liu, K. Iyoki, A. Chokkalingam, Y. Yonezawa, Y. Hotta, R. Ohnishi, T. Matsuo, Y. Yanaba, K. Ohara, T. Takewaki, T. Sano, T. Okubo and T. Wakihara, React. Chem. Eng., 2021, 6, 74–81 RSC.
- Z. Liu, J. Zhu, T. Wakihara and T. Okubo, Inorg. Chem. Front., 2019, 6, 14–31 RSC.
- Z. Liu, T. Wakihara, K. Oshima, D. Nishioka, Y. Hotta, S. P. Elangovan, Y. Yanaba, T. Yoshikawa, W. Chaikittisilp, T. Matsuo, T. Takewaki and T. Okubo, Angew. Chem., Int. Ed., 2015, 54, 5683–5687 CrossRef CAS.
- A. Minami, M. Takemoto, Y. Yonezawa, Z. Liu, Y. Yanaba, A. Chokkalingam, K. Iyoki, T. Sano, T. Okubo and T. Wakihara, Adv. Powder Technol., 2022, 33, 103702 CrossRef CAS.
- Z. Liu, J. Zhu, C. Peng, T. Wakihara and T. Okubo, React. Chem. Eng., 2019, 4, 1699–1720 RSC.
- M. Tassopoulos and R. W. Thompson, Zeolites, 1987, 7, 243–248 CrossRef CAS.
- A. Çulfaz and P. Orbey, in Molecular Sieves—II, ed. J. R. Katzer, 1977, pp. 708–716 Search PubMed.
- C. S. Cundy, M. S. Henty and R. J. Plaisted, Zeolites, 1995, 15, 353–372 CrossRef CAS.
- C. S. Cundy, M. S. Henty and R. J. Plaisted, Zeolites, 1995, 15, 400–407 CrossRef CAS.
- D. Parmar, Z. Niu, Y. Liang, H. Dai and J. D. Rimer, Faraday Discuss., 2022, 235, 322–342 RSC.
- Q. Zhang, S. Gao and J. Yu, Chem. Rev., 2023, 123, 6039–6106 CrossRef CAS PubMed.
- E. Peeters, S. Calderon-Ardila, I. Hermans, M. Dusselier and B. F. Sels, ACS Catal., 2022, 12, 9559–9569 CrossRef CAS.
- G. Ivanushkin, M. Torka Beydokhti, J. S. Martinez-Espin and M. Dusselier, Chem. Mater., 2023, 35, 10216–10227 CrossRef CAS.
- P. Ferrini, J. Dijkmans, R. De Clercq, S. Van de Vyver, M. Dusselier, P. A. Jacobs and B. F. Sels, Coord. Chem. Rev., 2017, 343, 220–255 CrossRef CAS.
- G. Ivanushkin and M. Dusselier, Chem. Mater., 2023, 35, 5049–5058 CrossRef CAS PubMed.
- P. Lu, S. Ghosh, M. D. de Mello, H. S. Kamaluddin, X. Li, G. Kumar, X. Duan, M. Abeykoon, J. A. Boscoboinik, L. Qi, H. Dai, T. Luo, S. Al-Thabaiti, K. Narasimharao, Z. Khan, J. D. Rimer, A. T. Bell, P. Dauenhauer, K. A. Mkhoyan and M. Tsapatsis, Angew. Chem., 2021, 133, 19363–19370 CrossRef.
- J. Devos, S. Robijns, C. Van Goethem, I. Khalil and M. Dusselier, Chem. Mater., 2021, 33, 2516–2531 CrossRef CAS.
- J. Čejka, A. Corma and S. Zones, Zeolites and Catalysis: Synthesis, Reactions and Applications, Wiley-VCH, 2010, vol. 1–2 Search PubMed.
- S. Yang and A. Navrotsky, Chem. Mater., 2002, 14, 2803–2811 CrossRef CAS.
- G. Golemme, A. Nastro, J. B. Nagy, B. Subotić, F. Crea and R. Aiello, Stud. Surf. Sci. Catal., 1991, 65, 573–580 CrossRef CAS.
- M. S. Holm, S. Saravanamurugan and E. Taarning, Science, 2010, 328, 602–605 CrossRef CAS.
- M. Moliner, Y. Román-Leshkov and M. E. Davis, Proc. Natl. Acad. Sci. U. S. A., 2010, 107, 6164–6168 CrossRef CAS.
- E. Taarning, S. Saravanamurugan, M. S. Holm, J. Xiong, R. M. West and C. H. Christensen, ChemSusChem, 2009, 2, 625–627 CrossRef CAS PubMed.
- A. Corma, M. E. Domine and S. Valencia, J. Catal., 2003, 215, 294–304 CrossRef CAS.
- A. Parulkar, R. Joshi, N. Deshpande and N. A. Brunelli, Appl. Catal., A, 2018, 566, 25–32 CrossRef CAS.
- M. Kasula, A. P. Spanos, L. Ford and N. A. Brunelli, Ind. Eng. Chem. Res., 2022, 61, 1977–1984 CrossRef CAS.
- M. Orazov and M. E. Davis, Chem. Sci., 2016, 7, 2264–2274 RSC.
- D. Fu, Y. Park and M. E. Davis, Angew. Chem., Int. Ed., 2022, 61, e202112916 CrossRef CAS PubMed.
- Y. Zhang, X. Liu, Q. Y. Liu, J. H. Wang, T. Hu, Y. M. Lin and J. H. Zhang, Dalton Trans., 2023, 52, 10918–10926 RSC.
- S. Kowalak, E. Janiszewska, M. Gierczyńska, V. Dolata, N. Evmiridis, T. Katranas, A. Vlessidis, V. Tsiatouras, F. Roessner and E. Schneider, Stud. Surf. Sci. Catal., 2004, 154, 2200–2207 CrossRef.
- L. Xie, R. Wang, Y. Chai, X. Weng, N. Guan and L. Li, J. Energy Chem., 2021, 63, 262–269 Search PubMed.
- J. Liu, Y. Liu, H. Liu, Y. Fu, Z. Chen and W. Zhu, ChemCatChem, 2021, 13, 4780–4786 Search PubMed.
- X. Su, Z. P. Hu, J. Han, Y. Jia, S. Xu, J. Zhang, D. Fan, Y. Wei and Z. Liu, Microporous Mesoporous Mater., 2023, 348, 112371 CrossRef CAS.
- J. Bae and M. Dusselier, Chem. Commun., 2023, 59, 852–867 Search PubMed.
Footnote |
| † Electronic supplementary information (ESI) available. See DOI: https://doi.org/10.1039/d4re00440j |
| This journal is © The Royal Society of Chemistry 2025 |

![[thin space (1/6-em)]](https://www.rsc.org/images/entities/char_2009.gif) :
: