
 Open Access Article
 This Open Access Article is licensed under a Creative Commons Attribution-Non Commercial 3.0 Unported Licence
Probing molecular motion and microstructure into emulsion gels by PFG NMR and advanced microscopy for microstructural observations†
Carmine
D’Agostino‡
 *ab,
Valentina
Preziosi‡
*c,
Carmine
Schiavone
c,
Maria Vittoria
Maiorino
c,
Giuseppina
Caiazza
c and
Stefano
Guido
cd
*ab,
Valentina
Preziosi‡
*c,
Carmine
Schiavone
c,
Maria Vittoria
Maiorino
c,
Giuseppina
Caiazza
c and
Stefano
Guido
cd
aDepartment of Chemical Engineering, The University of Manchester, Oxford Road, M13 9PL, UK. E-mail: carmine.dagostino@manchester.ac.uk
bDipartimento di Ingegneria Civile, Chimica, Ambientale e dei Materiali (DICAM), Alma Mater Studiorum – Università di Bologna, Via Terracini, 28, 40131, Bologna, Italy
cDipartimento di Ingegneria Chimica, dei Materiali e della Produzione Industriale (DICMaPI), Università di Napoli Federico II, Piazzale Tecchio, 80, 80125, Napoli, Italy. E-mail: valentina.preziosi@unina.it
dCEINGE Biotecnologie avanzate Franco Salvatore, 80143, Napoli, Italy
First published on 20th March 2025
Abstract
Emulsion gels are soft-solid materials with a composite structure consisting of an oil phase within a gel matrix. In recent years, the interest in the application of gel-like systems as functional colloids has attracted great attention especially in the food and pharmaceutical industries due to their tunable morphology and microstructure, excellent stability, and promising functional properties, such as controlled release of encapsulated bioactive compounds. The presence of the oil phase in emulsion gels can strongly affect water diffusion in a complex manner that is far from being fully elucidated. Here, an experimental investigation based on the use of pulsed-field gradient (PFG) NMR with a low-field benchtop NMR instrument, in combination with advanced microscopy, has been carried out to investigate the dynamic behavior of water molecules in agarose gel-based systems. Results on agarose gels (that is, without the oil/surfactant components) at two different concentrations (1% and 2% wt) showed a single water diffusion environment, which could be ascribed to free water diffusing within the gel pores. Conversely, the PFG NMR signal attenuation data for water in agarose emulsion gels showed a multi-component behavior, which can be described very well by a model that assumes species exchanging between two compartments with different diffusivities, a fast diffusion component attributed to water within the gel pores (unbound water), and a much slower diffusion component attributed to a complex interconnected microstructure formed through a synergic interaction between the hydrophilic and hydrophobic surfactants, the latter being also alike to the oil.
Introduction
Emulsion gels are complex colloid materials that exhibit the characteristics of both emulsions and gels, making them interesting and versatile systems, which find applications in several fields, such as food science, cosmetics, pharmaceuticals and biomedical.1–3 Recently, emulsion gels have received a great deal of attention due to their better performances compared to their emulsion counterpart; for example, their enhanced viscosity helps preventing instability phenomena over time (i.e., creaming and/or coalescence), thus increasing stability during storage, and the interconnected microstructure of the gel matrix has been found to be highly suitable system for drug release applications.2,4 Moreover, the macroscopic physical and chemical characteristics of emulsion gels including their appearance, texture, and stability are strongly influenced by factors, such as the type, concentration, arrangement, and interplay of their structural elements, which include the type of oil, polymers, and crosslinking agents. Thus, the functional performance of emulsion gels can be tailored by selecting different structural elements and processing conditions to fabricate them.According to the interaction between emulsion droplet and gel matrix, emulsion gels can be divided into: (i) emulsion droplet-filled gels where droplets are enclosed in the continuous gel matrix phase and (ii) emulsion droplet-aggregated gels where the gel phase is fractured by a network of the aggregated droplets. Mainly, this class of materials shows an inhomogeneous and highly structured arrangement that typically lies in between the two configurations exhibiting complex mechanical and physico-chemical properties, thus leading to the difficulty in fully elucidating their structure.
The type of gel can also affect the final heterogenous configuration where it is embedded in. In particular, hydrogels, which are cross-linked hydrophilic polymers where water is embedded in the spaces between the polymer chains, have received considerable attention in the past 50 years, due to their potential for a wide range of applications.5–8 The cross-links between polymer molecules can be formed by covalent or ionic bonds, van der Waals forces, hydrogen bonds, or physical entanglement9,10 leading to the formation of an homogeneous structure, where the polymer chains have a high degree of mobility, or heterogeneous one, in which the mobility can be hindered.
One of the most studied heterogeneous hydrogels is based on agarose, a neutral gelling heteropolysaccharide, accounting for the major fraction of agar obtained from red seaweeds. It is a hydrophilic gelator with a structure that allows spontaneous gelation and forms thermoreversible gels when dissolved in water. Insoluble in cold water, it becomes soluble in boiling water. The gel is formed when a three-dimensional network of agarose fibers, formed by helices of agarose, develops. The melting of agarose gel occurs at temperature around 85 °C, and it can be cooled down below the gelation temperature, Tg, that varies between 30 °C and 40 °C depending mostly on the methoxyl content. Due to its peculiar properties, agarose-based gels have recently been utilized in drug delivery and pharmaceutical industries as advanced carriers for therapeutic agents.11–14
Mass transport in gels plays an important role in many of the applications mentioned above. In this context, diffusion of different molecules, in particular water, in hydrogels has been widely investigated in the literature, both experimentally and numerically,8,15 the results being related to the type of gel, homogeneous or heterogeneous, the degree and density of polymer cross-linking. In particular, three main theories have been formulated to describe diffusion behavior of water molecules in hydrogels: hydrodynamic, obstruction and free volume theories.16,17 Among the various techniques, in the last decades, nuclear magnetic resonance (NMR) has been used to study diffusion in systems exhibiting complex microstructure,18 such as emulsions,19–25 gels,26–29 biofluids30 and other microstructured and heterogeneous systems, such as colloidal and polymeric systems.20,26,31–35 For example, Splith et al. and Makarov et al.34,36 showed that the analysis of the diffusion coefficients and characteristic residence times provides valuable insights into the microstructure of the system. Fujiyabu et al.26 used pulsed-field gradient spin-echo 1H NMR to study diffusion in heterogeneous hydrogels and found that the three theories do not fully explain the diffusion behavior; however, it was found that diffusion strongly depends on the size of the particles embedded in the polymer network showing that the heterogeneity of the microstructure affects diffusion by retarding it.7
Even though there is great interest in understanding diffusion mechanisms in complex microstructures like emulsion gels, the problem is far to be fully elucidated.
In this work, we report new insights into the evolution of both dynamics and microstructure of water inside agarose emulsion gel systems. The PFG NMR technique combined with confocal microscopy imaging are used to probe diffusion of the various species in the agarose gels and in the emulsion gels. The effect of the type of oil is also investigated and discussed. Data analysis using a two compartment-exchange diffusion model is then carried out to obtain diffusion coefficients and residence times of water in different diffusion environments.
Materials and methods
Materials
The agarose used in this study was a low EEO-type one (A0576, Sigma Aldrich) with a density of 1.00 g cm−3 at 20 °C and a water solubility of 10 g L−1 at 80 °C. Two oils were used to form the two oil phases used in this work: soybean oil (purchased from Sigma-Aldrich with a viscosity of η = 0.06 Pa s,37 a density of ρoil = 0.9138 kg L−1 at room temperature and an average molecular weight of ∼900 kg kmol−1 ref. 38) and mineral oil (Drakeol 7 purchased by Penreco). Both oil phases were prepared by adding two non-ionic surfactants, span 20 and tween 80, the former more hydrophobic (density = 1.032 g mL−1, molar mass 346.46 g mol−1, not soluble in water but slightly soluble in mineral oil) and the latter more hydrophilic (density = 1.06–1.09 g mL−1, molar mass = 1310 g mol−1, very soluble in water, 1.9 × 10⁻² mg L−1 at 25 °C).19 Both surfactants were purchased by Sigma Aldrich. Deionized water was supplied by Millipore.Sample preparation
Agarose gels at 1 and 2% wt of agarose were prepared by dispersing agarose powder in deionized water, DIwater, stirred at ∼80 °C for 15 minutes, until the mixture became homogeneous. Emulsion gels were prepared by mixing the agarose solution, as previously described, with an oil phase for 10 minutes at approximately 80 °C. Each oil phase was made by oil (mineral oil or soybean oil), and two non-ionic surfactants, span 20 and tween 80. The surfactants were added in a of 1![[thin space (1/6-em)]](https://www.rsc.org/images/entities/char_2009.gif) :1 ratio to the oil. Firstly, the hydrophobic surfactant span 20 was mixed with the oil at room temperature for about 15 minutes and then the other surfactant was added and let it mix for 20 min. The solution was mixed in a beaker under mild stirring (≈250 revolutions per minute) and at room temperature. For clarity, the oil phase composed of mineral oil, span 20 and tween 80 was referred to as mineral phase while the one composed of soybean oil, span 20 and tween 80 was referred to as soybean phase. More details on the oil phase composition are reported in Table 1.
:1 ratio to the oil. Firstly, the hydrophobic surfactant span 20 was mixed with the oil at room temperature for about 15 minutes and then the other surfactant was added and let it mix for 20 min. The solution was mixed in a beaker under mild stirring (≈250 revolutions per minute) and at room temperature. For clarity, the oil phase composed of mineral oil, span 20 and tween 80 was referred to as mineral phase while the one composed of soybean oil, span 20 and tween 80 was referred to as soybean phase. More details on the oil phase composition are reported in Table 1.
| Oil phase | Mineral oil [g] | Soybean oil [g] | Span 20 [g] | Tween 80 [g] |
|---|---|---|---|---|
| Soybean phase | — | 3 | 0.5 | 0.5 |
| Mineral phase | 3 | — | 0.5 | 0.5 |
The emulsion gels obtained were four and were made by varying, in turn, either the percentage of agarose in the gel or the type of oil, with the compositions of these samples shown in Table 2.
| Emulsion gels | Agarose gel 1% [g] | Agarose gel 2% [g] | Soybean phase [g] | Mineral phase [g] |
|---|---|---|---|---|
| Soybean gel@1%wt (S/G1%) | 4.5 | — | 0.5 | — |
| Mineral gel@1%wt (M/G1%) | 4.5 | — | — | 0.5 |
| Soybean gel@2%wt (S/G2%) | — | 4.5 | 0.5 | — |
| Mineral gel@2%wt (M/G2%) | — | 4.5 | — | 0.5 |
NMR measurements
NMR experiments were performed at 28 °C using a Spinsolve Magritek 43 MHz, equipped with a magnetic field gradient strength up to 164 mT m−1. The samples were placed into 5 mm NMR tubes. 1H NMR spectra were acquired using a pulse length of 18 μs, with a pulse amplitude of −6 dB for the 90° pulse and 0 dB for the 180° pulse, a receiver gain of 52 and acquiring 8192 points in the time domain with a dwell time of 50 μs. Pulsed-field gradient (PFG) NMR diffusion experiments were carried using the pulsed gradient stimulated echo (PGSTE) pulse sequence with observation times in the range 85 to 1000 ms (which were below the T1 = 2000 ms value measured for water) and gradient pulse duration in the range 1–5 ms. In the case of single-component behavior the data were fitted using the Stejskal–Tanner equation:39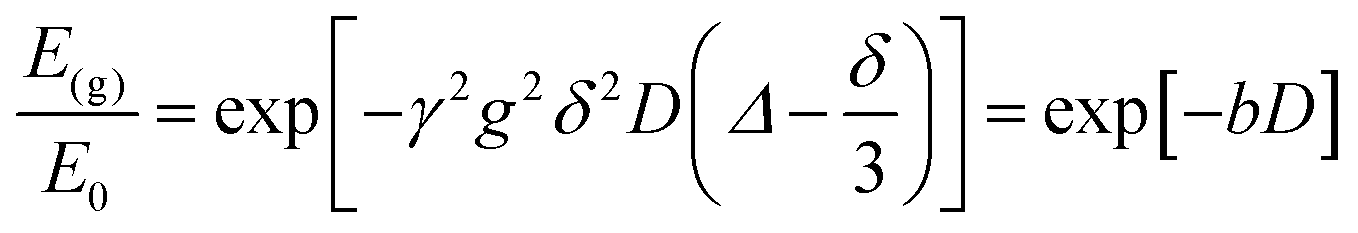 | (1) |
In eqn (1), E(g) and E0 are the NMR echo signal intensities in the presence and absence of the magnetic field gradient, respectively, γ is the gyro-magnetic ratio of the nuclei being studied (i.e., 1H in our case), g is the strength of the gradient pulse of duration δ, Δ is the observation time (i.e., the time interval between the leading edges of the gradient pulses) and D the self-diffusion coefficient. The b term, b = γ2δ2g2(Δ − δ/3)[s m−2], is often referred to as the b-factor.
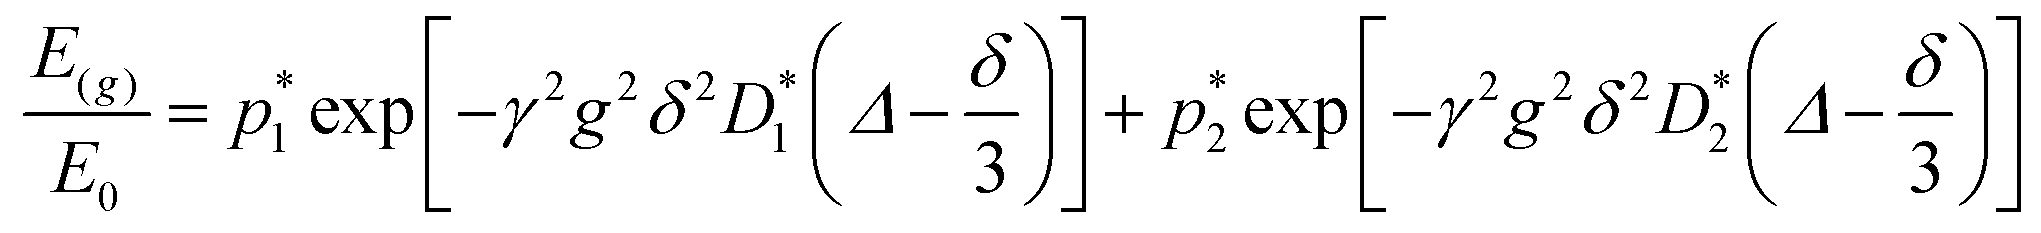
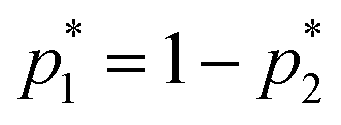
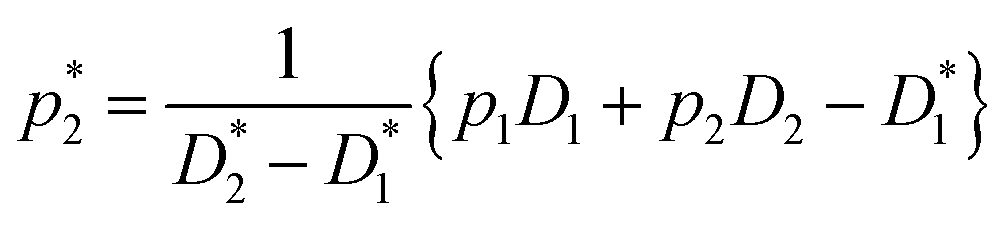
The behavior of the PGSTE signal of water within the agarose emulsion gels was, on a semi-log scale, highly non-linear. In this case, the experimental data were fitted using a model able to describe a two-component behavior. In particular, the signal decay is described by the Kärger set of equations:40
 | (2) |
 | (3) |
 | (4) |
 | (5) |
 | (6) |
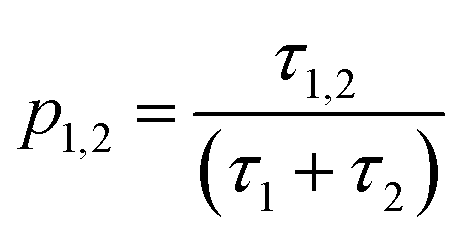
This equation bears formal similarities to the Stejskal–Tanner equation; however, it also incorporates the parameters p1 and p2 as well as τ1 and τ2, which can be interpreted, respectively, as the relative fractions of each component and the exchange times between the two compartments. It must be noted that the previously mentioned parameters are hidden in the explicit form of the equation as highlighted by eqn (3), (4), (5) and (6). Specifically, eqn (2) is characterized by two decaying exponentials, with the decay factor represented by the apparent diffusion coefficients 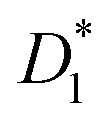 and
and 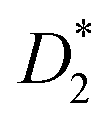 . The pre-exponential terms correspond to the apparent relative fractions
  and
and  . Each apparent diffusion coefficient is derived using eqn (3). For additional details on the equation and the underlying modeling assumptions, readers are referred to Hindmarsh et al.41
It is important to approach this process with caution, as there is a risk of obtaining parameters that only allow for curve interpolation without accurately reflecting the physical behavior of the system. To ensure the robustness of our results, we followed the approach proposed by Weber et al.42 maintaining consistent values for the fitting parameters across each datasets while varying only the parameter Δ. In addition, we deliberately chose a relatively simple model to mitigate overfitting caused by noise in our high b-factor data. While a more systematic modeling approach falls outside the scope of this paper, readers are referred to Costantini et al.43 for guidance on selecting models that accurately capture the system's behavior. Our primary objective is to provide the scientific community with a first-approximation estimation of key parameters in this novel, complex system. This approach helps safeguard against fitting parameters that lack meaningful physical interpretation and strengthen the results of modeling. To further validate the robustness of our fitting process, we have included Pearson's plots for each set of fits in the ESI† (Fig. S1). The parameters used for each case can be found in Table 3, each row is representative of a fit with the fitted parameter being D1, D2, τ1 and τ2 and R2, the accuracy of the fitting process. The fitting procedure was carried out using MATLAB R2023b, employing the built-in lsqcurvefit function for parameter estimation and the nlparci function to calculate confidence intervals.
| Emulsion gels | D 1[m2 s−1] × 109 | τ 1 [s] | D 2[m2 s−1] × 109 | τ 2 [s] | p 1 [%] | p 2 [%] | R 2 |
|---|---|---|---|---|---|---|---|
| S/G1% | 2.000 ± 0.050 | 40 ± 10 | 0.160 ± 0.060 | 0.870 ± 0.090 | 97.900 ± 0.750 | 2.100 ± 0.750 | 0.996 |
| S/G2% | 2.000 ± 0.090 | 9.750 ± 3.120 | 0.320 ± 0.080 | 0.590 ± 0.070 | 94.300 ± 2.320 | 5.700 ± 2.320 | 0.993 |
| M/G1% | 1.790 ± 0.050 | 65 ± 30 | 0.140 ± 0.080 | 0.810 ± 0.100 | 98.700 ± 0.750 | 1.300 ± 0.750 | 0.995 |
| M/G2% | 1.880 ± 0.090 | 6.300 ± 3.250 | 0.180 ± 0.130 | 0.300 ± 0.040 | 95.500 ± 2.850 | 4.500 ± 2.850 | 0.987 |
It is worth mentioning that the presented model assumes Gaussian and Brownian diffusion within the systems under investigation. Whilst this assumption might not be the most accurate, it leads to a simpler interpretation of the data obtained by the model.
Confocal laser scanning microscopy
Images were performed by using a confocal laser scanning microscope (LSM 510 Meta, Zeiss) equipped with a helium/neon laser (LASOS Lasertechnik GmbH, LGK SAN7460A).44 A high magnification oil-immersion objective (63×/1.4, Plan-Apochromat, Zeiss) was used in all the experiments. Rhodamine B was used as fluorescent dye and dissolved in water (C = 500 μM). A 543-nm laser was used for excitation and Rhodamine fluorescent signals were detected in a red channel after passage through a LP560 filter and NT80/20 and NFT545 beam splitters.Results and discussion
NMR spectra
Fig. 1 shows the 1H NMR spectra for all the emulsion gels studied here and for the pure soybean oil, mineral oil, span 20, tween 80 and agarose gels. In the 1H NMR spectra of agarose gels, there is a single signal (a), range 4.5–5 ppm, which is assigned to water protons and its chemical shift is indeed similar to that of pure water.19 At the same time, it is possible identify the spectral features of the various components in the emulsion gels: peak (b), range 4.5–5 ppm, is assigned to water; peaks (c), range 0–2 ppm, are unambiguously assigned to of the aliphatic moieties of the mineral and soybean oils, span 20 and tween 80, which overlap with each other and this can be clearly seen by a comparison with the NMR spectra of the pure components. For the pure components (mineral oil, soybean oil, tween 80 e span 20) different spectral regions can be identified: region (d), within the range 0–2 ppm, which includes the NMR signal of the aliphatic moieties of the mineral and soybean oils, span 20, tween 80 [19]; region (e), range 3–4 ppm, is assigned to tween 80, in particular to the sorbitol derivative part of the tween 80 molecule;45 region (f), range 4.5–6 ppm, is assigned to soybean oil, in particular to the hydrogens bonded directly to the double carbon bond of the molecule. | ||
| Fig. 1 1H NMR spectra of pure species and emulsion systems. | ||
Diffusion of water inside agarose gels
PGSTE measurements were carried out to evaluate the self-diffusion coefficient of the species within the agarose gels in order to understand the mobility of such species and how they were affected by the porous systems in which diffusion occurs. The only species involved in agarose gels is water, which can be confirmed by the spectral assignment reported in Fig. 1.The PGSTE log attenuation plots for water in agarose gel, shown in Fig. 2, display a linear behavior, with self-diffusion coefficients measured for water in those two gels being approximately the same with a value of 2.2 × 10⁻⁹ m2 s−1 and independent of the observation time. This value is lower, although not to a large extent, than the self-diffusion coefficient measured for bulk water at the approximately 28 °C, which is 2.5 × 10⁻⁹ m2 s−1. A similar behavior has previously been observed for water diffusing in gelatine gels, and can be explained by considering diffusion of free water in a homogeneous gel structure reduced by the tortuosity of the gel pore network, that is, affected by the pore network connectivity.44
 | ||
| Fig. 2 PGSTE log plots for (a) water in agarose gel 1% and (b) water in agarose gel 2% at different observation times (from 85 to 1000 ms). Solid lines are fittings to eqn (1). | ||
Diffusion of water inside emulsion gels
We now focus our attention on the behavior of the water in the emulsion gels by monitoring the PGSTE signal attenuation for the NMR signal within the range 4.4–5.4 ppm at different observation times. Fig. 3a and c show the decay of the water signal in the S/G1% and S/G2% systems, whilst Fig. 4a and c show the decay of the water signal in the M/G1% and M/G2% systems. In all cases, the signal decay in the PFG log attenuation plots is highly non-linear and shows two distinct regimes, a fast decay at low b-factor values and a slower decay at high b-factor values. The evolution of the water diffusion signal can be described very well by the Kärger model discussed in the experimental section in all the emulsions gels studied in this work, that is, S/G1%, S/G2%, M/G1% and M/G2%. A global fit to the data using this model provides diffusion coefficients and respective mean residence times, summarized in Table 3.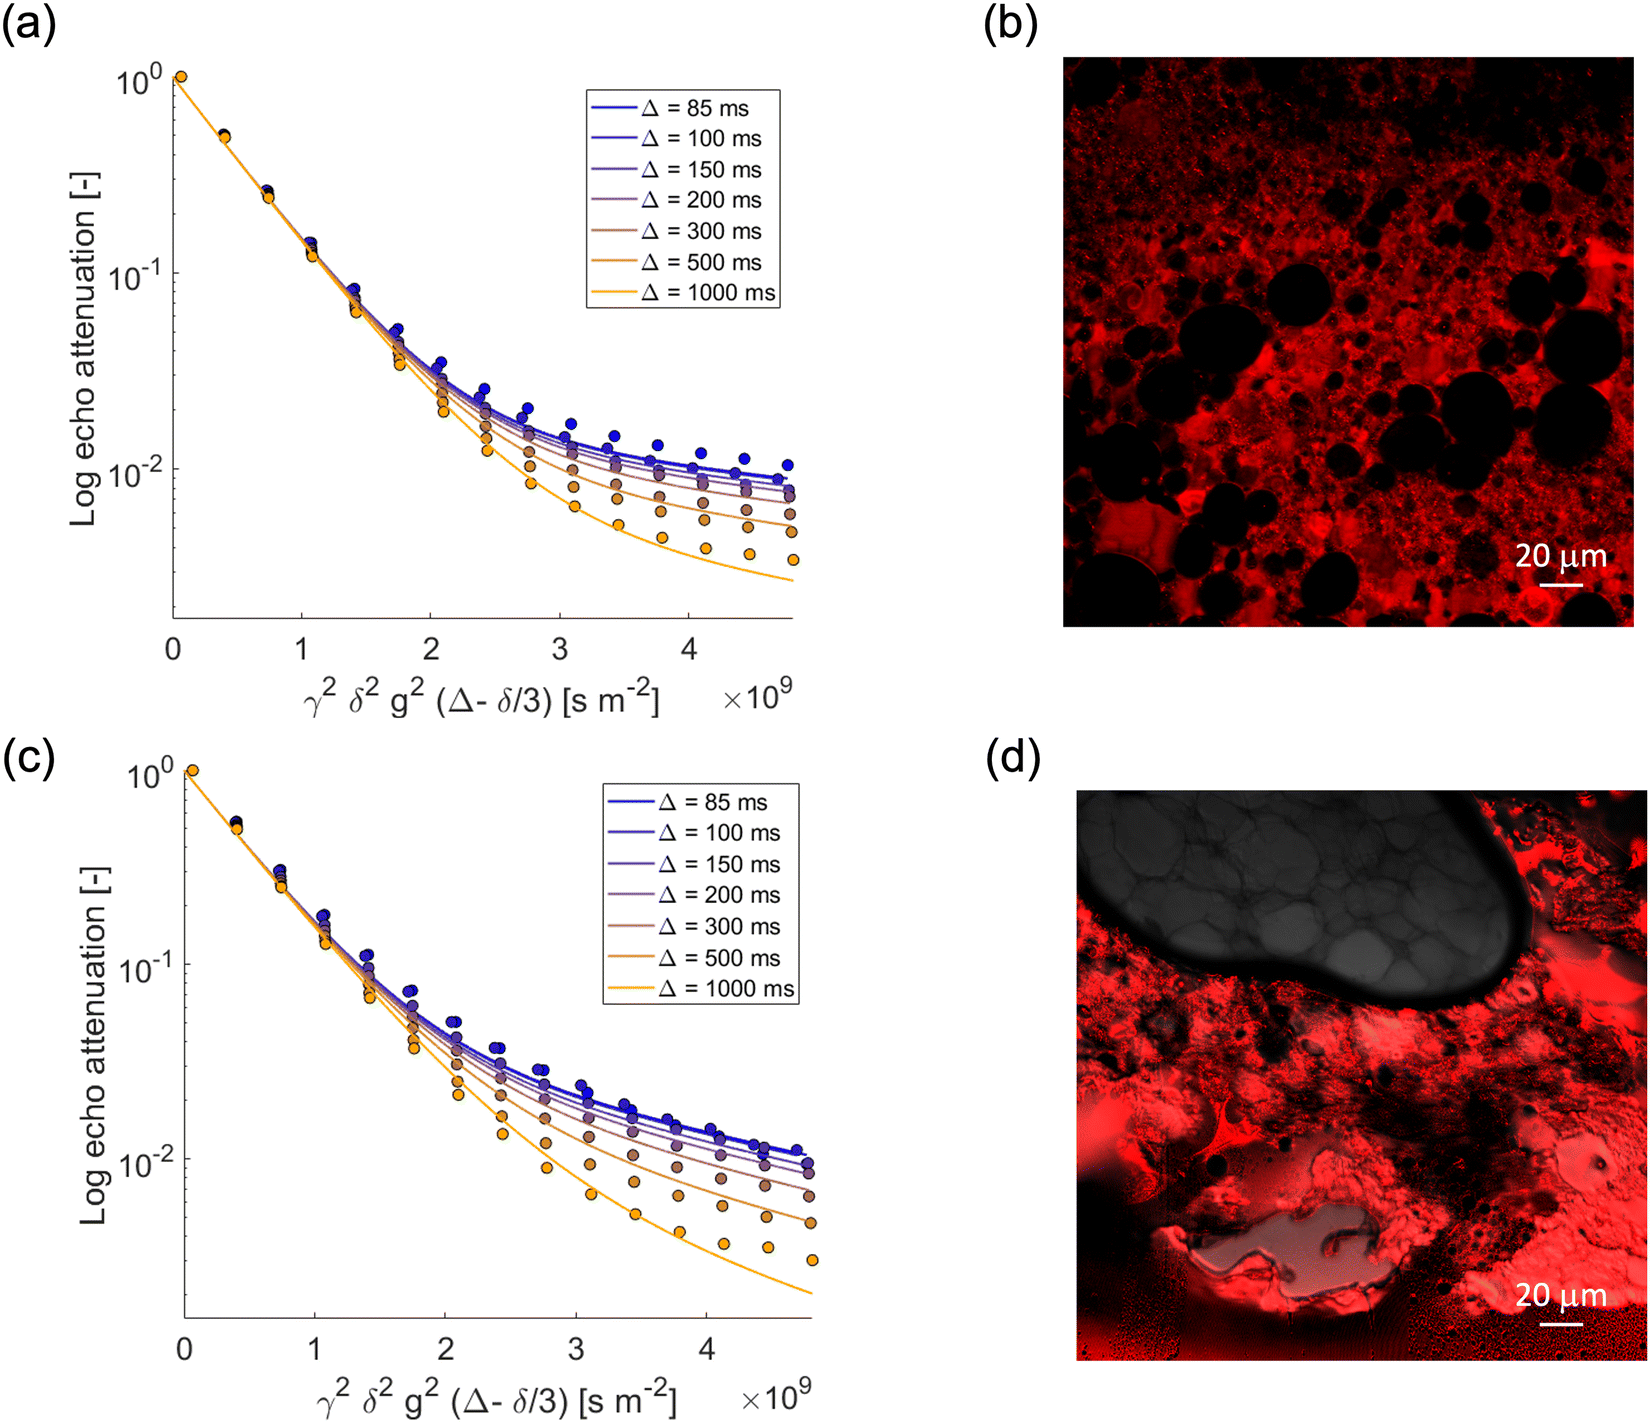 | ||
| Fig. 3 PGSTE log attenuation plots for (a) water in S/G1%, (c) water in S/G2%, at different observation times Δ = [85, 100, 150, 200, 300, 500, 1000] ms. Solid lines are fittings obtained using eqn (2). (b) and (d) Confocal images of S/G1% and S/G2%, respectively. Rhodamine B has been used as fluorescent dye. | ||
 | ||
| Fig. 4 PGSTE log attenuation plots for (a) water in M/G1%, (c) water in M/G2% at different observation times Δ = [85, 100, 150, 200, 300, 500, 1000] ms. Solid lines are fittings obtained using eqn (2). (b) and (d) Confocal images of M/G1%, and M/G2%, respectively. Rhodamine B has been used as fluorescent dye. | ||
In all emulsion gels the value of the fast-diffusing component D1 is of the same order of magnitude of bulk water, the latter having a diffusion coefficient of 2.5 × 10⁻⁹ m2 s−1, and of water inside the agarose gel. This component can be attributed to water diffusing inside the gel structure and is the major diffusion component, as it can be seen by inspection of the diffusing populations in Table 3. Indeed, the values of diffusivity are similar to those of water diffusing inside gelatin gel structures, which were attributed to water diffusing in the pore network formed by the gelatin polymer.44 It is noted that relative to water in pure agarose gel, the values of the D1 component in the emulsion gel, reported in Table 3, are in all cases slightly lower, which indicates that in the presence of oil the tortuosity of the gel structure increases, leading to a decrease in self-diffusion coefficient. The mean residence times for such water molecules, τ1, is of the order of seconds and it is affected by the type of oil used to form the emulsion and by the agarose concentration; for the 1% systems, τ1 is significantly higher than that associated to the corresponding 2% ones, which is likely due to differences in microstructure across the two systems. In particular, emulsion gel displays a complex microstructure, whereby a network of aggregated droplets is interconnected in a continuous gel network around the droplets. In the confocal microscopy images, the red color is due to the addition of Rhodamine, which has a very strong hydrophilic nature, ensuring a preferential localization in the aqueous phase, while the dark spherical objects are associated to oil droplets. For example, the higher τ1 in the S/G 1% system can be ascribed to larger oil droplets, which corresponds to larger compartments where water diffuses on longer timescales. It can also be observed that an increase in gel concentration (1 to 2%wt) significantly reduces the values of τ1, which is consistently found in both the S/G and M/G systems. Again, at lower concentrations of agarose, the gel structure appears more open and loosely packed (Fig. 3 and 4). This allows molecules to move more freely within the gel matrix. As the percentage of agarose increases, the gel structure becomes denser and more tightly packed. This results in smaller pores and a firmer gel matrix, restricting the movement of water molecules. At this point, it is interesting to note that similar values of residence time have been reported for molecules diffusing inside the bulk pore network of porous solid in exchange with the surface.42
We now turn our attention to the slow-diffusing component D2. The values obtained for this component are significantly smaller than bulk diffusion, in particular one order of magnitude lower, and also strongly dependent on the system. It is reasonable to assume that the addition of oil and surfactants to the gel leads to a more heterogeneous gel structure, which results in a slow-diffusing component for water. Indeed, for the agarose gel alone (see Fig. 2) (that is, without formation of emulsions with oil/surfactants), and for oil in water emulsions19 (that is, without the agarose gel) we observe only a single diffusion component consistent with the D1 values reported for the emulsion gels. The presence of the surfactants is therefore crucial in affecting water diffusion. In particular, the slow-diffusing component D2 present in the emulsion gel system can be attributed to water diffusing into a complex interconnected microstructure formed through a synergic interaction between the hydrophilic and hydrophobic surfactants.46
It should be noted that several phenomena could also affect the behavior of the water signal during PFG NMR experiments in the emulsion gels. There is for example, in the S/G system, the possibility of a residual oil signal affecting the decay of the water signal (see Fig. 1, regions (b) and (f)). However, the difference in chemical shift is such that this overlap would be very minor, even more so considering that water is in large excess. Importantly, for the water behavior in the M/G system, which is similar to that in the S/G system, there is clearly no overlap between the oil and water signals, hence the water signal will not be influenced by the oil. There could be another possibility, e.g., the second component of water being influenced by the diffusion of the polymer, in our case agarose. However, measurements on the polymer/water systems (see Fig. 2) rule out this effect since only a single diffusion coefficient, close to that of bulk water, is observed. This suggests that the water behavior is representative of the physics of the system rather and not affected by the oil or polymer signals.
Conclusions
In this work, the behavior of water in agarose gel-based systems has been studied by NMR and confocal microscopy. Water in pure agarose gels shows a diffusion coefficient close to that of bulk water, reduced by the tortuosity of the pore network connectivity within the gel.For all emulsion gels, two distinct diffusion components for the water signal are observed, for each observation time Δ (ranging from 85 to 1000 ms). The data can be described well using the Kärger model for two-compartment diffusion with exchange. The faster component has a diffusion coefficient similar to that of bulk water and water inside gels (D1 = 2.5 × 10⁻⁹ m2 s−1), while the slower component can be attributed to water diffusing in an oil phase-induced more heterogeneous gel structure created by the addition of surfactants. Values of residence times obtained by the Kärger model are consistent with the gel microstructure observed using fluorescent microscopy, which depends on the type of oil and gel concentration used for the fabrication of the emulsion gel systems. The work demonstrates how the use of PFG NMR combined with confocal microscopy can yield important information on mass transport within emulsion gels and can be used as a valid tool for the design and applications of such systems. It should be noted that the use of the Kärger model implies a Gaussian diffusion process within the systems of interest, which, although reasonable, represents a potential limitation of our approach. However, we believe that our initial work can serve as a good starting point for modeling similar systems in future studies.
Author contributions
Carmine D’Agostino: conceptualization, methodology, validation, formal analysis, investigation, writing – original draft preparation. Valentina Preziosi: conceptualization, methodology, validation, formal analysis, investigation, writing – original draft preparation, funding acquisition. Carmine Schiavone: formal analysis, investigation, writing – original draft preparation. Maria Vittoria Maiorino and Giuseppina Caiazza: formal analysis, investigation. Stefano Guido: writing – review and editing, supervision. All authors have read and agreed to the published version of the manuscript.Data availability
The data that support the findings of this article have been included in the main manuscript and as part of the ESI† available in the online version of the paper. The raw data acquired with the NMR are available at the Google Drive repository at https://drive.google.com/drive/folders/1zhKP0n70vx0qUL28Xx0zHOo5EJIIx8uJ?usp=share_link.Conflicts of interest
There are no conflicts to declare.Acknowledgements
V. Preziosi gratefully acknowledges funding from the PRIN 2022 project: “A lab-on-a-chip integrated with electrochemical transistors for cardiac biomarkers evaluation in human blood” (LifeBlood) - Prot. 2022KTJLHL. M. V. Maiorino and G. Caiazza would like to acknowledge the Erasmus plus Traineeship programme for funding their research activities at the University of Manchester. Carmine D’Agostino would like to acknowledge the EPSRC grant no. EP/V026089/1 for funding his research activities.References
- E. Dickinson, Food Hydrocolloids, 2012, 28, 224–241 CAS.
- N. Luo, A. Ye, F. M. Wolber and H. Singh, Food Hydrocolloids, 2019, 92, 19–29 CrossRef CAS.
- D. Lin, A. L. Kelly and S. Miao, Trends Food Sci. Technol., 2020, 102, 123–137 CrossRef CAS.
- L. Mao, Y. H. Roos and S. Miao, J. Agric. Food Chem., 2014, 62, 11420–11428 CrossRef CAS PubMed.
- F. L. Buchholz and A. T. Graham, Modern superabsorbent polymer technology, Wiley-VCH, 1998 Search PubMed.
- L. Brannon-Peppas and R. S. Harland, Absorbent polymer technology, Elsevier, 2012 Search PubMed.
- Y. Li, G. Huang, X. Zhang, B. Li, Y. Chen, T. Lu, T. J. Lu and F. Xu, Adv. Funct. Mater., 2013, 23, 660–672 CrossRef CAS.
- B. Amsden, Macromolecules, 1998, 31, 8382–8395 CAS.
- B. D. Ratner, Pergamon Press plc, Compr. Polym. Sci., 1989, 7, 201–247 Search PubMed.
- N. A. Peppas and R. Korsmeyer, Hydrogels Med. Pharm., 1987, 3, 109–136 CAS.
- M. K. Yazdi, A. Taghizadeh, M. Taghizadeh, F. J. Stadler, M. Farokhi, F. Mottaghitalab, P. Zarrintaj, J. D. Ramsey, F. Seidi and M. R. Saeb, J. Controlled Release, 2020, 326, 523–543 CrossRef PubMed.
- M. Youssefi Azarfam, M. Nasirinezhad, H. Naeim, P. Zarrintaj and M. Saeb, J. Compos. Sci., 2021, 5, 125 Search PubMed.
- Y. Hu, Y. Kim, I. Hong, M. Kim and S. Jung, Polymers, 2021, 13, 2049 CAS.
- F. Jiang, X.-W. Xu, F.-Q. Chen, H.-F. Weng, J. Chen, Y. Ru, Q. Xiao and A.-F. Xiao, Mar. Drugs, 2023, 21, 299 CrossRef CAS PubMed.
- Y. Wu, S. Joseph and N. Aluru, J. Phys. Chem. B, 2009, 113, 3512–3520 CrossRef CAS PubMed.
- E. Axpe, D. Chan, G. S. Offeddu, Y. Chang, D. Merida, H. L. Hernandez and E. A. Appel, Macromolecules, 2019, 52, 6889–6897 CrossRef CAS PubMed.
- B. G. Amsden, Macromolecules, 2022, 55, 8399–8408 CrossRef CAS.
- G. Colafemmina, H. Mateos and G. Palazzo, Curr. Opin. Colloid Interface Sci., 2020, 48, 109–120 CrossRef CAS.
- C. D'Agostino, V. Preziosi, A. Khan, M. Mantle, E. Fridjonsson and S. Guido, J. Colloid Interface Sci., 2019, 551, 138–146 CrossRef PubMed.
- C. D’Agostino, V. Preziosi, G. Caiazza, M. V. Maiorino, E. Fridjonsson and S. Guido, Soft Matter, 2023, 19, 3104–3112 RSC.
- C. Malmborg, D. Topgaard and O. Söderman, J. Colloid Interface Sci., 2003, 263, 270–276 CrossRef CAS PubMed.
- X. Guan, K. Hailu, G. Guthausen, F. Wolf, R. Bernewitz and H. P. Schuchmann, Eur. J. Lipid Sci. Technol., 2010, 112, 828–837 CrossRef CAS.
- R. Bernewitz, X. Guan, G. Guthausen, F. Wolf and H. Schuchmann, Magnetic resonance in food science: an exciting future, RSC Publishing Cambridge, Clermont-Ferrant, 2011, 39–46 Search PubMed.
- L. Vermeir, P. Sabatino, M. Balcaen, A. Declerck, K. Dewettinck, J. C. Martins and P. Van der Meeren, J. Colloid Interface Sci., 2016, 463, 128–136 CrossRef CAS PubMed.
- S. Palit, S. K. Tadavani and A. Yethiraj, Soft Matter, 2018, 14, 448–459 Search PubMed.
- T. Fujiyabu, X. Li, U.-I. Chung and T. Sakai, Macromolecules, 2019, 52, 1923–1929 CrossRef CAS.
- W. Derbyshire and I. Duff, Faraday Discuss. Chem. Soc., 1974, 57, 243–254 RSC.
- F. Vaca Chávez, E. Persson and B. Halle, J. Am. Chem. Soc., 2006, 128, 4902–4910 CrossRef PubMed.
- J. Labille, N. Fatin-Rouge and J. Buffle, Langmuir, 2007, 23, 2083–2090 CrossRef CAS PubMed.
- J. C. Lindon, J. K. Nicholson and J. R. Everett, Annu. Rep. NMR Spectrosc., 1999, 38, 1–88 CrossRef CAS.
- L. Griffiths, R. Horton, I. Parker and R. C. Rowe, J. Colloid Interface Sci., 1992, 154, 238–248 CrossRef CAS.
- K. I. Momot and P. W. Kuchel, Concepts Magn. Reson., Part A, 2006, 28, 249–269 CrossRef.
- A. I. Romoscanu, A. Fenollosa, S. Acquistapace, D. Gunes, T. Martins-Deuchande, P. Clausen, R. Mezzenga, M. Nydén, K. Zick and E. Hughes, Langmuir, 2010, 26, 6184–6192 CAS.
- T. Splith and F. Stallmach, Magn. Reson. Imaging, 2019, 56, 52–56 CrossRef CAS PubMed.
- J. Pfeuffer, U. Flögel, W. Dreher and D. Leibfritz, NMR Biomed., 1998, 11, 19–31 CrossRef CAS PubMed.
- V. A. Makarov, B. K. Andrews, P. E. Smith and B. M. Pettitt, Biophys. J., 2000, 79, 2966–2974 CrossRef CAS PubMed.
- R. D'Apolito, A. Perazzo, V. Preziosi, M. D'Antuono, G. Tomaiuolo, R. Miller and S. Guido, Langmuir, 2018, 34, 4991–4997 CrossRef PubMed.
- T. W. Patzek, Bull. Sci. Technol. Soc., 2009, 29, 194–204 CrossRef.
- J. E. Tanner, J. Chem. Phys., 1970, 52, 2523–2526 CrossRef CAS.
- J. Kärger, M. Avramovska, D. Freude, J. Haase, S. Hwang and R. Valiullin, Adsorption, 2021, 27, 453–484 CrossRef.
- J. P. Hindmarsh, J. Su, J. Flanagan and H. Singh, Langmuir, 2005, 21, 9076–9084 CrossRef CAS PubMed.
- D. Weber, A. J. Sederman, M. D. Mantle, J. Mitchell and L. F. Gladden, Phys. Chem. Chem. Phys., 2010, 12, 2619–2624 RSC.
- G. Costantini, S. Capuani, F. A. Farrelly and A. Taloni, Sci. Rep., 2023, 13, 1703 CrossRef CAS PubMed.
- C. D'Agostino, R. Liuzzi, L. F. Gladden and S. Guido, Soft Matter, 2017, 13, 2952–2961 Search PubMed.
- Q. Zhang, A. Wang, Y. Meng, T. Ning, H. Yang, L. Ding, X. Xiao and X. Li, Anal. Chem., 2015, 87, 9810–9816 Search PubMed.
- P. Posocco, A. Perazzo, V. Preziosi, E. Laurini, S. Pricl and S. Guido, RSC Adv., 2016, 6, 4723–4729 Search PubMed.
Footnotes |
| † Electronic supplementary information (ESI) available. See DOI: https://doi.org/10.1039/d5sm00069f |
| ‡ These two authors contributed equally to this work and are co-first authors. |
| This journal is © The Royal Society of Chemistry 2025 |