 Open Access Article
Ni/Ce0.8Zr0.2O2−x solid solution catalyst: a pathway to coke-resistant CO2 reforming of methane†
Rubina
Khatun
a,
Rohan Singh
Pal
a,
Kapil
Bhati
a,
Anil Chandra
Kothari
ab,
Shivani
Singh
ab,
Nazia
Siddiqui
a,
Swati
Rana
a and
Rajaram
Bal
 *ab
*ab
aLight Stock Processing Division, CSIR-Indian Institute of Petroleum, Dehradun 248005, India. E-mail: raja@iip.res.in; Fax: +91 135 2660202; Tel: +91 135 2525917
bAcademy of Scientific and Innovative Research, Ghaziabad, Uttar Pradesh-201002, India
First published on 18th December 2024
Abstract
The CO2 reforming of methane effectively produces syngas using two prevalent greenhouse gases: CO2 and CH4. This study investigates the performance of three nickel-based catalysts, Ni/ZrO2, Ni/CeO2 and Ni/Ce0.8Zr0.2O2−x, in the DRM reaction. Each catalyst was thoroughly examined using a range of techniques, including XRD, TPR, BET, TPD, HR-TEM, Raman, O2-TPD, XPS, TGA and CO2-TPD to assess its structural and catalytic properties. The Ni/Ce0.8Zr0.2O2−x catalyst, combining the advantages of both supports to form a solid solution, achieved the best overall performance with enhanced activity and stability. Meanwhile, Ni/ZrO2 and Ni/CeO2 catalysts showed a tendency towards deactivation over extended reaction times. Characterization showed that incorporating zirconia into the CeO2 lattice led to the solid solution synthesis with a solely defective cubic fluorite phase, as confirmed by XRD and Raman analysis. The TPR and CO2-TPD revealed that the resulting Ni/Ce0.8Zr0.2O2−x catalyst possesses strong metal–support interaction and higher CO2 adsorption compared to pure CeO2 and ZrO2 samples. This composite support facilitated the generation of oxygen vacancies/active oxygen species, which are beneficial for reducing coke deposition. The Ni/Ce0.8Zr0.2O2−x catalyst demonstrated exceptional performance, achieving around 90.8% methane conversion and 91.0% CO2 conversion at 700 °C, with the resulting H2/CO ratio precisely equal to one. The stability test revealed remarkable stability against coke deposition for Ni/Ce0.8Zr0.2O2−x; meanwhile, Ni/ZrO2 and Ni/CeO2 are more susceptible to coke deposition, with the Ni/ZrO2 sample showing a greater tendency towards graphitic coke deposition. This study highlights the importance of catalyst supports in optimizing the performance of nickel-based catalysts for CO2 reforming applications.
Sustainability spotlightThe continuous increase in greenhouse gases, particularly carbon dioxide (CO2) and methane (CH4), has intensified global climate challenges. The CO2 reforming reaction is particularly important for mitigating climate change, as it converts CO2, a major greenhouse gas, into valuable products while also tackling the issue of methane emissions. DRM also offers a dual-purpose solution by converting the two harmful gases into syngas, a valuable mixture of hydrogen and carbon monoxide and closes the loop on carbon emissions, turning pollutants into resources. This process reduces the levels of these potent greenhouse gases and provides an efficient pathway to produce cleaner fuels and chemicals. This process aligns with several UN SDGs, including SDG 7, SDG 9, and SDG 13, contributing to a more sustainable and circular economy. |
Introduction
CO2 reforming/dry reforming of methane (DRM) has emerged as a pivotal reaction for the simultaneous production of H2 and CO (syngas). This process not only provides a means to utilize greenhouse gases but also contributes to the production of essential chemicals and fuels.1,2 The reaction is particularly significant for mitigating climate change by transforming CO2, a major greenhouse gas, into useful products while simultaneously addressing the challenge of methane emissions.3–5 Although, DRM offers benefits in terms of the environment and economy, a lack of highly active and coke-resistant catalysts hinders its commercial implementation on a large scale.6,7 Several catalysts have been developed to tackle this obstacle.4,8–10 Precious metals (Pt, Rh, Ru and Ir) are too expensive to be used widely due to their high cost. Ni-based catalysts are considered good substitutes due to their low cost and great capacity to activate C–H bonds.11,12 However, the strong endothermic characteristics of DRM involve a high temperature for the reaction, which is associated with the critical disadvantages of carbon deposition and sintering, issues that Ni-based catalysts encounter.13–15Creating a reliable Ni-based catalyst for real-world industrial applications is essential. This process may require fine-tuning of several aspects, including the dispersion of active metal, the interactions between the metal and its support, the size of particles, the production of reactive oxygen species through defect formation, and the choice of suitable active metals, promoters and supports.10,16 The uniform dispersion of active sites across the catalyst surface has been demonstrated to reduce coking by eliminating faceted Ni surfaces.17–20 S. Ali and their group found that Ni/alumina catalysts prepared via the combustion method demonstrated significantly less coking compared to impregnated catalysts.21 The high dispersion of Ni0 species on the Ni/CeZrAl catalyst, combined with abundant oxygen vacancies and basic sites, promoted disordered carbon formation while protecting Ni active sites.22 MV Grabchenko and their group found that the Ni/CeMnOx/SBA-15 catalyst reduces coke formation compared to unmodified Ni/SBA-15, because of the high amount of reactive superoxo (O2−) and peroxo (O−) species.23
The catalyst's effectiveness was attributed to its enhanced oxygen vacancies and strong metal–support interactions. The Ga-doped Ni/CeO2 catalyst enhances CO2 adsorption and activation, generating sufficient oxygen species to prevent carbon deposition and maintain catalytic activity, leading to superior stability and performance.24 The defect-rich Pt–Ni/CeO2 catalyst in DRM features abundant oxygen vacancies (OV), facilitating CO2 adsorption and its simultaneous dissociation into CO and O*. This mechanism contributes to the catalyst's exceptional stability against coke deposition.16 The development of more facile oxygen vacancies (OV) in the defect-rich Pt/CeO2 catalyst accelerates DRM at low-temperatures, as observed by Shen et al.25 R. Babakouhi et al. recently observed that adding 10 wt% CeO2 markedly enhanced nickel dispersion and strengthened the interaction with the support.26
For DRM, numerous supports are employed, including CeO2, ZrO2, La2O3, MgO, TiO2, SiC, boron nitride (BN), Al2O3, SiO2, zeolite and metal–organic frameworks (MOFs).27 Each support offers distinct chemical properties: CeO2 is recognized for its exceptional ability to store oxygen; La2O3 and TiO2 are recognized for their oxygen mobility; ZrO2 and BN provide exceptional thermal stability.27–31 These properties collectively contribute to the reduction of carbon deposition.27 Coke formation is also minimized on materials with high oxygen storage capacities (OSCs) due to interactions between lattice oxygen and adsorbed carbon species.32 The oxygen vacancies (OV) in CeO2 are generated by reducing Ce4+ to Ce3+ and can be replenished by dissociating CO2, which helps prevent coke deposition and extend the catalyst's lifespan during DRM.16,33 Ceria readily integrates with transition metals and other rare-earth elements to form solid solutions. The introduction of smaller cations (e.g., Si4+ and Zr4+) and lower valence metal ions (e.g., Ni2+ and Sm3+) into the ceria lattice creates additional OV through lattice distortion, enhancing oxygen ion mobility and improving low-temperature catalytic activity.2,16,34
Ceria's high oxygen storage capacity (OSC) allows it to release and re-oxidize oxygen efficiently but this capacity decreases at elevated temperatures and under reductive conditions. At the same time, zirconium stabilizes ceria by creating a CeO2–ZrO2 solid solution that enhances its thermal resistance, catalytic activity and OSC.35,36 Zr4+ doping into ceria generates structural distortions and defects that enhance its catalytic performance, with CeO2–ZrO2 composites being particularly effective as three-way catalysts.32,36 The oxygen volume diffusion coefficient of this support is generally double that of pure ceria.37 The Ni/CeO2–ZrO2 (Ni–CZ) catalyst synthesized via a one-pot procedure enhances Ni–CZ interaction, yielding smaller Ni nanoparticles, high dispersion and abundant oxygen vacancies, which promote coke gasification on the Ni surface.38 High concentrations of Zr lead to a transformation from the fluorite structure to a tetragonal phase, which decreases the oxygen storage capacity (OSC) of the support.39 Enhanced anti-sintering properties, excellent oxygen storage capacity, and strong thermal stability make CeO2–ZrO2 solid solutions a promising support material that has garnered significant attention.18,32,40–42
Herein, we aim to create a composite material that not only retains a sufficient level of oxygen storage but also significantly improves thermal stability. In this study, we demonstrate a novel and straightforward one-pot complex combustion method, utilizing citric acid, to synthesize a distorted cubic fluorite phase of the Ni/Ce0.8Zr0.2 solid solution catalyst with increased oxygen vacancies. This combination not only facilitates efficient methane activation and CO2 conversion but also addresses issues related to catalyst deactivation, making it a valuable component in advancing DRM technology for sustainable energy solutions. Ni/CeO2 and Ni/ZrO2 catalysts were also synthesized using a similar method for comparable activity towards DRM.
Experimental
Catalyst preparation
The Ni/ZrO2, Ni/CeO2 and Ni/CeO2–ZrO2 catalysts were prepared using a straightforward one-pot complex combustion method. Specifications of the materials employed and the detailed synthesis procedure can be found in the ESI (S1.1 and S1.2).† The final catalysts, Ni/ZrO2, Ni/CeO2 and Ni/Ce0.8Zr0.2O2−x, with 5 wt% Ni loading were designated as 5NZ, 5NC and 5NCZ, respectively. We also prepared 2.5 and 7.5 wt% Ni/Ce0.8Zr0.2O2−x catalysts to optimize the nickel loading for DRM, designated as 2.5NCZ and 7.5NCZ, respectively.Catalyst characterization
The synthesized catalysts have been extensively analyzed using a variety of techniques. These included powder X-ray diffraction (XRD) for structural analysis, surface area measurements and H2-temperature programmed reduction (H2-TPR) to evaluate reduction properties and metal–support interactions. High-resolution transmission electron microscopy (HR-TEM) provided insights into the morphology, while X-ray photoelectron spectroscopy (XPS) was used to assess surface chemical states. Additional analysis included O2 and CO2 temperature-programmed desorption (O2-TPD and CO2-TPD, respectively) to study adsorption and desorption behaviors. Raman spectroscopy was employed to investigate vibrational modes and structural defects and thermogravimetric analysis (TGA) was used for thermal stability/coke study assessment. Detailed descriptions of these characterization methods and procedures can be found in the ESI.†Catalytic activity
The activity test for CO2 reforming of methane was conducted at atmospheric pressure using a fixed bed down flow reactor. A comprehensive description of the procedure is available in the ESI.† The conversions were calculated using eqn (1) and (2) and the syngas ratio was determined using eqn (3) | (1) |
 | (2) |
 | (3) |
Results and discussion
Catalyst characterization
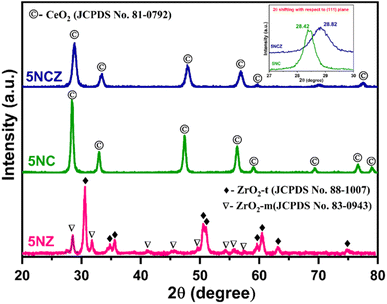
Fig. 1 illustrates the XRD patterns of fresh 5NZ, 5NC and 5NCZ catalysts. The XRD pattern of the 5NZ catalyst exhibits characteristics peaks of both monoclinic (ZrO2-m) and tetragonal (ZrO2-t) phases of ZrO2.43–46 The tetragonal phase is identified by distinct diffraction peaks at 2θ values of approximately 30.5°, 34.7°, 35.6°, 50.5°, 50.9°, 59.6°, 60.4°, 63.1° and 74.7° (JCPDS card no. 88-1007).41,45,47 Meanwhile, the monoclinic phase is identified by the diffraction peaks at 2θ values of approximately 28.4°, 31.7°, 41.1°, 35.5°, 41.2°, 45.6°, 49.5°, 54.1°, 55.8° and 57.3° (JCPDS card no. 83-0943).44,46 However, the tetragonal phase is more predominant than the monoclinic phase. The XRD pattern of fresh 5NC and 5NCZ catalysts exhibits the distinct cubic fluoride phase of CeO2 having the Fm![[3 with combining macron]](https://www.rsc.org/images/entities/char_0033_0304.gif) m space group.48 The major peaks for 5NC were observed at 28.4°, 33.1°, 42.6°, 47.5°, 56.3°, 59.1°, 69.4°, 76.7° and 79.1° (JCPDS card no. 81-0792).16 It is important to highlight that the diffraction pattern of the 5NCZ catalyst shows a single phase of cubic fluorite CeO2 with a slight shift towards higher 2θ values. This indicates the creation of a CeO2–ZrO2 solid solution. Additionally, the diffraction pattern of the 5NCZ sample does not show any peaks associated with ZrO2 phases.
m space group.48 The major peaks for 5NC were observed at 28.4°, 33.1°, 42.6°, 47.5°, 56.3°, 59.1°, 69.4°, 76.7° and 79.1° (JCPDS card no. 81-0792).16 It is important to highlight that the diffraction pattern of the 5NCZ catalyst shows a single phase of cubic fluorite CeO2 with a slight shift towards higher 2θ values. This indicates the creation of a CeO2–ZrO2 solid solution. Additionally, the diffraction pattern of the 5NCZ sample does not show any peaks associated with ZrO2 phases.
The inset of Fig. 1 provides a close-up view of the most intense (111) plane for the 5NC and 5NCZ catalysts. For the 5NCZ catalyst, peaks were detected at 2θ values of 28.82°, 33.4°, 43.0°, 47.9°, 56.8°, 59.5°, 70.1°, and 77.5°, which are notably higher than the corresponding 2θ Bragg angles for the 5NC catalyst. The shift toward higher Bragg angles indicates the inclusion of Zr4+ into the CeO2 lattice. This substitution results in a decrease in interplanar spacing and lattice strain, as the smaller Zr4+ ions (0.84 Å) replace the larger Ce4+ ions (0.97 Å) within the lattice.41,49 Lattice distortion, involving contraction or deformation, often results in oxygen vacancies, enhancing the oxygen storage capacity and oxygen mobility.48,49 The crystallite sizes of 5NZ, 5NC and 5NCZ catalysts were estimated to be 17.1 nm, 15.7 nm and 10.8 nm, respectively. The XRD patterns of the 30-hour spent 5NZ, 5NC, and 5NCZ samples are displayed in Fig. S1 (ESI†). The spent 5NC and 5NCZ catalysts show no significant changes in their XRD patterns. However, metallic Ni (JCPDS card no. 87-0712) is detected in the 5NC and 5NCZ catalysts, while NiO (JCPDS card no. 78-0643) appears in the 5NZ catalyst. Notably, the 5NCZ catalyst exhibits significantly lower diffraction peak intensity compared to 5NC and 5NZ, indicating superior thermal stability.
Table 1 presents the BET surface area and Ni content (determined by ICP-AES) for each synthesized catalyst, offering key insights into their catalytic performance. The results indicate that the elemental composition of all catalysts is in close agreement with the nominal input values. The BET surface area of the fresh catalyst ranges from 44 to 49 m2 g−1, with only minor variations. After the reaction, the 5NZ catalyst showed the greatest decrease in surface area, followed by 5NC, while the 5NCZ catalyst exhibited a minimal decrease. This indicates superior stability, likely due to the formation of a CeO2–ZrO2 solid solution.
| Catalyst | Ni loading (%) in fresh samples | BET surface area (m2 g−1) | |
|---|---|---|---|
| Fresh | Spent (30 h) | ||
| 5NZ | 4.97 | 44 | 17 |
| 5NC | 4.94 | 40 | 28 |
| 5NCZ | 4.93 | 49 | 41 |
The TEM/HR-TEM images of the reduced 5NCZ sample are displayed in Fig. 2a–c. The catalyst displayed irregular spherical nanoparticles that are closely interconnected (Fig. 2a). Statistical analysis (inset of Fig. 2a) of the particle sizes indicated that the nanoparticles have an average size of 8.5 nm ranging from 6 to 12 nanometers, suggesting a fairly uniform size distribution. Additionally, the lattice fringes observed in the TEM image provided insights into the crystal structure of both Ce0.8Zr0.2O2−x and Ni nanoparticles. The lattice fringes with d-spacing values of 0.27 and 0.31 nm, as shown in Fig. 2b and c, correspond to the (200) and (111) planes of cerium oxide, respectively, within the crystal lattice. Additionally, the d spacing value of 0.20 nm, visible in Fig. 2c, is associated with the interplanar spacing of the (111) planes of Ni0 species.
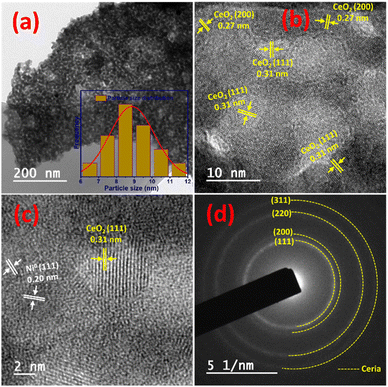 | ||
| Fig. 2 TEM image (a), HR-TEM images (b and c) and the SAED pattern (d) of the freshly reduced 5NCZ catalyst. | ||
The selective area electron diffraction (SAED) pattern further validated the crystalline nature and cubic fluorite phase of CeO2 oxide, as illustrated in Fig. 2d. Elemental mapping of the 5NCZ catalyst exhibited the homogenous and uniform distribution of Ce, Zr, Ni and O elements, as shown in Fig. S2.† The TEM images and SAED pattern of spent (30 h) 5NCZ are depicted in Fig. 2a–c, respectively, showing no significant changes in morphology and coke deposition. The cubic fluorite phase is also consistent in the spent catalyst, as illustrated by the SAED pattern.
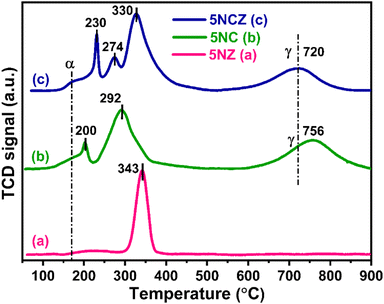
The H2-TPR profiles of the 5NZ, 5NC and 5NCZ catalysts were acquired to obtain insights into the reducibility and the metal–support interactions. These patterns are illustrated in Fig. 3. The TPR graphs of all the samples displayed a broad peak (α), which may be ascribed to the H2 consumption by active oxygen species (O22− and O2−) adsorbed at oxygen vacancy sites. Active oxygen species are formed as a result of incorporating low-valent/small cations into the ceria lattice, and these species can be reduced at low temperatures.16,50,51 For the 5NZ catalyst, a single peak observed at 343 °C corresponds to the reduction of strongly interacting NiO with the ZrO2 support.52 ZrO2 is a non-reducible support; hence no further peaks were observed for the 5NZ catalyst.52,53 The reduction patterns of the 5NC and 5NCZ catalysts show multiple peaks corresponding to the reduction of NiO species with varying degrees of interaction. The 5NC catalyst exhibits two peaks at 200 and 292 °C, which are attributed to the reduction of well-dispersed and strongly interacting NiO species, respectively. In contrast, the 5NCZ catalyst displays three peaks at 230, 274 and 330 °C. The first two peaks correspond to the reduction of well-dispersed NiO species, while the high-temperature peak is associated with NiO species exhibiting strong metal–support interactions.54 The elevated temperature observed for the 5NCZ catalyst, compared to the pure ceria sample (5NC), suggests a strong metal–support interaction, likely due to the incorporation of zirconia.
According to J. Lin et al., the high-temperature peak typically reflects strong interactions between Ni and the support.40,55 In such samples, NiO initially occupies the most active surface sites of the support, forming a thermodynamically stable state, and its uniform dispersion on the support makes it more resistant to reduction, resulting in higher reduction temperatures.40,56 Based on the reduction temperatures and patterns of NiO species shown in Fig. 3, the 5NCZ catalyst exhibits a greater degree of strong metal–support interaction compared to the others. Furthermore, 5NC and 5NCZ catalysts also show a higher temperature reduction peak, denoted as γ, which is attributed to the reduction of bulk oxygen of CeO2 and Ce0.8Zr0.2O2−x supports, respectively. The lower reduction temperature (720 °C) for bulk oxygen in the 5NCZ catalyst compared to the 5NC (756 °C) catalyst, indicates easier bulk oxygen reduction. This ease of reduction could be due to the incorporation of Zr4+ into the ceria lattice, which enhances oxygen mobility and reduces the energy required to remove lattice oxygen. The total H2 consumption for all the catalysts is categorized into two regions, 100–500 °C and 500–900 °C, attributed to the H2 consumption by the NiO species along with active oxygen species and lattice oxygen, respectively (Table S1†).
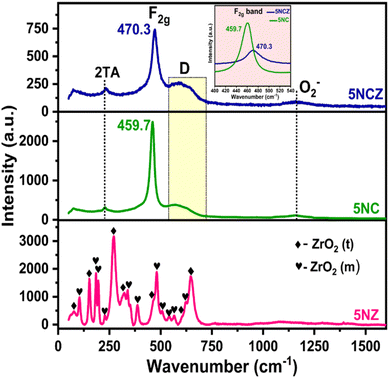
Raman spectra provide a general overview of the detailed structural insights into defects and lattice distortions of the freshly synthesized catalysts, as shown in Fig. 4. The Raman spectra of pure Ni/ZrO2 (5NZ) reveal both tetragonal and monoclinic phases, corroborated by XRD results. The Raman-active bands at 75 (A1g), 149 (Eg), 272 (A1g), 320 (B1g), 470 (Eg), 602 (B1g) and 647 cm−1 (Eg) are attributed to the tetragonal phase.41,45,57 Meanwhile, the bands at 107 (Ag), 179 (Ag + Bg), 193 (Ag), 226 (Bg), 344 (Ag), 385 (Bg), 479 (Ag), 506 (Bg), 540 (Bg), 563 (Ag) and 620 cm−1 (Bg) are attributed to the monoclinic phase of ZrO2.57,58 In 5NC and 5NCZ catalysts, the most intense bands at 459.7 and 470.3 cm−1 are characteristic of the triply degenerate F2g mode, corresponding to the symmetrical stretching of the Ce–O bonds in the fluorite structure of CeO2.16,50,59 The presence of oxygen vacancies often leads to peak broadening and shifts in the F2g mode. Additional peaks or shoulders may appear due to local distortions and changes in the lattice symmetry caused by these vacancies.16,32,60 The peak broadening and gradual shift in the F2g band in the 5NCZ catalyst from 459.7 to 470.3 cm−1 reflect a cell contraction, which results from the incorporation of zirconia into the ceria lattice.61,62 Substitution of Ce4+ with Zr4+ shortened the Ce–O bond length, leading to a higher energy shift in the Raman spectra.41 The broad band in the 530–710 cm−1 range is observed in both 5NC and 5NCZ catalysts, with greater intensity in 5NCZ. This defect-induced band (D) arises from the symmetrical vibrations associated with oxygen vacancies.2,41,63 A weak 2TA band at 235 cm−1, indicative of defect-induced second-order scattering involving TA (transversal acoustic) phonon modes, is observed. This band, typically absent in pure ceria, supports the notion that the ceria lattice becomes defective due to solid solution formation.16,64 The integrated areas of the D and F2g bands (ID/IF2g ratio) reflect the strength of oxygen vacancies in 5NC and 5NCZ catalysts, with the ratio being higher for 5NCZ (0.29) compared to 5NC (0.18). The broad peak at ∼1170 cm−1 corresponds to vibrational modes specific to superoxide species.50,65
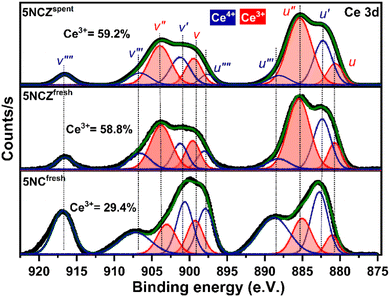
The chemical states of ceria-based catalysts and surface oxygen vacancies significantly influence the oxidation/reforming reactions. Fig. 5 shows the Ce 3d XPS spectra of 5NC and 5NCZ catalysts. The Ce 3d XPS spectra consist of two multiplets, labeled u and v, corresponding to the spin–orbit splitting of the 3d5/2 and 3d3/2 components.16,41 In the Ce 3d spectrum of ceria, contributions from Ce4+ and Ce3+ states can be distinguished, each showing distinct peaks. The Ce 3d spectra can be deconvoluted into ten peaks. Specifically, the two spin–orbit doublet peaks, identified as u, u′′, v, and v′′ correspond to the Ce3+ species (red color). Meanwhile, the remaining six peaks labeled u′, u′′′, u′′′′, v′, v′′′ and v′′′′ are associated with the Ce4+ species.2,41,50,61 The relative surface concentration of Ce3+ is estimated by XPS analysis using the following equation.
In this context, A(Ce3+) and A(Ce4+) denote the overall cumulative areas of the peaks associated with Ce3+ and Ce4+, respectively. The proportion of Ce3+ for the NCfresh catalyst was estimated to be 29.4%, which significantly increased to 58.8% in the NCZfresh catalyst after Zr doping. These findings suggest that incorporating Zr promotes the generation of Ce3+ on the surface of the CeO2 catalyst,66 which is associated to the formation of CeO2–ZrO2 solid solution.61 The substitution of Ce4+ ions (0.97 Å) in CeO2 with larger Ce3+ ions (1.10 Å) can offset the lattice contraction caused by the slightly smaller Zr4+ ions (0.84 Å).41,67 Interestingly, the Ce 3d core level XPS spectra of the spent 5NCZ catalyst exhibit no notable alterations in the fundamental spectra or Ce3+ concentration, demonstrating the exceptional stability of the 5NCZ catalyst.
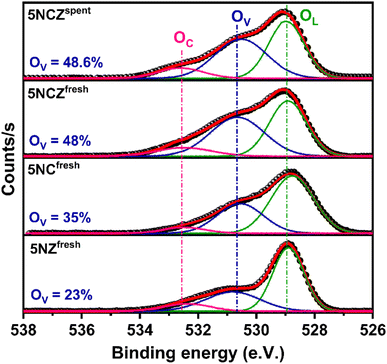
The chemical states (Ce3+ ratio) of ceria-based catalysts significantly influence the surface oxygen vacancies. Therefore, O 1s core level XPS was conducted for all the synthesized catalysts to gain further insights into the surface oxygen properties, as displayed in Fig. 6. The O 1s spectra can be deconvoluted into three distinct peaks, designated as OL at 529.0 eV, OV at 530.7 eV and OC at 532.6 eV, which correspond to lattice oxygen, oxygen vacancies and chemisorbed oxygen species, respectively.41,68 The amount of surface oxygen vacancies in the catalysts can be estimated by analyzing the integrated peak areas of all the distinct peaks using the following equation.
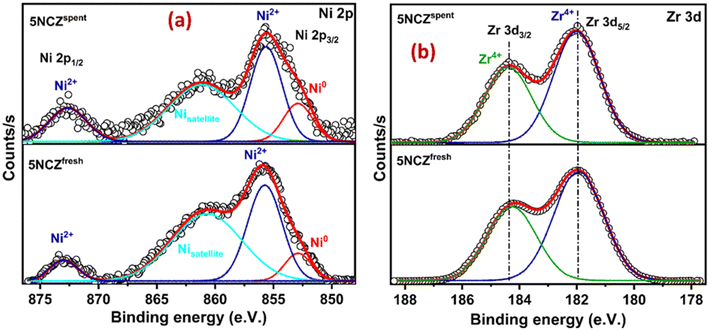
The Ni 2p core level and Zr 3d core level XPS spectra of the 5NCZ catalyst are shown in Fig. 7a and b, respectively. Two type of Ni species, Ni0 and Ni2+ species at the binding energy values at 852.8 and 855.7 eV, respectively, was observed in both the fresh and spent 5NCZ catalyst, as demonstrated in Fig. 7a.40,42 The slightly higher binding energy for Ni2+ (855.7 eV) compared to bulk NiO (854.2 eV) can be attributed to strong metal–support interactions. This increase in binding energy likely results from the incorporation of Ni2+ species into the host lattice.69 The peak that appeared at 861.3 eV is due to the satellite peak.
The core level XPS spectra of Zr 3d in Fig. 7b display two peaks at binding energies of 182.0 and 184.4 eV, corresponding to Zr4+ species present in both the fresh and spent 5NCZ catalysts.41,44 The energy separation between the Zr 3d5/2 and Zr 3d3/2 peaks is consistent with the value observed for Zr4+ (Δ = 2.4 eV).45 The binding energies values (182.0 and 184.4 eV) for Zr4+ species in the 5NCZ catalyst are slightly higher than those observed in pure ZrO2 (Fig. S4†), further confirming the hypothesis that Zr species have been incorporated into the ceria lattice, forming a CeO2–ZrO2 solid solution.67,70 The Zr 3d and Ni 2p core level XPS spectra of the spent 5NCZ catalyst closely resemble those of the fresh catalyst, with a minor increase in Ni0 content in the spent sample.
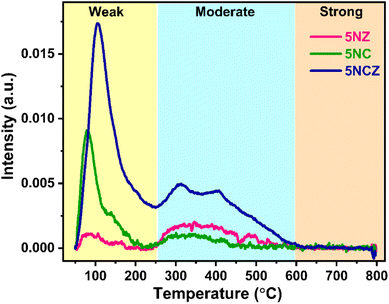
The surface basicity of catalysts plays a pivotal role in determining their efficiency in reactions such as CO2 hydrogenation and dry reforming of methane.2,71,72 To investigate the basic strength of the synthesized catalyst, CO2-TPD was performed, as shown in Fig. 8. The CO2-TPD profiles of the samples typically show multiple desorption peaks, reflecting the diversity of basic sites. The TPD profile, indicating the varying strengths of CO2 interaction with the catalyst surface, can be divided into three zones: weak basic sites (<250 °C), moderate basic sites (250–550 °C) and strong basic sites (>550 °C).50,73 All catalysts exhibited significant CO2 desorption in the weak and moderate regions, indicating the existence of weak and moderate basic sites on the catalyst surface. It should be noted that while all types of basic sites facilitate CO2 adsorption, weak and moderate sites are essential for CO2 adsorption, desorption and product formation. In contrast, strong basic sites, which are prone to coke formation, are less suitable for stable DRM reactions.5,16 The quantification of basic sites across these regions is detailed in Table 2. The 5NCZ catalyst possesses the highest number of total basic sites (75.5 μmol g−1), followed by the 5NC (23.7 μmol g−1) and 5NZ (12.9 μmol g−1) catalysts. The substantial increase in basic sites in the 5NCZ catalyst is attributed to the higher number of defects and oxygen vacancies. The quantity of basic sites aligns with the trend of these defect sites and vacancies.
| Catalyst | Quantity of basic sites (μmol g−1) | ||
|---|---|---|---|
| Weak region | Moderate region | Total amount of basic sites | |
| 5NZ | 2.2 | 10.7 | 12.9 |
| 5NC | 15.6 | 8.1 | 23.7 |
| 5NCZ | 54.1 | 21.4 | 75.5 |
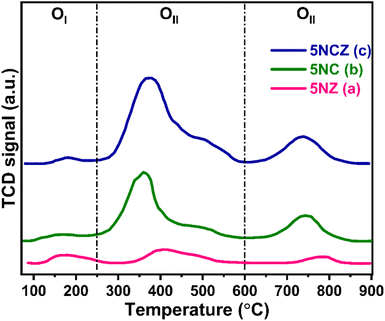
The catalyst's capacity to absorb oxygen is a critical factor in demonstrating enhanced activity. The O2-TPD desorption profile can differentiate the various oxygen species on the ceria surface, including surface oxygen, oxygen vacancies and lattice oxygen.50,74 In this context, the O2-TPD was performed for the 5NZ, 5NC and 5NCZ catalysts and the results are depicted in Fig. 9. The O2-TPD pattern reveals three distinct desorption regions: 100–250 °C for superficial or weakly bound oxygen, 250–600 °C for active oxygen species (O22− and O2−) at vacancy sites and above 600 °C for lattice oxygen (O2−).2,10,75 The quantification of oxygen species in each region, based on the integrated peak areas, is detailed in Table 3. The quantity of O2 desorbed in the OII region is directly proportional to the concentration of active oxygen species in that sample and follows the order: 5NCZ > 5NC > 5NZ.
| Catalyst | Quantity of desorbed oxygen in μmol g−1 | |||
|---|---|---|---|---|
| OI | OII | OIII | Total | |
| 5NZ | 3.9 | 7.6 | 2.7 | 14.2 |
| 5NC | 3.1 | 26.2 | 10.3 | 39.6 |
| 5NCZ | 2.5 | 47.3 | 12.1 | 61.9 |
Active oxygen species (O22− and O2−) serve as active centers for CH4 and CO2 activation to produce syngas selectively while inhibiting coke deposition.16,25 The trend in active oxygen species approximated by O2-TPD is consistent with the results from O 1s core level XPS and Raman analysis, reinforcing this conclusion. The amount of OII species estimated by O2-TPD was plotted against catalytic activity, to establish a correlation, where a linear relation was obtained (discussed later).
Catalytic performance
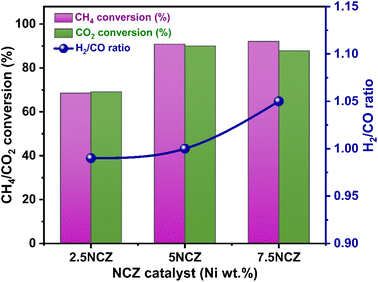
The catalytic performance and stability tests for CO2 reforming of methane were conducted to assess and compare the performance of all synthesized catalysts. Table S2† compares the synthesized catalysts with other reported Ni-based catalysts in terms of conversion, H2/CO ratio and stability. The impact of temperature was studied within the range of 400–800 °C. The results, focusing on feed conversion and the H2/CO ratio in syngas, are presented in Fig. 10a–c, respectively. Since, DRM is an endothermic reaction, higher feed conversions can only be achieved at elevated temperatures.4 As the temperature rises, the conversion rates of CO2 and CH4 progressively increase. The 5NZ catalyst demonstrated the lowest conversion rate, whereas the 5NC catalyst exhibited a marginally higher conversion rate across all temperatures. However, the 5NCZ catalyst achieved the highest conversion rate and an improved H2/CO ratio compared to both the 5NC and 5NZ catalysts, indicating that a significant synergistic effect occurred after incorporating ZrO2 into the ceria lattice. The anticipated value of the H2/CO ratio in the DRM reaction is one; however, at low temperatures, the H2/CO ratio is <1, as illustrated in Fig. 10c. A low H2/CO ratio (<1) suggests the occurrence of the reverse water gas shift reaction (RWGS), which is further evidenced by the higher CO2 conversion compared to CH4 at lower temperatures.4,31 As the temperature increases, the syngas ratio improves, with DRM becoming the dominant reaction at 700 °C, resulting in an H2/CO ratio close to unity. However, at higher temperatures, methane decomposition becomes more favorable, leading to a syngas H2/CO ratio greater than one.2,16 The H2 and CO selectivity of the synthesized catalysts at 700 °C is shown in Fig. S6.†Fig. 11 illustrates the effect of nickel loading (wt%) on feed conversion and H2/CO in the Ni/Ce0.8Z0.2O2−x (NCZ) catalyst. The NCZ catalyst was prepared by varying the Ni wt% from 2.5–7.5% for comparison purposes. The H2 and CO selectivity of 2.5NCZ, 5NCZ and 7.5NCZ at 700 °C is provided in Fig. S7.† The feed conversion and H2/CO ratio increase when Ni loading increases from 2.5 to 5 wt%, but beyond this point, there is no significant increase in feed conversion. However, the H2/CO ratio increases, resulting from high methane conversion compared to CO2. Hence, 5 wt% Ni is considered as optimum loading.
It is essential to highlight that oxygen vacancies (OV)/active oxygen species (OII) are pivotal in influencing both the catalytic activity and the syngas selectivity in DRM.16 The catalytic activity, in terms of conversion rates, showed a linear relationship with the concentrations of OV and OII species, which were determined from O 1s XPS and O2-TPD analysis, respectively. This investigation was conducted to elucidate the structure–activity relationship, as depicted in Fig. 12a and b. The 5NCZ catalyst, which contains a higher amount of OV and OII species, exhibited the highest conversions.
 | ||
| Fig. 12 Structure–activity correlation: oxygen vacancy (OV) ratio vs. CH4 and CO2 conversion (a) and oxygen species (OII) ratio vs. CH4 and CO2 conversion (b). | ||
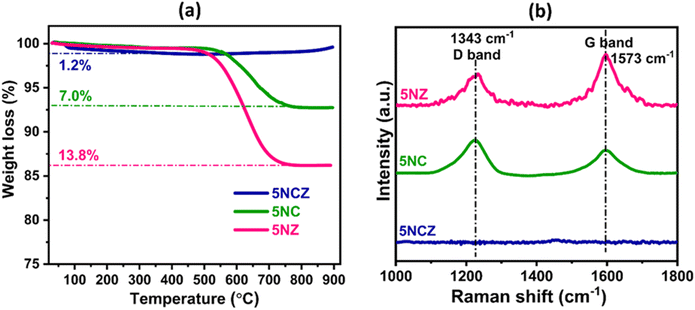
The time-on-stream (TOS) test was conducted to check the stability of the synthesized catalyst. Fig. S5(a and b)† show the 30 h TOS test over the 5NZ, 5NC and 5NCZ catalysts. The 5NCZ catalyst showed stable performance throughout the reaction, while 5NZ and 5NC catalysts showed a significant decrease in their activity. The 5NC catalyst exhibited lower deactivation compared to 5NZ. The 5NZ catalyst showed decreases of ∼15.8% and 18% in methane and CO2 conversion while the 5NC catalyst showed decreases of 10.2% and 11.4% in methane and CO2 conversion, respectively. The cause of deactivation was determined through coke analysis. The TGA pattern of the spent samples (30 h) are provided in Fig. 13a. The analysis reveals weight losses of 1.2%, 7.0%, and 13.8% for the 5NCZ, 5NC, and 5NZ catalysts, respectively. The 5NCZ catalyst experiences a modest 1.2% weight loss up to ∼350 °C, likely due to the removal of physically adsorbed water or moisture,15 with no further weight loss observed beyond this point. Interestingly, a slight weight gain is observed above 400 °C, which could be attributed to the oxidation of Ni0 and ceria in the presence of oxygen environment. For the 5NC and 5NZ catalysts, weight loss continues up to 750 °C, which is indicative of coke removal.54 To further explore the nature of the deposited coke, Raman analysis was conducted and the results are shown in Fig. 13b. The 5NCZ catalyst exhibited no significant bands, reinforcing that the 1.2% weight loss is likely due to the desorption of water. Conversely, the 5NC and 5NZ catalysts exhibit both D and G bands at approximately 1343 and 1573 cm−1, respectively. The D band corresponds to disordered or amorphous coke, while the G band is related to ordered or graphitic coke.40,76 The ID/IG ratio, which indicates the extent of graphitization,40 is estimated to be 1.38 for the 5NC catalyst and 0.62 for the 5NZ catalyst. The lower ID/IG ratio for the 5NZ catalyst suggests a higher degree of graphitization.40 The 5NC catalyst, with a high ID/IG ratio, demonstrates that the ceria support effectively reduces the formation of graphitic coke.
The 5NCZ catalyst exhibited remarkable activity, approximately 90.8% and 91.0% conversion of methane and CO2, respectively, with an H2/CO ratio of unity at 700 °C. Therefore, a 100 h TOS stability test was performed over the 5NCZ catalyst, as shown in Fig. 14. The catalyst demonstrated consistent activity up to 100 h without any significant deactivation, showing the excellent stability of the 5NCZ catalyst. The schematic presentation of the reaction set-up for dry reforming of methane is shown in Fig. S8.†
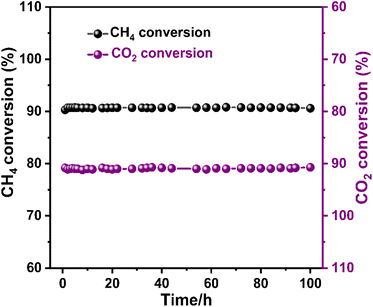 | ||
Fig. 14 100 h stability test over the 5NCZ catalyst (reaction condition: temperature-700 °C, pressure-1 atm, GHSV-50![[thin space (1/6-em)]](https://www.rsc.org/images/entities/char_2009.gif) 000 mL g−1 h−1, and feed ratio CH4 000 mL g−1 h−1, and feed ratio CH4![[thin space (1/6-em)]](https://www.rsc.org/images/entities/char_2009.gif) : :![[thin space (1/6-em)]](https://www.rsc.org/images/entities/char_2009.gif) CO2 CO2![[thin space (1/6-em)]](https://www.rsc.org/images/entities/char_2009.gif) : :![[thin space (1/6-em)]](https://www.rsc.org/images/entities/char_2009.gif) N2-1 N2-1![[thin space (1/6-em)]](https://www.rsc.org/images/entities/char_2009.gif) : :![[thin space (1/6-em)]](https://www.rsc.org/images/entities/char_2009.gif) 1 1![[thin space (1/6-em)]](https://www.rsc.org/images/entities/char_2009.gif) : :![[thin space (1/6-em)]](https://www.rsc.org/images/entities/char_2009.gif) 8). 8). | ||
In the 5NCZ catalyst, Ni sites are responsible for activating CH4 by breaking C–H bonds, while the CeO2–ZrO2 support offers oxygen storage and release capacity, promotes CO2 activation and resists coke formation. For the plausible mechanism of DRM over the 5NCZ (5% Ni/Ce0.8Zr0.2O2−x) catalyst, CH4 activation and CO2 activation are the two crucial steps which lead to the product formation. Methane molecules can adsorb onto the Ni sites, where dissociative adsorption occurs via C–H bond elongation from the reactant state to the transition state, leading to the formation of CHx (x = 1–3) species and hydrogen. The metallic Ni sites facilitate the cleavage of the C–H bond due to their excellent catalytic properties for hydrocarbon activation.2,77,78
Similar to CH4 activation, the activation of CO2 is also important for catalyst activity in the DRM reaction. CO2 adsorption and activation occur predominantly at the Ce0.8Zr0.2O2−x support, particularly at oxygen vacancy sites. Our recent study revealed that CO2 is adsorbed and activated at the oxygen vacancies, leading to the formation of CO and O* species (active oxygen species).16 This step is crucial for generating active oxygen species (O*) that assist in methane reforming and carbon removal. These O* species generated on the Ce0.8Zr0.2O2−x surface readily react with CHx species or carbon deposits on the Ni surface, preventing catalyst deactivation and promoting the formation of CO.77 Concurrently, hydrogen atoms produced during methane dissociation recombine at Ni sites to form H2 molecules. The reaction proceeds through the continuous interaction of dissociated CHx species with oxygen intermediates, yielding CO and H2 as the primary products. The stability of the Ce0.8Zr0.2O2−x support ensures sustained generation and utilization of oxygen vacancies throughout the reaction.
Conclusion
This research focuses on exploring the performance of 5% Ni/ZrO2 (5NZ), 5% Ni/CeO2 (5NC), and 5% Ni/Ce0.8Zr0.2O2−x (5NCZ) catalysts synthesized by a straightforward one-pot complex combustion method for CO2 reforming of methane (DRM). The 5NZ catalyst demonstrated moderate activity for DRM, but suffered from significant deactivation over time, attributed to rapid sintering of nickel particles and carbon deposition. The 5NC catalyst showed improved stability and higher activity compared to the 5NZ catalyst. The presence of ceria enhanced the redox properties of the catalyst, promoting better oxygen mobility and preventing excessive carbon deposition, especially graphitic carbon, as shown by Raman analysis. The high ID/IG ratio in the 5NC catalyst compared to 5NZ catalyst indicated lower degree of graphitization. The 5NCZ catalyst, combining both ceria and zirconia, exhibited the best overall performance among the three. The 5NCZ showed 90.8% and 91.0% methane and CO2 conversion, respectively, with a H2/CO ratio of one at 700 °C. These dual-functional catalysts benefited from the synergistic effects of ceria and zirconia, leading to better thermal stability and redox properties. The performance improvement in the 5NCZ sample is attributed to the formation of a CeO2–ZrO2 solid solution. The formation of the solid solution was validated by the XRD and Raman analysis, as no peaks/bands attributed to ZrO2 species were observed. The progressive shift in the 2θ Bragg angle compared to the pure CeO2 sample (28.42–28.82°) confirmed the lattice contraction and decrease in crystallite size. A shift towards higher binding energy for Zr 3d core level XPS spectra compared to the pure ZrO2 sample, further confirms the inclusion of Zr species into the ceria lattice. The formation of the CeO2–ZrO2 solid solution remarkably enhanced oxygen vacancies and OII species. Incorporating zirconia also enhanced the metal–support interaction and increased both the quantity and strength of basic sites. The resulting catalyst not only showed superior activity but also maintained stability and selectivity for an extended period (100 h), making it the most effective choice for DRM among the tested catalysts.Data availability
All data supporting the findings of this study are available within the article and its ESI.† Additional data related to this study will be made available on suitable request.Author contributions
Rubina Khatun – designed and performed the experiments for the research work, manuscript writing, editing and correction; Rohan Singh Pal – reaction analysis and catalyst characterization; Kapil Bhati, Anil Chandra Kothari, Shivani Singh, Nazia Siddiqui, and Swati Rana contributed in catalyst characterization; Rajaram Bal – conceptualization and design of the whole study, design of experiments for the research work, manuscript correction.Conflicts of interest
The authors declare no conflicts of interest.Acknowledgements
R. K. thanks CSIR, New Delhi, India, R. S. P. and S. S. thank UGC, New Delhi, India and A. C. K. thanks DST-INSPIRE, New Delhi, India, for fellowship support. R. B. and all the authors are grateful to the Analytical Science Division, Indian Institute of Petroleum, for providing analytical support.References
- M. Li and A. C. van Veen, Appl. Catal., B, 2018, 237, 641–648 CrossRef CAS.
- R. Khatun, N. Siddiqui, R. S. Pal, S. Bhandari, T. S. Khan, S. Singh, M. K. Poddar, C. Samanta and R. Bal, Catal. Sci. Technol., 2023, 13, 6431–6445 RSC.
- B. Erdogan, H. Arbag and N. Yasyerli, Int. J. Hydrogen Energy, 2018, 43, 1396–1405 CrossRef CAS.
- M. Shah, S. Das, A. K. Nayak, P. Mondal and A. Bordoloi, Appl. Catal., A, 2018, 556, 137–154 CrossRef CAS.
- R. Zhou, M. Mohamedali, Y. Ren, Q. Lu and N. Mahinpey, Appl. Catal., B, 2022, 316, 121696 CrossRef CAS.
- T. G. de Araújo Moreira, J. F. S. de Carvalho Filho, Y. Carvalho, J. M. A. R. de Almeida, P. N. Romano and E. F. Sousa-Aguiar, Fuel, 2021, 287, 119536 CrossRef.
- Z. Liu, D. C. Grinter, P. G. Lustemberg, T. D. Nguyen-Phan, Y. Zhou, S. Luo, I. Waluyo, E. J. Crumlin, D. J. Stacchiola and J. Zhou, Angew. Chem., Int. Ed., 2016, 55, 7455–7459 CrossRef CAS.
- Y. Song, E. Ozdemir, S. Ramesh, A. Adishev, S. Subramanian, A. Harale, M. Albuali, B. A. Fadhel, A. Jamal and D. Moon, Science, 2020, 367, 777–781 CrossRef CAS.
- M. Akri, S. Zhao, X. Li, K. Zang, A. F. Lee, M. A. Isaacs, W. Xi, Y. Gangarajula, J. Luo and Y. Ren, Nat. Commun., 2019, 10, 5181 CrossRef.
- Y. Zhang, Y. Zu, D. He, J. Liang, L. Zhu, Y. Mei and Y. Luo, Appl. Catal., B, 2022, 315, 121539 CrossRef CAS.
- M. A. A. Aziz, H. D. Setiabudi, L. P. Teh, M. Asmadi, J. Matmin and S. Wongsakulphasatch, Chem. Eng. Technol., 2020, 43, 661–671 CrossRef.
- M. Shah, P. Mondal, A. K. Nayak and A. Bordoloi, J. CO2 Util., 2020, 39, 101160 CrossRef CAS.
- M. Yusuf, A. S. Farooqi, L. K. Keong, K. Hellgardt and B. Abdullah, Chem. Eng. Sci., 2021, 229, 116072 CrossRef CAS.
- F. Cheng, X. Duan and K. Xie, Angew. Chem., 2021, 133, 18940–18947 CrossRef.
- R. K. Singha, A. Yadav, A. Agrawal, A. Shukla, S. Adak, T. Sasaki and R. Bal, Appl. Catal., B, 2016, 191, 165–178 CrossRef CAS.
- R. Khatun, R. S. Pal, M. A. Shoeb, D. Khurana, S. Singhl, N. Siddiqui, M. K. Poddar, T. S. Khan and R. Bal, Appl. Catal., B, 2024, 340, 123243 CrossRef CAS.
- J. Carrasco, D. López-Durán, Z. Liu, T. Duchoň, J. Evans, S. D. Senanayake, E. J. Crumlin, V. Matolín, J. A. Rodríguez and M. V. Ganduglia-Pirovano, Angew. Chem., Int. Ed., 2015, 54, 3917–3921 CrossRef CAS PubMed.
- H.-S. Roh, H. Potdar, K.-W. Jun, J.-W. Kim and Y.-S. Oh, Appl. Catal., A, 2004, 276, 231–239 CrossRef CAS.
- N. Laosiripojana and S. Assabumrungrat, Appl. Catal., A, 2005, 290, 200–211 CrossRef CAS.
- W. Xu, Z. Liu, A. C. Johnston-Peck, S. D. Senanayake, G. Zhou, D. Stacchiola, E. A. Stach and J. A. Rodriguez, ACS Catal., 2013, 3, 975–984 CrossRef CAS.
- S. Ali, M. M. Khader, M. J. Almarri and A. G. Abdelmoneim, Catal. Today, 2020, 343, 26–37 CrossRef CAS.
- J. Wen, Y. Xie, Y. Ma, H. Sun, H. Wang, M. Liu, Q. Zhang and J. Chen, Fuel, 2022, 308, 122008 CrossRef CAS.
- M. V. Grabchenko, N. V. Dorofeeva, V. A. Svetlichnyi, Y. V. Larichev, V. La Parola, L. F. Liotta, S. A. Kulinich and O. V. Vodyankina, Nanomaterials, 2023, 13, 2641 CrossRef CAS PubMed.
- Y. Bai, K. Sun, J. Wu, M. Zhang, S. Zhao, Y. D. Kim, Y. Liu, J. Gao, Z. Liu and Z. Peng, Mol. Catal., 2022, 530, 112577 CrossRef CAS.
- D. Shen, Z. Li, J. Shan, G. Yu, X. Wang, Y. Zhang, C. Liu, S. Lyu, J. Li and L. Li, Appl. Catal., B, 2022, 318, 121809 CrossRef CAS.
- R. Babakouhi, S. M. Alavi, M. Rezaei, F. Jokar, M. Varbar and E. Akbari, Int. J. Hydrogen Energy, 2024, 60, 503–514 CrossRef CAS.
- Z. Xu and E. D. Park, Catalysts, 2024, 14, 176 CrossRef CAS.
- Y. H. Ahmad, A. T. Mohamed, H. A. El-Sayed, A. Kumar and S. Y. Al-Qaradawi, Int. J. Hydrogen Energy, 2022, 47, 41294–41309 CrossRef CAS.
- T. M. Onn, S. Zhang, L. Arroyo-Ramirez, Y.-C. Chung, G. W. Graham, X. Pan and R. J. Gorte, ACS Catal., 2015, 5, 5696–5701 CrossRef CAS.
- P. Scheiber, M. Fidler, O. Dulub, M. Schmid, U. Diebold, W. Hou, U. Aschauer and A. Selloni, Phys. Rev. Lett., 2012, 109, 136103 CrossRef PubMed.
- M. Shah, M. K. Al Mesfer and M. Danish, Int. J. Hydrogen Energy, 2022, 47, 8867–8874 CrossRef CAS.
- B. Safavinia, Y. Wang, C. Jiang, C. Roman, P. Darapaneni, J. Larriviere, D. A. Cullen, K. M. Dooley and J. A. Dorman, ACS Catal., 2020, 10, 4070–4079 CrossRef CAS.
- I. Luisetto, S. Tuti, C. Romano, M. Boaro, E. Di Bartolomeo, J. K. Kesavan, S. S. Kumar and K. Selvakumar, J. CO2 Util., 2019, 30, 63–78 CrossRef CAS.
- D. Guo, Y. Lu, Y. Ruan, Y. Zhao, Y. Zhao, S. Wang and X. Ma, Appl. Catal., B, 2020, 277, 119278 CrossRef CAS.
- A. Kambolis, H. Matralis, A. Trovarelli and C. Papadopoulou, Appl. Catal., A, 2010, 377, 16–26 CrossRef CAS.
- Z. Fei, X. Xie, Y. Dai, H. Liu, X. Chen, J. Tang, M. Cui and X. Qiao, Ind. Eng. Chem. Res., 2014, 53, 19438–19445 CrossRef CAS.
- A. Trovarelli, M. Boaro, E. Rocchini, C. de Leitenburg and G. Dolcetti, J. Alloys Compd., 2001, 323, 584–591 CrossRef.
- M. Wang, S. Y. Kim, A. Jamsaz, N. Pham-Ngoc, Y. Men, D. H. Jeong and E. W. Shin, Catal. Today, 2024, 425, 114341 CrossRef CAS.
- D. J. Kim, J. Am. Ceram. Soc., 1989, 72, 1415–1421 CrossRef CAS.
- S. Chen, C. Miao, L. Liang and J. Ouyang, Energy Fuels, 2022, 36, 8340–8350 CrossRef CAS.
- B. Liu, C. Li, G. Zhang, X. Yao, S. S. Chuang and Z. Li, ACS Catal., 2018, 8, 10446–10456 CrossRef CAS.
- J. Ashok, M. Ang and S. Kawi, Catal. Today, 2017, 281, 304–311 CrossRef CAS.
- Y.-M. Park, S.-H. Chung, H. J. Eom, J.-S. Lee and K.-Y. Lee, Bioresour. Technol., 2010, 101, 6589–6593 CrossRef CAS PubMed.
- F.-m. Sun, C.-f. Yan, C.-q. Guo and S.-l. Huang, Int. J. Hydrogen Energy, 2015, 40, 15985–15993 CrossRef CAS.
- S. Bhandari, R. Khatun, M. K. Poddar, A. C. Kothari and R. Bal, Mol. Catal., 2022, 528, 112473 CrossRef CAS.
- M. Yi, Y. Zhang, J. Xu, D. Deng, Z. Mao, X. Meng, X. Shi and B. Zhao, Nanomaterials, 2021, 11, 2162 CrossRef CAS PubMed.
- C. E. Hori, H. Permana, K. S. Ng, A. Brenner, K. More, K. M. Rahmoeller and D. Belton, Appl. Catal., B, 1998, 16, 105–117 CrossRef CAS.
- Y. Zheng, K. Li, H. Wang, X. Zhu, Y. Wei, M. Zheng and Y. Wang, Energy Fuels, 2016, 30, 638–647 CrossRef CAS.
- G.-Q. Xie, J.-Q. Lu, H.-Y. Zheng, X.-J. Liu, M.-F. Luo and X.-N. Li, J. Alloys Compd., 2010, 493, 169–174 CrossRef CAS.
- R. S. Pal, S. Rana, S. K. Sharma, R. Khatun, D. Khurana, T. S. Khan, M. K. Poddar, R. Sharma and R. Bal, Chem. Eng. J., 2023, 458, 141379 CrossRef.
- W. Kang and A. Varma, Appl. Catal., B, 2018, 220, 409–416 CrossRef CAS.
- R. A. El-Salamony, K. Acharya, A. S. Al-Fatesh, A. I. Osman, S. B. Alreshaidan, N. S. Kumar, H. Ahmed and R. Kumar, Mol. Catal., 2023, 547, 113378 CrossRef CAS.
- P. Biswas and D. Kunzru, Int. J. Hydrogen Energy, 2007, 32, 969–980 CrossRef CAS.
- R. Khatun, S. Bhandari, M. K. Poddar, C. Samanta, T. S. Khan, D. Khurana and R. Bal, Int. J. Hydrogen Energy, 2022, 47, 38895–38909 CrossRef CAS.
- J. Lin, C. Ma, Q. Wang, Y. Xu, G. Ma, J. Wang, H. Wang, C. Dong, C. Zhang and M. Ding, Appl. Catal., B, 2019, 243, 262–272 CrossRef CAS.
- F. Hu, S. Tong, K. Lu, C.-M. Chen, F.-Y. Su, J. Zhou, Z.-H. Lu, X. Wang, G. Feng and R. Zhang, J. CO2 Util., 2019, 34, 676–687 CrossRef CAS.
- A. M. Neris, J. M. Ferreira, M. G. Fonseca and I. M. G. dos Santos, J. Therm. Anal. Calorim., 2021, 143, 3307–3316 CrossRef CAS.
- P. E. Quintard, P. Barbéris, A. P. Mirgorodsky and T. Merle-Méjean, J. Am. Ceram. Soc., 2002, 85, 1745–1749 CrossRef CAS.
- S. Adak, R. S. Pal, T. S. Khan, M. K. Poddar, M. S. Ahmad, V. V. Prasad, M. A. Haider and R. Bal, ChemistrySelect, 2021, 6, 13051–13059 CrossRef CAS.
- Z. Wu, M. Li, J. Howe, H. M. Meyer III and S. H. Overbury, Langmuir, 2010, 26, 16595–16606 CrossRef CAS.
- K. Periyasamy, V. T. Aswathy, M. Manikandan, R. Shukla, A. K. Tyagi and T. Raja, RSC Adv., 2015, 5, 3619–3626 RSC.
- H. Vidal, J. Kašpar, M. Pijolat, G. Colon, S. Bernal, A. Cordón, V. Perrichon and F. Fally, Appl. Catal., B, 2000, 27, 49–63 CrossRef CAS.
- R. Wang, S. I. Mutinda and M. Fang, RSC Adv., 2013, 3, 19508–19514 RSC.
- S. O. Omarov, K. D. Martinson, A. N. Matveyeva, M. I. Chebanenko, V. N. Nevedomskiy and V. I. Popkov, Fuel Process. Technol., 2022, 236, 107429 CrossRef CAS.
- J. Xu, R. Xi, Q. Xiao, X. Xu, L. Liu, S. Li, Y. Gong, Z. Zhang, X. Fang and X. Wang, J. Catal., 2022, 408, 465–477 CrossRef CAS.
- L. P. Silva, L. E. Terra, A. C. Coutinho and F. B. Passos, J. Catal., 2016, 341, 1–12 CrossRef CAS.
- W. Cai, Q. Zhong and W. Zhao, Chem. Eng. J., 2014, 246, 328–336 CrossRef CAS.
- X. Wang, Z. Jiang, B. Zheng, Z. Xie and L. Zheng, CrystEngComm, 2012, 14, 7579–7582 RSC.
- W. Shan, M. Fleys, F. Lapicque, D. Swierczynski, A. Kiennemann, Y. Simon and P.-M. Marquaire, Appl. Catal., A, 2006, 311, 24–33 CrossRef CAS.
- G. Postole, B. Chowdhury, B. Karmakar, K. Pinki, J. Banerji and A. Auroux, J. Catal., 2010, 269, 110–121 CrossRef CAS.
- S. K. Sharma, B. Paul, A. Srivastava, R. S. Pal, M. K. Poddar, T. S. Khan, C. Samanta and R. Bal, Sustain. Chem. Clim. Action, 2023, 2, 100019 CrossRef.
- R.-P. Ye, Q. Li, W. Gong, T. Wang, J. J. Razink, L. Lin, Y.-Y. Qin, Z. Zhou, H. Adidharma and J. Tang, Appl. Catal., B, 2020, 268, 118474 CrossRef CAS.
- R. S. Pal, S. Rana, S. Sadhu, T. S. Khan, M. K. Poddar, R. K. Singha, S. Sarkar, R. Sharma and R. Bal, Energy Adv., 2023, 2, 180–197 RSC.
- J. Mei, Y. Shen, Q. Wang, Y. Shen, W. Li, J. Zhao, J. Chen and S. Zhang, ACS Appl. Mater. Interfaces, 2022, 14, 35694–35703 CrossRef CAS PubMed.
- Q. Li, Z. Yan, N. Wang, Z. Xu, G. Wang and G. Huang, Catal. Sci. Technol., 2020, 10, 4030–4041 RSC.
- Z. Xie, B. Yan, J. H. Lee, Q. Wu, X. Li, B. Zhao, D. Su, L. Zhang and J. G. Chen, Appl. Catal., B, 2019, 245, 376–388 CrossRef CAS.
- Y. Wang, L. Yao, Y. Wang, S. Wang, Q. Zhao, D. Mao and C. Hu, ACS Catal., 2018, 8, 6495–6506 CrossRef CAS.
- M. Wei and X. Shi, Methane, 2024, 3, 86–102 CrossRef.
Footnote |
| † Electronic supplementary information (ESI) available. See DOI: https://doi.org/10.1039/d4su00481g |
| This journal is © The Royal Society of Chemistry 2025 |

