 Open Access Article
Spontaneous growth of 2D coordination polymers on functionalized ferromagnetic surfaces†
Michele
Mattera
 a,
Víctor
Rubio-Giménez
 a,
Sophie
Delprat
b,
Richard
Mattana
b,
Pierre
Seneor
b,
Sergio
Tatay‡
*a,
Alicia
Forment-Aliaga‡
 *a and
Eugenio
Coronado
 a
a
aInstituto de Ciencia Molecular, Universitat de València, Catedrático José Beltrán 2, 46980 Paterna, Spain. E-mail: alicia.forment@uv.es; sergio.tatay@uv.es
bUnité Mixte de Physique CNRS/Thales, CNRS, Thales, Université Paris-Sud, Université Paris Saclay, 91767 Palaiseau, France
First published on 18th September 2018
Abstract
The spontaneous growth of lamellar metal-alkanethiolates (LMAs) on reactive ferromagnetic surfaces as a result of surface oxidation has been observed. When alkanethiol self-assembled monolayers (SAMs) grown under an inert atmosphere over cobalt or permalloy (Ni80Fe20) are exposed to air, oxygen diffuses through the molecular layer. This induces an oxidation of metal atoms at the metal surface and a release of the resulting metal cations that migrate coordinated by the alkanethiol molecules to form lamellar structures over the SAMs. This process has been imaged in real-time, under ambient conditions, by means of different microscopy techniques. The influence of the alkyl chain length, the nature of the ferromagnet, the temperature and the atmospheric moisture on the number, area and height of the resulting features has been systematically evaluated. Remarkably, the possibility to follow the migration in real-time makes it a promising model system for the study of surface/molecule interface processes. Most importantly, the composition and crystallinity of these LMAs have been studied, evidencing that real 2D coordination polymers are formed on the surface. Hence, one could envision this strategy as a new method for the assembly of more complex low-dimensional (2D) magnetic materials based on coordination polymers.
Introduction
As in the bulk, molecules can self-assemble on surfaces, giving rise to supramolecular structures in two dimensions, which can be more interesting than their individual counterparts. An archetypical example of this approach is provided by the growth of self-assembled monolayers (SAMs) over coinage metals (gold for example). In this case, the self-assembly method most often involves a solution containing surfactant molecules able to be chemisorbed to the surface through specific anchoring groups (like thiol for gold) and to self-assemble via intermolecular van der Waals (vdW) interactions to afford efficient molecular packing.1 This has led to the widespread use of SAMs in areas like nanotribology and surface protection,2 organic electronics,3 sensing,4 and lithography,5 to mention only a few.Alternatively, molecules can also spontaneously self-assemble when they are physisorbed to the surface. Here, the final molecular arrangement comes from a delicate balance between molecule–molecule and molecule–surface weak non-covalent interactions. In these cases, both solution methods6 and ultra-high vacuum (UHV) techniques7 have been extensively used to create these supramolecular nanostructures and scanning tunneling microscopy (STM) has been mainly chosen to visualize and even to manipulate the resulting network. Additionally, when coordination bonds are formed between the physisorbed organic ligands on a surface and the metal atoms above the surface plane, molecules can spontaneously self-assemble into ordered coordination polymers (CPs) in two dimensions.7–9 This surface-assisted coordination chemistry process has so far been developed in UHV. As organic ligands, polyaromatic molecules substituted with donor groups capable of coordinating metal atoms have been mainly used in order to favor a planar adsorption geometry on the metal surface. This method has provided examples that go from discrete coordination nanostructures to extended 2D metal–organic networks, which might be of interest in host/guest chemistry, heterogeneous catalysis and magnetism, to name a few.7–11
During the above mentioned self-assembly processes, the presence of solvent allows dynamic exchange between the molecules already adsorbed on the surface and those present in the solution, thus increasing the complexity of the self-assembly at the liquid/solid interface in comparison with that encountered at the UHV/solid interface and hampering the monitoring of the self-assembly process. When a solution method is used, the choice of molecules is larger since it is not limited to easily sublimable small molecules, and the equipment and laboratory conditions required are simpler.
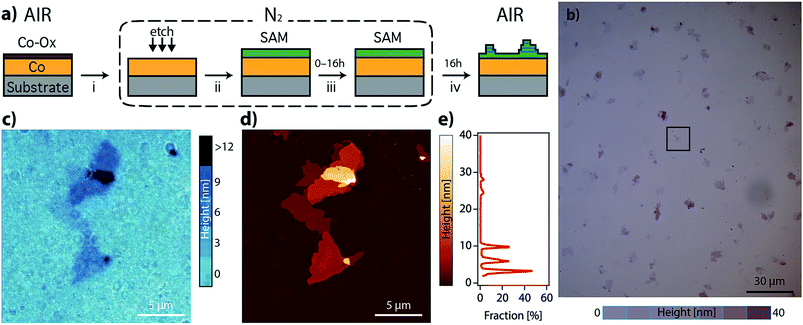
As a part of our investigation on the fabrication of molecular-based spintronic devices, we have prepared hybrid interfaces formed by ferromagnetic metal surfaces functionalized with SAMs of alkanethiol molecules.12 Notice that the chemical modification of metallic ferromagnetic surfaces, like cobalt, iron, nickel and their alloys, such as permalloy (NiFe), currently represents a technological challenge. This is mainly due to the fast oxidation of these surfaces when exposed to air, because they tend to develop a passivating oxide layer that is deleterious to spintronic applications.13–17 Our method, which is based on wet chemistry etching and does not need complex lab equipment, has been shown to overcome this problem. Moreover, it offers the advantage of selectively removing the passivating oxide without increasing the surface roughness. However, we have observed that when the resulting hybrid interface is exposed to air, layered structures of an interfacial material appear over the SAM. We will show here that this observation can be on the basis of a radically new self-assembly approach to grow CPs on these reactive metal surfaces, which involves the spontaneous growth at ambient pressure of physisorbed lamellar materials from alkanethiol molecules chemisorbed on a metal surface. The resulting 2D material is a CP formed by the assembly of a metal ion extracted from the metal substrate and alkanethiol molecules extracted from the SAM. We present a real-time imaging study of this 2D assembly directly onto surfaces, unveiling the growth process. Thus, in the first step, alkanethiol (CnH2n+1SH, CnS, n = 14, 16, and 18) SAMs were chemisorbed under an inert atmosphere on metallic ferromagnetic surfaces. The functionalized substrates were exposed in the second step to air, and layered structures visibly and rapidly evolved on the surface. The number, size and thickness of the layers were found to depend on the nature of the substrate and the chain length used. This was studied using scanning electron microscopy (SEM), atomic force microscopy (AFM) and optical microscopy. The growth of the lamella took place under ambient conditions, in a solvent-free environment, spontaneously and without the use of any external stimulus.
Results and discussion
We have prepared SAMs of alkanethiols (CnH2n+1SH, CnS, n = 14, 16, and 18) on cobalt and permalloy (Py) under an inert atmosphere using our previously described method.12 The quality of the SAMs was determined using AFM and contact angle (CA) measurements (Table S1 and Fig. S1†). The SAM samples could be stored inside a glovebox for several days without appreciable changes. However, when they were exposed to air, layered structures formed spontaneously, readily observed by SEM, AFM or optical microscopy (Fig. 1 and S2†), and evolved on the surface of the C14S–C18S samples in a solvent-free environment, over a period of approximately 16 hours.Remarkably, our reference samples (i.e. prepared exactly in the same way but without the presence of the thiol SAM) did not evolve into islands. Hence, while the formation of oxide islands on bare metals, such as aluminium18 and copper–platinum alloy,19 was reported previously in the literature, the nature of the observed features is different here. This suggests that the alkanethiol molecules play an essential role in the formation of lamellar motifs. Thus, we hypothesize that these lamellae contain alkanethiol molecules in their composition. Inspecting the literature we noted that layered materials based on metal-alkanethiolate complexes are known. These layered metal-alkanethiolates (LMAs) are CPs with the general formula Mn+(CnS−)n (with n ≥ 1 and M = Ag,20–25 Au,26,27 Cu,28–30 Pd31–33 or Ni34,35). Their structure is formed by the stacking up of repeating slabs, which consist of a sulfur–metal central plane sandwiched between two layers of fully extended alkanethiol ligands coordinating the metal ions. The stack is held together through interslab van der Waals (vdW) interactions between neighboring alkyl chains, resembling other well-known inorganic 2D vdW layered materials like graphene or transition metal dichalcogenides (TMDCs).36,37
In order to identify our lamella, we selectively removed the passivating oxide of 15 nm Co and Py films deposited over silicon substrates with glycolic acid and exposed the etched surfaces to ethanolic solutions of alkanethiols (CnS, n = 14, 16, and 18) under an inert atmosphere. After 16 hours, the treated substrates were removed from the solution, rinsed with ethanol, dried by blowing nitrogen and exposed to air to let the lamella grow. Fig. S2a–d† show optical and SEM images of a C14S cobalt sample surface where domains with thicknesses below 10 nm have grown as confirmed by AFM (thickness corresponding to a bilayer, see below). Fig. S3† shows images of a C14S island grown on Py taken by means of AFM, SEM and optical microscopy. The height of the domain is larger in this case and presents a more irregular profile. The contrast observed in the optical images is very weak (Fig. S3b†), but when the amount of light that reaches the detector is reduced by means of a neutral-density filter (ND), it considerably improves (Fig. S3c†). SEM was not so effective (Fig. S3d†), as these images showed poorer height contrast. Moreover, we observed sample damage after prolonged electron beam exposure using a 20 keV acceleration voltage.
Structural characterization
![[thin space (1/6-em)]](https://www.rsc.org/images/entities/char_2009.gif) sin
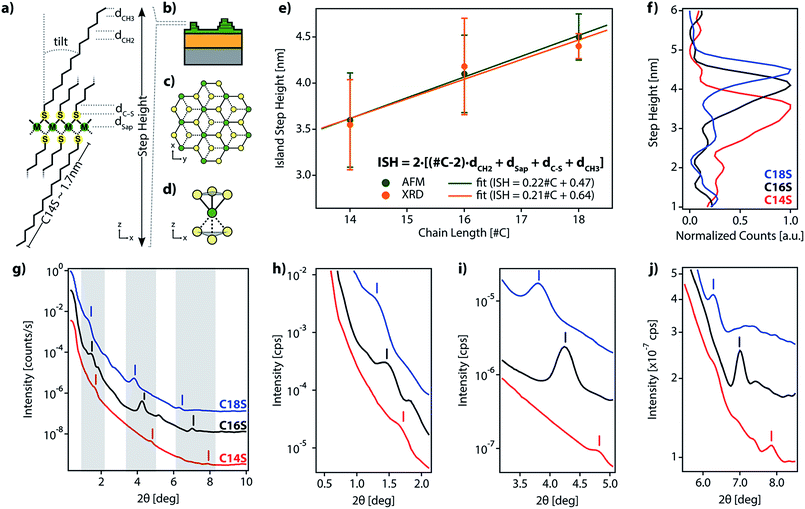
sin![[thin space (1/6-em)]](https://www.rsc.org/images/entities/char_2009.gif) θ = nλ) with n = 1 and λ = 0.9918 Å (C18S Δ2θ = 2.47 deg. and d = 23.01 Å, C16S Δ2θ = 2.69 and d = 21.09 Å, and C14S Δ2θ = 3.25 and d = 17.48 Å), closely corresponds to half of the step height determined by AFM (Fig. 2e (green dots) and Table S2†). Thus, we consider that the islands formed from C14S show an average step height of 3.6 nm, which increases to 4.1 nm for those based on C16S and finally to 4.6 nm for those based on C18S. As can be seen, there is a linear dependence between the alkanethiol chain length and the ISH of the obtained islands, which indicates that the three materials share a common internal structure.20,22,25
θ = nλ) with n = 1 and λ = 0.9918 Å (C18S Δ2θ = 2.47 deg. and d = 23.01 Å, C16S Δ2θ = 2.69 and d = 21.09 Å, and C14S Δ2θ = 3.25 and d = 17.48 Å), closely corresponds to half of the step height determined by AFM (Fig. 2e (green dots) and Table S2†). Thus, we consider that the islands formed from C14S show an average step height of 3.6 nm, which increases to 4.1 nm for those based on C16S and finally to 4.6 nm for those based on C18S. As can be seen, there is a linear dependence between the alkanethiol chain length and the ISH of the obtained islands, which indicates that the three materials share a common internal structure.20,22,25
This clear dependence on the alkyl chain length rules out the idea of the islands being mainly composed of metal oxide and supports the possibility that during the oxidation of the surface beneath the formed SAM (air exposure), there is a reorganization of the organic molecules into lamellar alkanethiolate domains in which metal ions extracted from the metal surface upon oxidation are coordinated to the organic molecules. Hence, the above results support, in accordance with the LMA structure proposed in Fig. 2, that (i) our motifs present a layered structure, (ii) alkyl chains form part of the structure of the lamella and (iii) step heights are fixed by the length of the organic molecules.
Additionally, we performed a search in the Cambridge Structural Database (CSD) for coordination motifs where a single sulfur atom bridges two (μ2S–M) or three (μ3S–M) Co, Fe or Ni metal atoms. From this query, we obtained 2842 and 18 hits, respectively. The average values for dSap, in the cases of μ2S–M and μ3S–M bridges, are 0.182 nm and 0.148 nm, respectively. We observed that our dSap values calculated from AFM (0.068 nm) and XRD data (0.133 nm) are below the μ3S–M value. In spite of the experimental error, we can assume that the more plausible structure is the one where the metal center coordination is octahedral and S is μ3-coordinated and binds to the metal plane, forming a regular pyramid with a triangular base, as has been proposed for other LMAs.23,24,27,40 These will result in a hexagonal network packing, formed by octahedral MS6 sites with half of the S atoms above and below the plane being formed by the M atoms, as represented in Fig. 2a–d. This kind of packing resembles the one adopted by layered double hydroxides (LDHs) and by hexagonal TMDCs.36
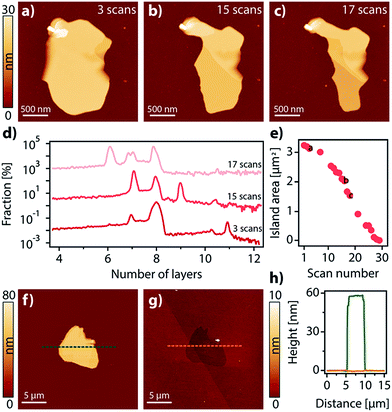
Interestingly, the domains grown on the surface can be considered as vdW 2D crystals, i.e. in-plane interactions are stronger than those between the planes to the point that exfoliation is possible.41 This is evidenced by the fact that when the domains are repeatedly scanned with an AFM tip at low set points, some material is progressively removed from the surface in a stepped way, successively exposing new layers formerly buried (Fig. 3a–d). Quite remarkably, as with vdW 2D crystals not only interactions between planes are weak, but interactions with the surface are weak too. This is highlighted to the point that the domains can be completely etched away using AFM or by exposure to UHV for extended periods of time (Fig. 3e–h and Video S1†).
Using the IAH derived from AFM (Table S3†) and the coverage values, we can make a rough calculation of the amount of material that has displaced from the original SAM into the island domains: D = 2 × IAH × C/ISH, where D is the percentage of the displaced material, IAH is the island average height, ISH is the calculated island step height for each chain length and C is the coverage. For Co, D values for C14S, C16S and C18S are 39.3%, 68.5% and 48.5%, respectively. The calculated value for C18S on cobalt is very close to the exact value of 45.6% obtained from AFM data (i.e.Fig. 6g). For Py, the values are D = 15.4%, 15.9% and 11.2%. These lower values reflect the lower tendency of Py to form island domains. In any case, what seems clear is that the space between islands is not completely void and that there are still SAM molecules present on the surface.
Spectroscopic characterization
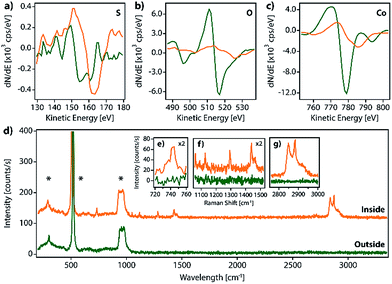
Additionally, in order to gain further insights on the island composition, we performed synchrotron X-ray photoemission electron microscopy (X-PEEM) experiments at CIRCE and HERMES beamlines, in ALBA and SOLEIL light sources, respectively.
Unfortunately, for such experiments the samples have to be exposed to 10−9 mbar pressure for several hours; as discussed before, this results in the complete removal of the LMAs from the surface, precluding a proper analysis.
Growth rate studies
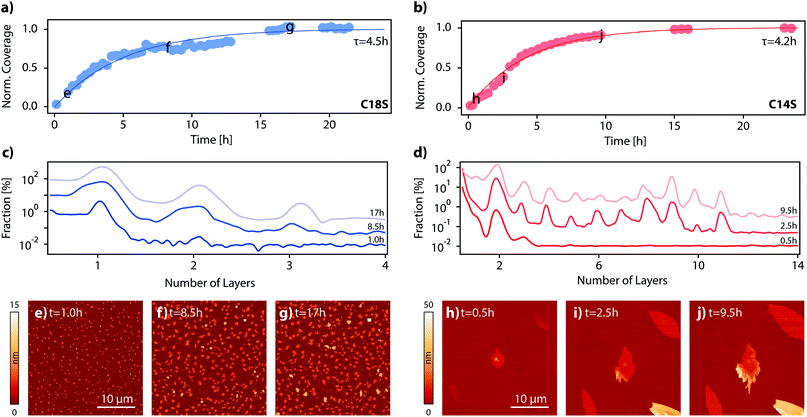
In the previous section, we have proved the LMA nature of the spontaneously formed lamellar features by means of their topographic, structural and spectroscopic characterization. In this section, we will study the growth of the island domains as a function of time and also we will assess the role of the temperature and the atmosphere. For that, we proceeded to functionalize Co and Py surfaces with C18S, C16S and C14S inside a glovebox, and then we exposed the sample to air and monitored the change of the topography as a function of time for a 30 × 30 μm2 area using AFM. In general, although some variability was observed between experiments, equivalent assays revealed that the time needed to reach stable island domains is in between 14 and 18 hours (no significant variation in height or area is observed beyond this point) independently of the substrate (Co or Py) and chain length used (n = 14, 16 or 18). Fig. 6a and b represent the changes in coverage measured by AFM during the growth of C14S and C18S islands on Co. In Fig. 6c and d some selected height distributions are shown. Some of the AFM images corresponding to the data displayed in Fig. 6a–d are reported in Fig. S7 and S8.† For the case of C18S, it is possible to observe that right after air exposure island domains started growing on the surface. We observed that, after the first hour, only domains of around 4.6 nm height (1 layer) are present (Fig. 6c), after 8.5 hours some domains with a height slightly above 9 nm (2 layers) appear, and finally at the end of the growth process, the height distribution reflects a small contribution of domains of 13.5 nm (3 layers).For the case of C14S, it is clearly visible that after 17 hours no further evolution of the number of islands, their areas or their heights is observed. In this particular case, we observed a slightly faster growth (τ = 4.2 h). The height distribution shows the presence of terraces of 7.2 nm (2 layers), since the very beginning (Fig. 6d). After around 2.5 h, higher steps can also be observed, reaching a maximum height of 40 nm (∼11 layers) at the end of the growth process. AFM is a precise technique but limited to size acquisition, and quite time-consuming. This makes the imaging of large sample areas difficult during the very first seconds of air contact and over long periods of time. In order to improve our kinetic study, we took advantage of optical microscopy to take large area pictures in a matter of seconds, even at the expense of precise topographic information. This allowed us to precisely follow the growth process in its initial stages. We functionalized again a cobalt sample with C14S; we chose this sample because, as discussed above, the resulting island domains are bigger and thus their optical analysis is easier. The sample was exposed to air and pictures were taken with an optical microscope every few minutes (Fig. S9–S12 and Video S2†). This is the first time that a kinetic measurement in real time of the growth of a lamellar 2D coordination polymer on a surface is reported.
Influence of the ambient conditions
It is well known that the crystal growth in bulk materials is influenced by various parameters such as temperature, concentration or the growth media used.44 The temperature particularly influences the balance between the nucleation and growth steps. In order to determine the extension of the influence of this parameter on our system, we performed a series of experiments where three freshly functionalized Co–C14S samples were exposed to air at three different temperatures, 35 °C, 25 °C (room temperature) and 5 °C, and recorded optical images for all of them (Fig. S13†). At a first glance, it is possible to observe that an increase in temperature produces a smaller density of islands, but with bigger sizes. This result suggests that island domains grow following a nucleation and growth mechanism similar to that observed for other bulk solids in solution. Under ambient conditions, all surfaces are covered by a thin layer of water, whose dimensions depend on the nature of the surface, the ambient humidity and temperature conditions.45–47 To check if this water layer was playing any role in island domain formation, we designed an experiment in which we functionalized a set of two twin cobalt samples with C14S. We directly exposed one of the samples (Sample A) to air as a reference, whilst the second sample was transferred directly from the glovebox into a reaction chamber filled with dry air (Sample B). After 16 hours, we checked both samples using optical microscopy (Fig. S14 and S15†) and left both of them reacting under ambient conditions for an additional 16 hours. After 16 hours of reaction under ambient conditions, island growth on Sample A had already finished, and no particular evolution was observed after 32 hours. For the case of Sample B, we also observed the presence of islands after 16 hours of reaction under dry air. However, when we further exposed the sample to ambient conditions for an additional 16 hours, we found that both the number of islands and their size had increased to values closer to those of Sample A. In conclusion, it seems that again island formation mimics the behavior observed in most bulk systems; although reactions can be carried out in the solid state, reaction rates in solution tend to be higher.Conclusions
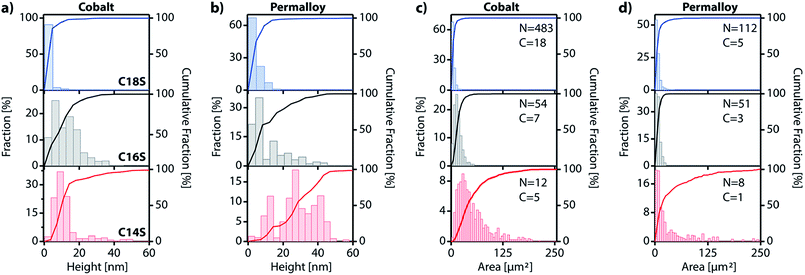
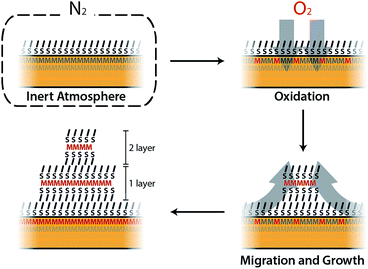
In this work we have developed a new approach for growing 2D coordination networks on solid surfaces under ambient conditions. The approach is illustrated through the growth of LMAs over functionalized ferromagnetic surfaces. These LMAs have so far been prepared in solution and successfully transferred onto solid supports.35 Their preparation as thin films has been reported in very few cases.40,48,49 Furthermore, the direct or indirect real-time study of the formation of 2D layers of these structures has remained almost unexplored and has been based on bulk lamellar samples.27,50 However, during the revision process of our work, the formation and growth of multilayer motifs on copper with dodecanethiol has been just reported.51 In this article, we have presented the nucleation and evolution of 2D coordination polymer structures based on LMAs directly imaged by different microscopies. These lamellar structures spontaneously appear on Co and Py ferromagnetic surfaces, which have been functionalized with alkanethiol SAMs under an inert atmosphere, when they are exposed to air (Fig. 7). Although this process is reminiscent of the assembly of alkanethiol molecules over metallic surfaces, this method can be on the basis of a new self-assembly approach to grow 2D metal–organic networks on reactive metal surfaces at ambient pressure. In this case, oxygen triggers the oxidation of the metal surface, extracting metallic ions, which migrate along with the alkanethiol ligands to give rise to RS–M–RS multilayered crystalline domains, which grow over the SAM surface. The domains can be removed under UHV or through interaction with an AFM tip, highlighting the existence of weak interactions between adjacent layers. These findings show how weak vdW interactions are able to drive the rearrangement of alkanethiol molecular units that originally form part of a well-organized SAM, giving rise to new crystalline lamellar structures. However, despite the fact that the oxidation of the ferromagnetic surface is at the origin of the restructuration, the step-by-step nature of the process is still unclear and future theoretical calculations are expected to shed some light on it.The accommodation and rearrangement of the lamellae runs over several hours until the final crystalline structures are reached. This has allowed us to monitor for the first time the growth in real time of these 2D coordination polymers on surfaces. No solvent is required for the migration process and even when air humidity is suppressed, the growth process persists although the growing speed is decreased. Besides the whole process takes place at room temperature, and by increasing the temperature, a smaller density of larger islands can be obtained. The nature of the ferromagnetic substrate and the length of the alkyl chains determine the number, area and height of the resultant LMAs. Shorter chains (C14S) give rise to larger features, but in smaller numbers over the surface, while almost exclusively small single layer islands are obtained for the longest chains (C18S) with a higher coverage of the surface. As far as the substrate is concerned, we notice that, although the effect is weak, higher but smaller area structures in fewer numbers are usually observed for Py compared to Co. The easy growth of real 2D CPs with magnetic ions can become a platform to obtain metal and metal sulfide nanostructures, and also new 2D magnetic materials where M–S layers (M: Fe, Co or Ni) are embedded into a diamagnetic-isolating alkyl matrix. Moreover, this approach could be extended for the surface self-assembly of more complex metal–organic networks by changing the alkyl chain by other backbone skeletons. Finally, the ease and time scale of the growth process could be used to model surface/molecule interfacial processes in air.
Conflicts of interest
There are no conflicts of interest to declare.Acknowledgements
We acknowledge the financial support from the European Union (COST Action MOLSPIN CA15128, FET-OPEN 2D-INK 664878, and ERC-2018-AdG 788222 Mol-2D), the Spanish MINECO (MAT2017-89993-R co-financed by FEDER and Excellence Unit “María de Maeztu” MDM-2015-0538) and the Generalitat Valenciana (PROMETEO/2017/066). V. R.-G. thanks the Spanish MECD for a FPU predoctoral grant (FPU13/03203). We thank Diamond Light Source for access to beamline I07 (proposal number SI14922-1), which contributed to the results presented here, and Dr Thomas Arnold, Dr Jonathan Rawle and Dr Jacob Filik for their assistance in measuring and analyzing synchrotron XRD data; ALBA synchrotron for the beam time at the CIRCE beamline (proposal number 2016021560) and Dr Lucia Aballe and Dr Michael Foerster for their help; SOLEIL (proposal number 20160524 and 20170418) for provision of synchrotron radiation facilities and Rachid Belkhou and Stefan Stanescu for assistance in using HERMES beamline and finally Dr Lorenzo Calvo for Auger Electron Spectroscopy measurements and discussion about the obtained results.Notes and references
- A. Ulman, Chem. Rev., 1996, 96, 1533–1554 CrossRef CAS PubMed.
- B. Bhushan, in Nanotribology and Nanomechanics, Springer International Publishing, Cham, 5th edn, 2017, vol. 217, pp. 641–688 Search PubMed.
- S. Casalini, C. A. Bortolotti, F. Leonardi and F. Biscarini, Chem. Soc. Rev., 2016, 46, 40–71 RSC.
- D. Mandler and I. Turyan, Electroanalysis, 1996, 8, 207–213 CrossRef CAS.
- A. R. Bishop and I. Kaur, Curr. Opin. Colloid Interface Sci., 1996, 1, 127–136 CrossRef CAS.
- K. S. Mali, N. Pearce, S. de Feyter and N. R. Champness, Chem. Soc. Rev., 2017, 46, 2520–2542 RSC.
- J. V. Barth, G. Costantini and K. Kern, Nature, 2005, 437, 671–679 CrossRef CAS PubMed.
- R. Otero, J. M. Gallego, A. L. V. de Parga, N. Martín and R. Miranda, Adv. Mater., 2011, 23, 5148–5176 CrossRef CAS PubMed.
- L. Dong, Z. Gao and N. Lin, Prog. Surf. Sci., 2016, 91, 101–135 CrossRef CAS.
- S. Stepanow, M. Lingenfelder, A. Dmitriev, H. Spillmann, E. Delvigne, N. Lin, X. Deng, C. Cai, J. V. Barth and K. Kern, Nat. Mater., 2004, 3, 229–233 CrossRef CAS PubMed.
- T. R. Umbach, M. Bernien, C. F. Hermanns, A. Krüger, V. Sessi, I. Fernandez-Torrente, P. Stoll, J. I. Pascual, K. J. Franke and W. Kuch, Phys. Rev. Lett., 2012, 109, 267207–267215 CrossRef CAS PubMed.
- M. Galbiati, S. Delprat, M. Mattera, S. Mañas-Valero, A. Forment-Aliaga, S. Tatay, C. Deranlot, P. Seneor, R. Mattana and F. Petroff, AIP Adv., 2015, 5, 057131–057139 CrossRef.
- K. S. Kumar, L. Jiang and C. A. Nijhuis, RSC Adv., 2017, 7, 14544–14551 RSC.
- M.-B. Martin, B. Dlubak, R. S. Weatherup, H. Yang, C. Deranlot, K. Bouzehouane, F. Petroff, A. Anane, S. Hofmann, J. Robertson, A. Fert and P. Seneor, ACS Nano, 2014, 8, 7890–7895 CrossRef CAS PubMed.
- S. Joo, K. Y. Jung, B. C. Lee, T.-S. Kim, K. H. Shin, M.-H. Jung, K. J. Rho, J.-H. Park, J. Hong and K. Rhie, Appl. Phys. Lett., 2012, 100, 172406–172414 CrossRef.
- J. S. Moodera, E. F. Gallagher, K. Robinson and J. Nowak, Appl. Phys. Lett., 1997, 70, 3050 CrossRef CAS.
- L. Smardz, U. Köbler and W. Zinn, J. Appl. Phys., 1992, 71, 5199–5204 CrossRef CAS.
- R. K. Hart and J. K. Maurin, Surf. Sci., 1970, 20, 285–303 CrossRef CAS.
- L. Luo, Y. Kang, J. C. Yang and G. Zhou, J. Appl. Phys., 2015, 117, 065305–065310 CrossRef.
- I. G. Dance, K. J. Fisher and R. Banda, Inorg. Chem., 1991, 30, 183–187 CrossRef CAS.
- H. G. Fijolek, J. R. Grohal and J. L. Sample, Inorg. Chem., 1997, 36, 622–628 CrossRef CAS.
- F. Bensebaa, T. H. Ellis, E. Kruus, R. Voicu and Y. Zhou, Langmuir, 1998, 14, 6579–6587 CrossRef CAS.
- A. N. Parikh, S. D. Gillmor, J. D. Beers, K. M. Beardmore, R. W. Cutts and B. I. Swanson, J. Phys. Chem. B, 1999, 103, 2850–2861 CrossRef CAS.
- A. A. Levchenko, C. K. Yee, A. N. Parikh and A. Navrotsky, Chem. Mater., 2005, 17, 5428–5438 CrossRef CAS.
- Z. Ye, L. P. de la Rama, M. Y. Efremov, J.-M. Zuo and L. H. Allen, Dalton Trans., 2016, 45, 18954–18966 RSC.
- S.-H. Cha, J.-U. Kim, K.-H. Kim and J.-C. Lee, Chem. Mater., 2007, 19, 6297–6303 CrossRef CAS.
- H. Nie, M. Li, Y. Hao, X. Wang and S. X.-A. Zhang, Chem. Sci., 2013, 4, 1852–1857 RSC.
- F. Bensebaa, T. H. Ellis and E. Kruus, Can. J. Chem., 1998, 76, 1654–1659 CAS.
- P. Espinet and M. C. Lequerica, Chem.–Eur. J., 1999, 5, 1982–1986 CrossRef CAS.
- N. Sandhyarani and T. Pradeep, J. Mater. Chem., 2001, 11, 1294–1299 RSC.
- F. G. Mann and D. Purdie, J. Chem. Soc., 1935, 1549–1563 RSC.
- P. John Thomas, A. Lavanya, V. Sabareesh and G. U. Kulkarni, Proc.–Indian Acad. Sci., Chem. Sci., 2001, 113, 611–619 CrossRef.
- N. S. John, P. J. Thomas and G. U. Kulkarni, J. Phys. Chem. B, 2003, 107, 11376–11381 CrossRef CAS.
- N. S. John, G. U. Kulkarni, A. Datta, S. K. Pati, F. Komori, G. Kavitha, C. Narayana and M. K. Sanyal, J. Phys. Chem. C, 2007, 111, 1868–1870 CrossRef CAS.
- B. Busupalli, S. Kummara, G. Kumaraswamy and B. L. V. Prasad, Chem. Mater., 2014, 26, 3436–3442 CrossRef CAS.
- C. Tan, X. Cao, X.-J. Wu, Q. He, J. Yang, X. Zhang, J. Chen, W. Zhao, S. Han, G.-H. Nam, M. Sindoro and H. Zhang, Chem. Rev., 2017, 117, 6225–6331 CrossRef CAS PubMed.
- S. Manzeli, D. Ovchinnikov, D. Pasquier, O. V. Yazyev and A. Kis, Nat. Rev. Mater., 2017, 2, 17033–17115 CrossRef CAS.
- W. L. Bragg, Proc. Cambridge Philos. Soc., 1913, 17, 43–57 CAS.
- Handbook of Chemistry and Physics, ed. W. M. Haynes, 84th edn, 2004 Search PubMed.
- J. T. Woodward, M. L. Walker, C. W. Meuse, D. J. Vanderah, G. E. Poirier and A. L. Plant, Langmuir, 2000, 16, 5347–5353 CrossRef.
- M. Xu, T. Liang, M. Shi and H. Chen, Chem. Rev., 2013, 113, 3766–3798 CrossRef CAS PubMed.
- D. Nečas and P. Klapetek, Cent. Eur. J. Phys., 2012, 10, 181–188 Search PubMed.
- M. A. Bryant and J. E. Pemberton, J. Am. Chem. Soc., 1991, 113, 8284–8293 CrossRef CAS.
- I. Sunagawa, Crystals: Growth, Morphology and Perfection, Cambridge University Press, 2005 Search PubMed.
- M. A. Henderson, Surf. Sci. Rep., 2002, 46, 1–308 CrossRef CAS.
- A. Verdaguer, G. M. Sacha, H. Bluhm and M. Salmeron, Chem. Rev., 2006, 106, 1478–1510 CrossRef CAS PubMed.
- S. Santos and A. Verdaguer, Materials, 2016, 9, 182–216 CrossRef PubMed.
- H. Keller, P. Simak, W. Schrepp and J. Dembowski, Thin Solid Films, 1994, 244, 799–805 CrossRef CAS.
- L. Hu, L. P. de la Rama, M. Y. Efremov, Y. Anahory, F. Schiettekatte and L. H. Allen, J. Am. Chem. Soc., 2011, 133, 4367–4376 CrossRef CAS PubMed.
- H. Nie, M. Li, Y. Hao, X. Wang, S. Gao, P. Wang, B. Ju and S. X.-A. Zhang, RSC Adv., 2014, 4, 50521–50528 RSC.
- D. S. Bergsman, T.-L. Liu, R. G. Closser, K. L. Nardi, N. Draeger, D. M. Hausmann and S. F. Bent, Chem. Mater., 2018, 30, 5694–5703 CrossRef CAS.
Footnotes |
| † Electronic supplementary information (ESI) available: Materials and methods section, statistical analysis of the LMAs’ morphology and density (PDF), and AFM and optical images of the LMAs’ evolution (mp4). See DOI: 10.1039/c8sc03067g |
| ‡ These authors contributed equally. |
| This journal is © The Royal Society of Chemistry 2018 |

