 Open Access Article
Kinetics, equilibrium, statistical surface modeling and cost analysis of paraquat removal from aqueous solution using carbonated jujube seed†
Mohamed Zbair *a,
Zakaria Anfar
 b,
Hassan Ait Ahsaine
 b and
Hamza Khallokc
aLaboratory of Catalysis and Corrosion of Materials, Chouaïb Doukkali University, Faculty of Sciences El Jadida, BP. 20, El Jadida 24000, Morocco. E-mail: zbair.mohamed@gmail.com; Tel: +358465232839
bMaterials and Environment Laboratory, Ibn Zohr University, Faculty of Sciences, Agadir, Morocco
cTeam of Energy, Materials and Environment, Chemistry Department, Chouaïb Doukkali University, Faculty of Sciences El Jadida, BP. 20, El Jadida 24000, Morocco
First published on 9th January 2019
Abstract
This paper reports the removal of paraquat from an aqueous solution using prepared carbonated jujube seed (JS/HSO-700). JS/HSO-700 was characterized by XPS, TGA, FTIR, N2 physisorption, SEM, and Raman techniques. FTIR revealed the presence of active species on the JS/HSO-700 surface. The removal rate of paraquat was investigated as a function of multiple operational factors such as contact time, adsorbent dose and solution pH. Adsorption mechanism was fully investigated based on FTIR, Raman, and BET analyses before and after adsorption. Response surface methodology modeling using central composite design was performed to statistically optimize the adsorption conditions. The experimental paraquat removal efficiency was found to be 96.7 ± 2.02%, whereas the predicted value of the model was 94.31 ± 4.43%, showing that the predicted model values are in good agreement with the experimental value. Finally, cost analysis was performed to confirm the cost of the adsorbent based on energy consumption and reagent costs.
1. Introduction
Currently, due to industrial development, majority of the soil contaminants originate from industrial wastewater containing organic matter and minerals, some of which are toxic; these contaminants are released in the form of solutions, suspensions, emulsions (polar molecules) or dispersions (colloids). They are mainly composed of suspended solids, oxidizable organic matter, inorganic salts, detergents, inhibitors, acids and bases, toxins, and colorants. In most cases, their composition directly depends on the type of industry from which they are released. Paraquat is one of the widely used herbicides and presents many serious health problems. It is known as Gramoxone, which is a toxic compound. The use of this compound may create potential environmental hazards to humans and animals if exposed by ingestion, skin contact, or splash to eyes.1 It is very toxic if ingested orally in the range from 4 to 40 mg kg−1.2 Still, up to 3.5 mg kg−1 does not cause remarkable damage to the skin or respiratory system; irreversible human lung damage is one of the biggest threats of this herbicide.3 Moreover, it is rapidly distributed in most tissues with the highest concentration found in lungs and kidneys.4 The extent of intoxication caused by paraquat depends on many factors and circumstances such as duration of exposure, the route, the amount, and the state of health of the person at the time of the exposure.Furthermore, when paraquat enters the soil environment, it is quickly and strongly bound to clay minerals and organic matter and becomes biologically inactive.5 The danger of pollution by paraquat is increased by its high water solubility (620 g L−1),6 having been identified in surface and drinking waters.7 For European criteria, the maximum allowed concentrations for individual pesticides in drinking water including paraquat are 0.1 μg L− 1 and 1–3 μg L− 1 for surface water.8 Consequently, the requirement to decrease the concentration of paraquat in water is a worldwide challenge as far as water pollution is concerned.
The removal treatment of paraquat can occur through several processes9 such as photodegradation,10 chemical degradation,11 and microbial metabolism.12 First, the photodecomposition reactions occur within a few centimeters of the soil's surface13 and depend largely on UV intensity.14 Other studies proved that paraquat removal from aqueous solutions could be achieved, especially by adsorption on various porous materials including clays,15–18 silica gel,9 zeolites, and mesoporous materials.19 However, carbonated materials prepared from biomass are the best adsorbent materials that can be used for the treatment of heavy metals and organic pollutants. Predominantly, carbonated materials have been widely studied because they are rich in functional groups (–OH, –NH, and C![[double bond, length as m-dash]](https://www.rsc.org/images/entities/char_e001.gif) O).20,21 The high adsorption capacity and efficiency of an adsorbent are mainly controlled by the presence of functional groups in the surface of the adsorbent.22
O).20,21 The high adsorption capacity and efficiency of an adsorbent are mainly controlled by the presence of functional groups in the surface of the adsorbent.22
Rahman et al. reported capacity of 99.9 mg g−1 for activated carbon.23 Hsu and Pan utilized modified rice husk and indicated adsorption capacity of 317.7 mg g−1.24
The aim of our study is the development of a new low-cost adsorbent from biomass for adsorption applications. Argan nut shell,25 wood sawdust,26 almond shell,27 and lignocellulose biomass are abundant in Morocco, easily available and non-toxic.
The treatment of biomass with acids activates the functional adsorption sites and increases the binding capacity.28 This can be achieved in several ways: by reducing the content of cellulose, lignin and hemicelluloses from the solid substrate to be processed as well as by increasing the porosity of or increasing the surface area, which can positively influence adsorption.9,29
To achieve better adsorption of paraquat, in this paper, we investigate the adsorption behavior of paraquat on an adsorbent prepared from jujube seed and the nature and adsorption pathway. The objectives were to determine the adsorption of paraquat including identifying factors controlling its adsorption and a cost analysis of the prepared adsorbent.
2. Experimental section
2.1 Adsorbent preparation
JS/HSO-700 was prepared by mixing 10 g of jujube seed grounds with the appropriate quantity of H2SO4. The mixture was stirred at 40 °C for 5 hours. Then, the mixture was heated at 700 °C under N2 atmosphere for 2 hours. The jujube seeds were collected from a mountain in the Taroudant region of Morocco.2.2 Characterization methods
XPS analysis on JS/HSO-700 was carried out using a Thermo Fisher Scientific ESCALAB 250Xi X-ray photoelectron spectroscopy system equipped with Al Kα X-ray source (hν = 1486.7 eV) to study the chemical states of synthesized samples.Thermogravimetry analyses (TGA) were performed to determine the dehydration kinetics of jujube seed. The thermal decomposition of the jujube seed proceeded under air between 25 °C and 900 °C with a heating rate of 10 °C min−1 (using Shimadzu Instruments DTG-60 equipment).
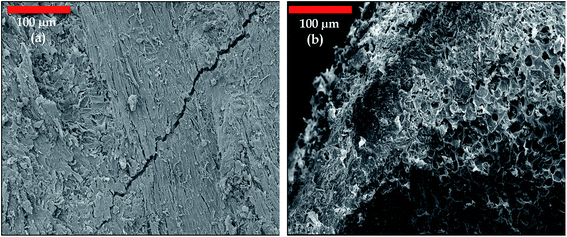
Scanning electron microscopy (SEM) analyses were used to observe the morphology of jujube seed and JS/HSO-700.
The Brunauer–Emmett–Teller (BET) surface area (SBET) of JS/HSO-700 was determined by the nitrogen adsorption and desorption isotherms; pore size distribution and specific surface area were measured using an AUTOSORB-1 surface area and pore size analyzer at 77 K.
The Fourier transform infrared spectra of jujube seed and JS/HSO-700 samples were obtained in the mid-infrared region (400–4000 cm−1) using Shimadzu 4800S.
Raman spectroscopy was used to characterize the prepared JS/HSO-700. The equipment used to obtain various vibration spectra was a spectrometer NRS-5100 model Jasco Raman spectrometer using a CCD detector, a laser line of 532 nm and objective lens 100×, with a laser power of 1.6 mW.
2.3 Adsorption procedure
The initial pH effect testing was carried out by mixing 20 mg of JS/HSO-700 and 100 mL of paraquat (100 mg L−1); the initial pH was adjusted using buffer solution (4.0–9.0). The kinetic studies were done with 20 mg of JS/HSO-700 and an initial concentration of 100 mg L−1. A volume of paraquat solution (100 mL) was agitated (200 rpm) at different temperatures (298, 303, and 313 K) for different contact times (10–180 min) and the solution was centrifuged to remove the adsorbent. The residual paraquat concentrations were determined spectrophotometrically. The isotherm studies were carried out by agitating 100 mL of different concentrations of paraquat (10–100 mg L−1) mixed with 20 mg of JS/HSO-700 at three temperatures (298, 303, and 313 K) and pH 6.5 for 60 min.3. Results and discussion
3.1 Characterizations of JS/HSO-700
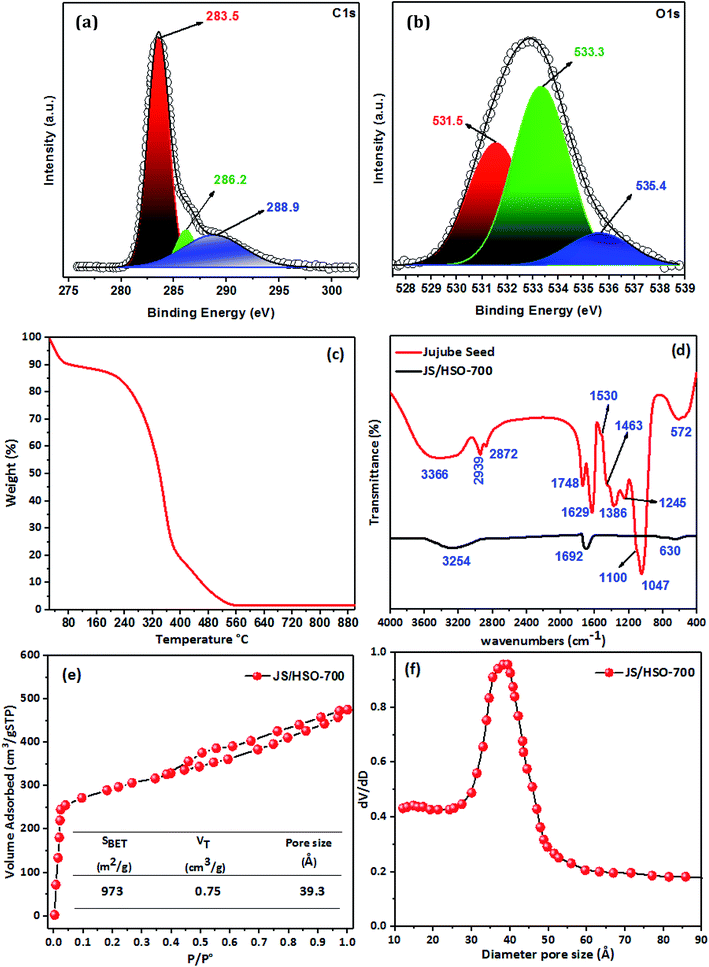
![[double bond, length as m-dash]](https://www.rsc.org/images/entities/char_e001.gif) C (283.5 eV), C–O (286.2 eV) and C
C (283.5 eV), C–O (286.2 eV) and C![[double bond, length as m-dash]](https://www.rsc.org/images/entities/char_e001.gif) O (288.9 eV). Likewise, the deconvolution of the O1s spectrum (Fig. 1b) displays three peaks positioned at 531.5, 533.3, and 535.4 eV, which correspond to C
O (288.9 eV). Likewise, the deconvolution of the O1s spectrum (Fig. 1b) displays three peaks positioned at 531.5, 533.3, and 535.4 eV, which correspond to C![[double bond, length as m-dash]](https://www.rsc.org/images/entities/char_e001.gif) O, C
O, C![[double bond, length as m-dash]](https://www.rsc.org/images/entities/char_e001.gif) O, and C–OH.27,30
O, and C–OH.27,30
![[double bond, length as m-dash]](https://www.rsc.org/images/entities/char_e001.gif) C bonds at 1629 cm−1. The peak located at 1530 cm−1 is assigned to the C
C bonds at 1629 cm−1. The peak located at 1530 cm−1 is assigned to the C![[double bond, length as m-dash]](https://www.rsc.org/images/entities/char_e001.gif) C ring stretch of aromatic rings.32 The band located at 1463 cm−1 confirms the presence of C
C ring stretch of aromatic rings.32 The band located at 1463 cm−1 confirms the presence of C![[double bond, length as m-dash]](https://www.rsc.org/images/entities/char_e001.gif) C of aromatic rings.33 The ester group (R–C–O–R–) was observed at 1386 cm−1, with –C–O– stretching at 1100 cm−1. The peak observed at 1245 cm−1 might be assigned to C–O stretching vibrations and –C
C of aromatic rings.33 The ester group (R–C–O–R–) was observed at 1386 cm−1, with –C–O– stretching at 1100 cm−1. The peak observed at 1245 cm−1 might be assigned to C–O stretching vibrations and –C![[double bond, length as m-dash]](https://www.rsc.org/images/entities/char_e001.gif) O groups are observed at 1047 cm−1. The IR band located at 572 cm−1 is ascribed to in-plane ring deformation.34
O groups are observed at 1047 cm−1. The IR band located at 572 cm−1 is ascribed to in-plane ring deformation.34The preparation of JS/HSO-700 from jujube seeds by H2SO4 and thermal treatment at 700 °C led to decrease in the intensities and shifts of the peaks at 3366, 1629, and 572 cm−1 (Fig. 1d). However, the other peaks disappeared due to the thermal treatment used during the preparation of JS/HSO-700.
3.2 Influence of pH
The pH of a medium can play a major role because it can affect the aqueous chemistry and surface binding sites of the adsorbent.22 Adsorption at pH values higher than 9.0 was not tested because the paraquat molecules degrade due to the cleavage of pyridine rings in a basic medium.36 The results show that maximum removal of paraquat onto JS/HSO-700 was observed in the range of 6.5–9.0 (Fig. 4a). In the acidic range, the percentage of removal decreased probably due to electrostatic repulsion between the positively charged surface of JS/HSO-700 and the positively charged paraquat molecules.22 This outcome is consistent with the results reported by Tsai and co-workers.37 Hence, pH 6.5 was used for the next adsorption experiments in this study.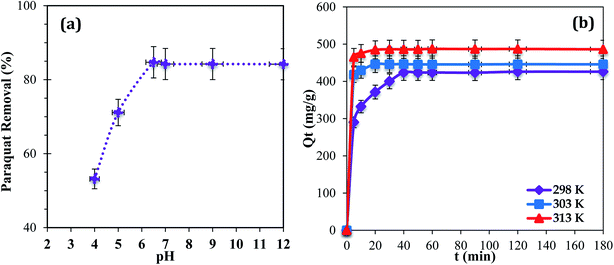 | ||
| Fig. 4 (a) Effect of initial solution pH (T = 298 K; Ci = 100 mg L−1; m = 20 mg). (b) Effect of contact time (temperature: 298, 303, and 313 K; Ci= 100 mg L−1; m = 20 mg; pH = 6.5). | ||
3.3 Effect of contact time
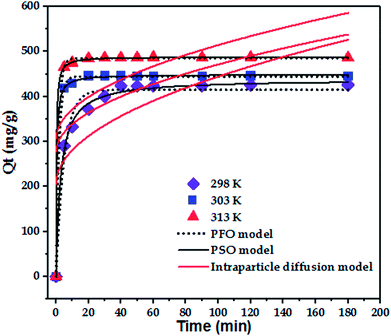
The effect of temperature (298, 303, and 313 K) on the adsorption of paraquat onto JS/HSO-700 was assessed at the concentration of 100 mg L−1 at pH 6.5 (Fig. 4b). It was found that 180 min of contact time at 313 K was enough to achieve optimal performance, after which the adsorption capacity of JS/HSO-700 reached its maximum (i.e., 97% removal). In general, the adsorption on JS/HSO-700 is characterized by fast kinetics, and maximum performance is achieved after 20 min at 313 K.3.4 Adsorption kinetics
| Equations | Name | Description | Ref. |
|---|---|---|---|
Qt = Qcal(1 − exp![[thin space (1/6-em)]](https://www.rsc.org/images/entities/char_2009.gif) K1t) K1t) |
Pseudo-first-order (PFO) | k1 (min−1): the PFO rate constant; t (min): the contact time of adsorbent and adsorbate; Qt (mg g−1): the amount of paraquat adsorbed at time t; Qcal (mg g−1): the calculated amount of paraquat adsorbed at equilibrium | 38 |
 |
Pseudo-second-order (PSO) | K2: rate constant | 40 |
 |
Intraparticle diffusion (IPD) | Kip (mg g−1 min−1/2): rate coefficient; C (mg g−1): thickness of the boundary layer | 41 |
 |
Langmuir model | Qe (mg g−1) is the equilibrium paraquat or paraquat sorption amount, Ce (mg L−1) is the equilibrium concentration of paraquat or paraquat, 1/n is the Freundlich exponent, Qmax is the maximum adsorbed amount for monolayer sorption, KF ((mg g−1)(mg L−1)−1/n) and KL (mg L−1) represent the Freundlich affinity coefficient and the Langmuir bonding term related to interaction energies, respectively | 42 |
 |
Adsorption feasibility | 43 | |
 |
Freundlich model | 44 | |
ΔG° = −RT![[thin space (1/6-em)]](https://www.rsc.org/images/entities/char_2009.gif) ln ln![[thin space (1/6-em)]](https://www.rsc.org/images/entities/char_2009.gif) Kd Kd |
Gibbs free energy | ΔG°: Gibbs free energy change; Kd: equilibrium constant; R: gas constant; T: temperature | 45 |
 |
Van't Hoff | ΔS°: entropy change; ΔH°: enthalpy change | 46 |
To confirm the best model to describe the adsorption kinetics of paraquat sorption onto JS/HSO-700, we compared the values of correlation coefficients and standard error of estimate (SEE), discovering the correlation between experimental data and model-predicted values. The nonlinear plots of paraquat adsorption kinetics and the calculated kinetic parameters are given in Fig. 5 and Table 2, respectively. As can be seen, the correlation coefficients obtained from the PSO model were very close to 1 (R2 = 0.999) compared with R2 obtained from the PFO model. Furthermore, SEE of the PSO model was the lowest, which was in contrast with that of the PFO model. Consequently, the PSO model fitted the adsorption data of paraquat on JS/HSO-700 at all studied temperatures, which indicated that the rate-controlling process was at least partially a chemically mediated process.47
| T (K) | Qe,exp (mg g−1) | Pseudo-first-order | Pseudo-second-order | ||||
|---|---|---|---|---|---|---|---|
| Qe,cal (mg g−1) | K1 (min−1) | R2 | Qe,cal (mg g−1) | K2 (g mg−1 min−1) | R2 | ||
| 298 | 425.9 | 415.15 ± 4.09 | 0.200 ± 0.02 | 0.975 | 428.52 ± 1.28 | 0.001 ± 0.0001 | 0.9957 |
| 303 | 446.3 | 444.43 ± 1.54 | 0.552 ± 0.03 | 0.9988 | 448.91 ± 1.05 | 0.006 ± 0.0001 | 0.9996 |
| 313 | 487.2 | 485.17 ± 7.13 | 0.629 ± 0.03 | 0.9995 | 488.61 ± 0.51 | 0.008 ± 0.51 | 0.9998 |
| T (K) | Intraparticle diffusion model | ||
|---|---|---|---|
| Kip (mg g−1 min−1/2) | C1 (mg g−1) | R2 | |
| 298 | 23.90 ± 7.24 | 205.32 ± 53.70 | 0.5476 |
| 303 | 19.45 ± 9.24 | 276.91 ± 68.55 | 0.3297 |
| 313 | 20.89 ± 10.18 | 305.49 ± 75.54 | 0.3185 |
3.5 Adsorption isotherms
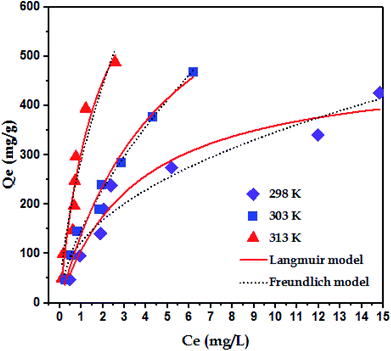
To examine the interaction between paraquat and JS/HSO-700 at equilibrium, the adsorption data were analyzed by nonlinear Langmuir and Freundlich models (Table 1).48,49 From Fig. 6 and Table 3, we infer that the nonlinear Langmuir isotherm fits the adsorption equilibrium data well compared to that observed for Freundlich isotherm for all temperature values. These findings indicate the suitability of the Langmuir equation to describe the adsorption of paraquat onto JS/HSO-700, which is explained by monolayer adsorption of paraquat and the presence of homogenous active sites on the surface of JS/HSO-700.22,50 The obtained adsorption capacity of paraquat onto JS/HSO-700 ranged between 486.70 ± 4.47 and 851.20 ± 13.2 mg g−1. The increase in adsorption capacity (Qmax) with increasing temperature, as explained by Yuanqing Huang and coworkers,22 is because the bond energy between the surface sites of adsorbent and pollutant molecules is larger at higher temperatures and adsorption onto JS/HSO-700 is supported at higher temperatures. Moreover, the adsorption of paraquat onto JS/HSO-700 is favorable at all studied temperatures with the value of RL ranging from 0.26 to 0.017 (Table 4). However, the values of 1/n are less than 1 at all the studied temperatures, indicating chemisorption process of paraquat onto JS/HSO-700.51| T (K) | Langmuir | Freundlich | |||||
|---|---|---|---|---|---|---|---|
| Qmax (mg g−1) | KL (L mg−1) | RL | R2 | KF (mg g−1) (L mg−1)1/n | n | R2 | |
| 298 | 486.70 ± 4.47 | 0.28 ± 0.06 | 0.26–0.034 | 0.9567 | 122.70 ± 15.3 | 2.22 ± 0.29 | 0.9167 |
| 303 | 822.01 ± 1.14 | 0.20 ± 0.04 | 0.33–0.047 | 0.9971 | 148.23 ± 6.9 | 1.57 ± 0.08 | 0.9790 |
| 313 | 851.20 ± 13.2 | 0.55 ± 0.21 | 0.15–0.017 | 0.9256 | 289.07 ± 19.8 | 1.63 ± 0.24 | 0.9051 |
| ΔH (J mol−1) | ΔS (J mol−1 K−1) | ΔG (kJ mol−1) | ||
|---|---|---|---|---|
| 293 K | 303 K | 313 K | ||
| 71.301 | 269.647 | 78.935 | 81.632 | 84.328 |
The sorption capacity of paraquat onto JS/HSO-700 was compared with that of other adsorbents reported in the literature for paraquat removal. For example, Hsu et al.24 used modified rice husk as an adsorbent for paraquat removal and found adsorption capacity of 317.7 mg g−1. Rongchapo et al.19 reported adsorption capacity of 185.2 mg g−1 using NaY as an adsorbent. Also, Hamadi et al.52 utilized commercial activated carbon and showed adsorption capacity of 75.8 mg g−1. It is clear that the prepared JS/HSO-700 is one of the best-reported adsorbents, and it can be considered a promising alternative adsorbent for paraquat removal.
3.6 Thermodynamics of adsorption
A study of the effect of temperature on adsorption of paraquat onto JS/HSO-700 is required. Three temperatures were examined: 298, 303, and 313 K. From our results, it was observed that the solution temperature significantly affects paraquat adsorption onto JS/HSO-700. The thermodynamic parameters such as Gibbs free energy (ΔG, kJ mol−1), enthalpy (ΔH, kJ mol−1) and entropy (ΔS, kJ mol−1 K−1) were determined using Van't Hoff and Gibbs free energy equations (Table 1).53Based on the experimental results displayed in Fig. S1,† we calculated the thermodynamic parameters of paraquat adsorbed onto JS/HSO-700 (Table 4). As shown, the positive values of ΔG indicate that the process is less spontaneous and the positive values of ΔH show the need for energy input from the surroundings for the process to occur. Therefore, the sorption of paraquat on JS/HSO-700 is an endothermic process.54 The positive value of ΔS revealed the affinity of JS/HSO-700 for paraquat and increasing randomness at the solid–solution interface during the adsorption.55
3.7 Regeneration
The regeneration of JS/HSO-700 after paraquat adsorption is conducted by thermal annealing under an N2 atmosphere. From Fig. 7a, we note that the efficacity of JS/HSO-700 decreased by 3.18% after five cycles. Besides, about 97 wt% of JS/HSO-700 was recovered.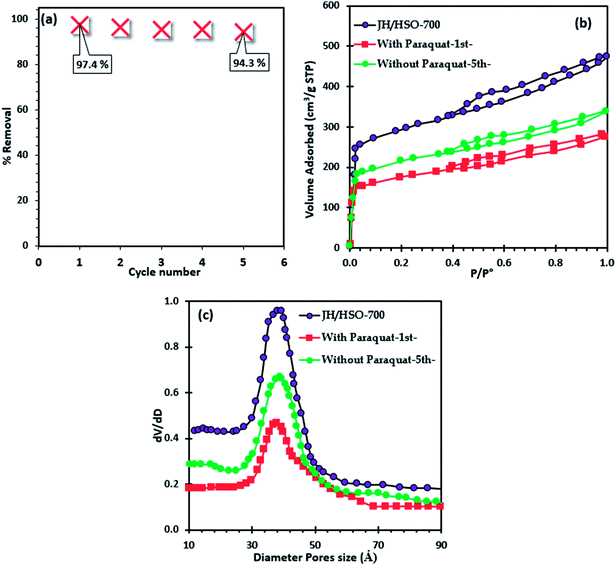 | ||
| Fig. 7 (a) Regeneration of JS/HSO-700, (b) nitrogen physisorption of JS/HSO-700 after paraquat adsorption and (c) pore size distribution. | ||
The decrease in the efficiency of JS/HSO-700 after five cycles is due to the mesopore structure filling mechanism. These results are confirmed by nitrogen physisorption of JS/HSO-700 after adsorption (Fig. 7b), which shows that the surface specific area decreases from 973 to 580 m2 g−1 and the pore volume decreases from 0.75 to 0.40 cm3 g−1 (Table S1†). The N2 adsorption isotherm of regenerated JS/HSO-700 after five cycles (without paraquat-5th-) is quite similar to that of original JS/HSO-700. However, there is slight decrease in SBET and VT (Table S1†), which can be ascribed to the low remaining amount of paraquat molecules on the JS/HSO-700 surface during the regeneration process.
3.8 Mechanism of paraquat adsorbed onto JS/HSO-700
The mechanism of paraquat removal was investigated based on FTIR and Raman before and after adsorption (Fig. S2† and 8a). The FTIR spectra of the prepared JS/HSO-700 show two principal peaks corresponding to –OH functional groups (3254 cm−1) and aromatic C![[double bond, length as m-dash]](https://www.rsc.org/images/entities/char_e001.gif) C bonds (1629 cm−1). However, in FTIR spectra after paraquat adsorption (Fig. 8a), both peaks ascribed to –OH and C
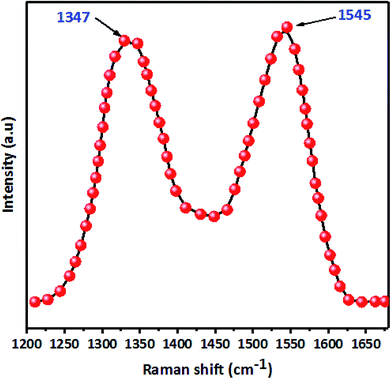
C bonds (1629 cm−1). However, in FTIR spectra after paraquat adsorption (Fig. 8a), both peaks ascribed to –OH and C![[double bond, length as m-dash]](https://www.rsc.org/images/entities/char_e001.gif) C shift by +76 cm−1 and −21 cm−1, which confirms the interaction between these groups and paraquat. Raman spectra (Fig. S2†) of JS/HSO-700 after adsorption confirm these interactions. Moreover, the variation of the ID/IG ratio from 1.03 to 0.98 shows that two typical peaks of carbon with sp3 bonding and graphitic structure with sp2 hybridization participate in the adsorption mechanism of paraquat.
C shift by +76 cm−1 and −21 cm−1, which confirms the interaction between these groups and paraquat. Raman spectra (Fig. S2†) of JS/HSO-700 after adsorption confirm these interactions. Moreover, the variation of the ID/IG ratio from 1.03 to 0.98 shows that two typical peaks of carbon with sp3 bonding and graphitic structure with sp2 hybridization participate in the adsorption mechanism of paraquat.
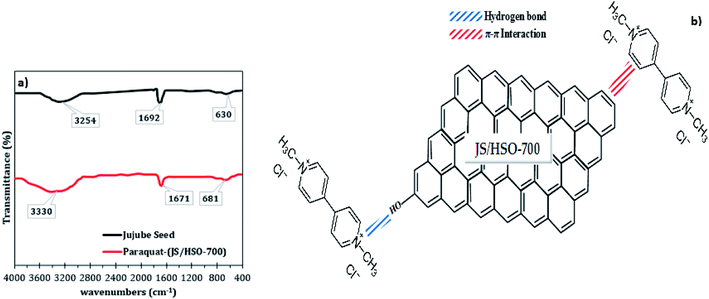 | ||
| Fig. 8 (a) FTIR spectra of JS/HSO-700 after paraquat adsorption; (b) proposed adsorption mechanism of paraquat onto JS/HSO-700. | ||
According to these results, the adsorption mechanism of paraquat onto JS/HSO-700 (Fig. 8b) can be summarized as follows:
(i) The adsorption of paraquat molecule inside the JS/HSO-700 adsorbent (pore filling).
(ii) The π–π interaction between the double bonds of paraquat molecule and those of JS/HSO-700.
(iii) Hydrogen bonding between OH– groups present on the surface of JS/HSO-700 and the nitrogen atoms present in the structure of paraquat molecule.
3.9 Optimization of paraquat sorption using the RSM method: statistical analysis and model interpretation
The procedure of RSM modeling is described in the ESI†. Table S3† represents the ANOVA results of paraquat sorption. The model F-value was found to be 23.0493 and the P-value less than 0.05 implied that the designed model is significant.56,57 In addition, the results of ANOVA showed that the lack-of-fit was not significant; this indicates that the phenomenon was explained very well by our model with a confidence level of 95%.26,58 According to the values of the determination coefficients R2 = 0.956 (Rdj2 = 0.914), we can conclude that there is good agreement between the experimental and predicted responses of paraquat removal onto JS/HSO-700.59,60 In the same context, Fig. 9a shows homogenous distribution of residues on the “0” axis,61 which confirms the normality of the residues and the absence of outliers. In Fig. 9b, the experimental paraquat removal (%) values are very well aligned with the Henry line.62 The significance of each coefficient was determined by P-values (Table 3S†) and insignificant terms were eliminated from the model.59,61–64 Based on these results, the second-order polynomial for paraquat removal is expressed as follows:| R% (paraquat) = 82.025 + 4.798XCT + 3.387XT + 2.104XIC + 5.905XpH − 2.142XCT2 − 1.278XpH2 − 2.346XCT–T |
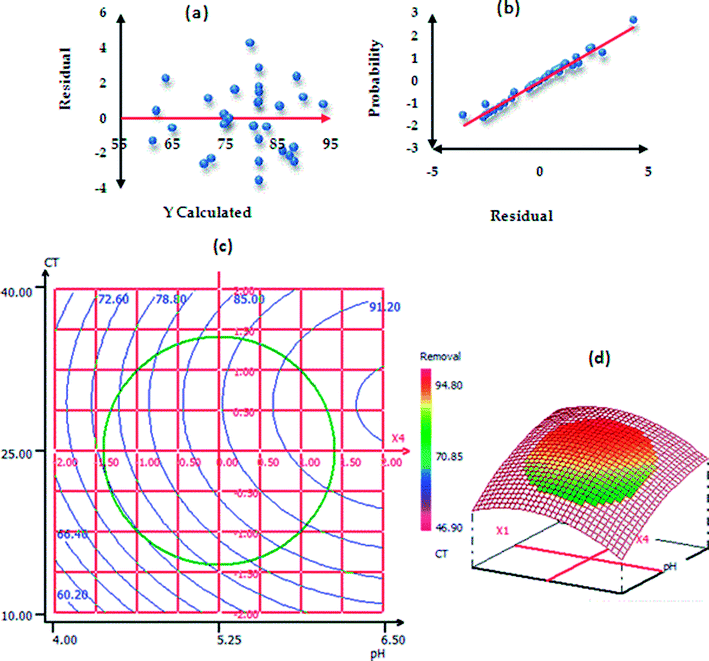 | ||
| Fig. 9 Normality test: (a) plot of raw residuals vs. Ycalculated; (b) probability as a function of residual and (c) contour plots (2D and 3D presentations). | ||
To explain the possible interactions between different parameters and their influences on the adsorption process, CDD is the perfect solution.65 We used 3D and 2D presentation RSM (Fig. 9c) for the optimization of paraquat sorption, and two variables were taken into consideration at a time.66,67 From the results of these presentations, we infer that the increase in the pH values from 4 to 6.5 increases the paraquat removal (%) significantly from 60.20 to 85%. In addition, the increase in contact time favored the increase in paraquat removal from 85% to 94.4%. Based on RSM presentation, the optimum conditions for the highest removal yield of paraquat were found: pH = 6.49, CT = 25.88 min, T = 308 K and IC = 87.50 mg L−1. In these new conditions, the experimental paraquat removal efficiency was found to be 96.7 ± 2.02%, whereas the value predicted by model was 94.31 ± 4.43%. Both values are practically identical, which shows that the model-predicted values are in very good agreement with the experimentally determined values.
3.10 Cost analysis: JS/HSO-700 as a low-cost adsorbent
The estimated cost of the process based on experimental results of paraquat adsorption onto JS/HSO-700 is very important for its practical applications including the estimated cost of energy consumption as well as the cost of reagents (sulfuric acid). The following equation was used to assess the cost of the current process:68,69| Operating cost = Cenergy + ∑Creagents |
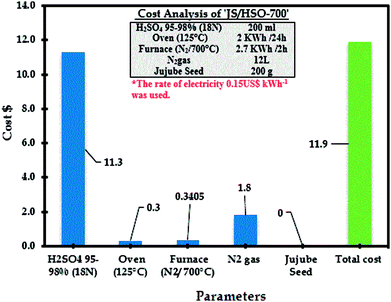
The operational cost is usually represented in US$ per m3 or US$ per kg of pollutants. Cenergy in our case represents the energy consumption of the furnace and oven in US$70 and Creagents is the cost of the reagents used in US$. From RSM-CDD analysis, the optimum conditions for paraquat removal onto JS/HSO-700 are found to be JS/HSO-700 dose = 20 mg, volume = 100 mL, pH = 6.49, CT = 25.88 min, T = 308 K and IC = 87.50 mg L−1. Therefore, the operating cost for paraquat removal at these optimum operating conditions was calculated as 11.9 US$ per m3, which revealed that this adsorption process can be effectively used for the removal of paraquat onto our absorbent. Additionally, the analysis revealed that the cost of electricity was very minor as compared to that of the chemical treatment with sulfuric acid (Fig. 10).
4. Conclusion
This present study reports the remarkable potential of jujube seeds as an outstanding and low-cost precursor for carbonated adsorbent. A cost analysis performed by our team provides proof of the low operating cost using this eco-friendly material. JS/HSO-700 presents a large surface area with a BET surface area of 973 m2 g−1, micropore volume of 0.75 cm3 g−1, and an average pore size of 39.3 Å. These parameters decreased after adsorption of paraquat, suggesting a mesopore filling mechanism along with the deposition of some functional groups of paraquat on the JS/HSO-700 surface. The adsorption results were better described by the pseudo-second-order kinetic model. Langmuir isotherm model best fitted the adsorption equilibrium data, giving maximum adsorption capacities (Qm) of 526.3, 625, and 714 mg g−1 at 298, 303, and 313 K, respectively. The adsorption mechanism was proposed based on solution pH, Raman, FTIR, and BET analyses after adsorption. We concluded that electrostatic interactions between paraquat and JS/HSO-700 adsorbent, π–π interactions, and hydrogen bonding are the main possible phenomena to describe this mechanism. Finally, these parameters were optimized by the RSM-CCD method.Conflicts of interest
Authors declare that they have no conflict of interest.Acknowledgements
This work was supported by the University of Ibn Zohr Faculty of Sciences.References
- C. Steven and W. Lenhart, Health Hazard Evaluation Report 94–0413–2560 U.S. Department of Agriculture Animal and Plant Health Inspection Service Plant Protection and Quarantine, Fayetteville, North Carolina, 1996 Search PubMed
.
- L. A. Summers, in Advances in Pesticide Science, ed. H. Geissbühler, P. C. Kearney and G. T. Brooks, Pergamon, 1979, p. II-13 Search PubMed
.
- R. Macholz, Nahrung, 1985, 29, 1020 Search PubMed
.
- U. S. EPA, Exposure Factors Handbook (Final Report, 1997), U.S. Environmental Protection Agency, Washington, DC, EPA/600/P-95/002F a-c, 1216 pages, 1997 Search PubMed
.
- D. C. Ricketts, Pestic. Sci., 1999, 55, 596–598 CrossRef CAS
.
- D. Ait Sidhoum, M. M. Socías-Viciana, M. D. Ureña-Amate, A. Derdour, E. González-Pradas and N. Debbagh-Boutarbouch, Appl. Clay Sci., 2013, 83–84, 441–448 CrossRef CAS
.
- H. Nur, A. F. N. A. Manan, L. K. Wei, M. N. M. Muhid and H. Hamdan, J. Hazard. Mater., 2005, 117, 35–40 CrossRef CAS PubMed
.
- Z. Mojović, P. Banković, A. Milutinović-Nikolić, J. Dostanić, N. Jović-Jovičić and D. Jovanović, Chem. Eng. J., 2009, 154, 149–155 CrossRef
.
- K. Mahmoudi, K. Hosni, N. Hamdi and E. Srasra, Korean J. Chem. Eng., 2015, 32, 274–283 CrossRef CAS
.
- W. Rongchapo, P. Khamdahsag, N. Grisdanurak, S. Prayoonpokarach and J. Wittayakun, Suranaree J. Sci. Technol., 2016, 23, 343–350 Search PubMed
.
- W. Amondham, P. Parkpian, C. Polprasert, R. D. Delaune and A. Jugsujinda, J. Environ. Sci. Health, Part B, 2006, 41, 485–507 CrossRef PubMed
.
- B. Singh and K. Singh, Crit. Rev. Microbiol., 2016, 42, 245–261 CrossRef CAS PubMed
.
- V. R. Hebert and G. C. Miller, J. Agric. Food Chem., 1990, 38, 913–918 CrossRef CAS
.
- D. Janke, J. Basic Microbiol., 1989, 29, 718 CrossRef
.
- M. A. Constenla, D. Riley, S. H. Kennedy, C. E. Rojas, L. E. Mora and J. E. B. Stevens, J. Agric. Food Chem., 1990, 38, 1985–1988 CrossRef CAS
.
- D. R. Narine and R. D. Guy, Soil Sci., 1982, 6, 133 Search PubMed
.
- P. Mac Carthy and K. E. Djebbar, J. Environ. Qual., 1986, 15, 103–107 CrossRef CAS
.
- G. Rytwo, S. Nir and L. Margulies, Soil Sci. Soc. Am. J., 1996, 60, 601–610 CrossRef CAS
.
- W. Rongchapo, O. Sophiphun, K. Rintramee, S. Prayoonpokarach and J. Wittayakun, Water Sci. Technol., 2013, 68, 863–869 CrossRef CAS PubMed
.
- C. Yan, Y. Chunping, H. Huijun, Z. Guangming, Z. Kun and Y. Zhou, J. Environ. Eng., 2016, 142, C4015001 CrossRef
.
- H. J. He, Z. H. Xiang, X. J. Chen, H. Chen, H. Huang, M. Wen and C. P. Yang, Int. J. Environ. Sci. Technol., 2018, 15, 1491–1500 CrossRef CAS
.
- Y. Huang, C. Yang, Z. Sun, G. Zeng and H. He, RSC Adv., 2015, 5, 11475–11484 RSC
.
- M. M. Rahman, M. Bintey Shajahan, M. Awang, K. Yunus and T. A. Razak, in Advances in Materials and Processing Technologies XV, Trans Tech Publications, 2014, vol. 773, pp. 471–477 Search PubMed
.
- S.-T. Hsu and T.-C. Pan, Bioresour. Technol., 2007, 98, 3617–3621 CrossRef CAS PubMed
.
- M. Zbair, K. Ainassaari, A. Drif, S. Ojala, M. Bottlinger, M. Pirilä, R. L. Keiski, M. Bensitel and R. Brahmi, Environ. Sci. Pollut. Res., 2018, 25, 1869–1882 CrossRef CAS PubMed
.
- M. Zbair, Z. Anfar, H. Khallok, H. A. Ahsaine, M. Ezahri and N. Elalem, Fullerenes, Nanotubes, Carbon Nanostruct., 2018, 26, 433–442 CrossRef CAS
.
- H. Ait Ahsaine, M. Zbair, Z. Anfar, Y. Naciri, R. El haouti, N. El Alem and M. Ezahri, Mater Today Chem., 2018, 8, 1–12 CrossRef
.
- I. Anastopoulos, A. Bhatnagar, B. Hameed, Y. S. Ok and M. Omirou, J. Mol. Liq., 2017, 240, 179–188 CrossRef CAS
.
- I. Anastopoulos, I. Margiotoudis and I. Massas, Int. J. Phytoremediation, 2018, 20, 831–838 CrossRef CAS PubMed
.
- P. Fu, L. Zhou, L. Sun, B. Huang and Y. Yuan, RSC Adv., 2017, 7, 13383–13389 RSC
.
- B. Wielage, T. Lampke, G. Marx, K. Nestler and D. Starke, Thermochim. Acta, 1999, 337, 169–177 CrossRef CAS
.
- C. Bouchelta, M. S. Medjram, O. Bertrand and J.-P. Bellat, J. Anal. Appl. Pyrolysis, 2008, 82, 70–77 CrossRef CAS
.
- H. Deng, G. Li, H. Yang, J. Tang and J. Tang, Chem. Eng. J., 2010, 163, 373–381 CrossRef CAS
.
- Y. Ji, T. Li, L. Zhu, X. Wang and Q. Lin, Appl. Surf. Sci., 2007, 254, 506–512 CrossRef CAS
.
- F. Cesano, D. Scarano, S. Bertarione, F. Bonino, A. Damin, S. Bordiga, C. Prestipino, C. Lamberti and A. Zecchina, J. Photochem. Photobiol., A, 2008, 196, 143–153 CrossRef CAS
.
- J. Weißmüller, Angew. Chem., 1990, 102, 236–237 CrossRef
.
- W. T. Tsai and H. R. Chen, Int. J. Environ. Sci. Technol., 2013, 10, 1349–1356 CrossRef CAS
.
- S. Lagergren, K. Sven. Vetenskapsakad. Handl., 1898, 24, 1 Search PubMed
.
- Y. Liu, Colloids Surf., A, 2008, 320, 275–278 CrossRef CAS
.
- G. Mckay, Process Biochem., 1999, 34, 451 CrossRef
.
- W. J. Weber and J. C. Morris, J. Sanit. Eng. Div., Am. Soc. Civ. Eng., 1963, 89, 31–60 Search PubMed
.
- I. Langmuir, J. Am. Chem. Soc., 1916, 38, 2221–2295 CrossRef CAS
.
- S. Fan, Y. Wang, Z. Wang, J. Tang, J. Tang and X. Li, J. Environ. Chem. Eng., 2017, 5, 601–611 CrossRef CAS
.
- H. Freundlich, Z. Phys. Chem, 1906, 57, 385 CAS
.
- W. Tsai and C. Chang, J. Environ. Sci. Health, Part A: Environ. Sci. Eng., 1995, 30, 525–535 Search PubMed
.
- B. H. Hameed, A. A. Ahmad and N. Aziz, Chem. Eng. J., 2007, 133, 195–203 CrossRef CAS
.
- Q. Chai, L. Lu, Y. Lin, X. Ji, C. Yang, S. He and D. Zhang, Environ. Sci. Pollut. Res., 2018, 25, 18443–18450 CrossRef CAS PubMed
.
- H. Freundlich, Z. Phys. Chem, 1906, 57A, 385 Search PubMed
.
- I. Langmuir, J. Am. Chem. Soc., 1916, 252, 2221–2295 CrossRef
.
- M. Jabli, E. Gamha, N. Sebeia and M. Hamdaoui, J. Mol. Liq., 2017, 240, 35–44 CrossRef CAS
.
- K. Y. Foo and B. H. Hameed, Chem. Eng. J., 2010, 156, 2–10 CrossRef CAS
.
- N. K. Hamadi, S. Swaminathan and X. D. Chen, J. Hazard. Mater., 2004, 112, 133–141 CrossRef CAS PubMed
.
- X. Han, W. Wang and X. Ma, Chem. Eng. J., 2011, 171, 1–8 CrossRef CAS
.
- G. A. Adebisi, Z. Z. Chowdhury and P. A. Alaba, J. Cleaner Prod., 2017, 148, 958–968 CrossRef CAS
.
- H. M. F. Freundlich, J. Phys. Chem., 1906, 57, 385–471 CAS
.
- Z. Anfar, M. Zbair, H. A. Ahsaine, M. Ezahri and N. El Alem, Fullerenes, Nanotubes, Carbon Nanostruct., 2018, 26, 389–397 CrossRef CAS
.
- M. Zbair, Z. Anfar, H. A. Ahsaine, N. El Alem and M. Ezahri, J. Environ. Manage., 2018, 206, 383–397 CrossRef CAS PubMed
.
- M. Zbair, K. Ainassaari, Z. El Assal, S. Ojala, N. El Ouahedy, R. L. Keiski, M. Bensitel and R. Brahmi, Environ. Sci. Pollut. Res., 2018, 25, 35657–35671 CrossRef CAS PubMed
.
- M. K. Satapathy and P. Das, J. Environ. Chem. Eng., 2014, 2, 708–714 CrossRef CAS
.
- M. Zbair, H. A. Ahsaine and Z. Anfar, J. Cleaner Prod., 2018, 202, 571–581 CrossRef CAS
.
- S. Dashamiri, M. Ghaedi, A. Asfaram, F. Zare and S. Wang, Ultrason. Sonochem., 2017, 34, 343–353 CrossRef CAS PubMed
.
- M. T. Tanyildizi, Chem. Eng. J., 2011, 168, 1234–1240 CrossRef CAS
.
- U. Guyo, T. Makawa, M. Moyo, T. Nharingo, B. C. Nyamunda and T. Mugadza, J. Environ. Chem. Eng., 2015, 3, 2472–2483 CrossRef CAS
.
- Y. Ding and M. Sartaj, J. Environ. Chem. Eng., 2015, 3, 807–814 CrossRef CAS
.
- T. A. Saleh, A. Sari and M. Tuzen, J. Environ. Chem. Eng., 2017, 5, 1079–1088 CrossRef CAS
.
- I. A. Bhatti, N. Ahmad, N. Iqbal, M. Zahid and M. Iqbal, J. Environ. Chem. Eng., 2017, 5, 2740–2751 CrossRef CAS
.
- M. Rahimdokht, E. Pajootan and M. Arami, J. Environ. Chem. Eng., 2016, 4, 1407–1416 CrossRef CAS
.
- A. Dalvand, M. Gholami, A. Joneidi and N. M. Mahmoodi, Clean: Soil, Air, Water, 2011, 39, 665–672 CAS
.
- D. A. M. Saad and H. Tahir, Ultrason. Sonochem., 2017, 38, 197–213 CrossRef PubMed
.
- O. S. Bello, S. Afr. J. Chem., 2013, 66, 32–41 CAS
.
Footnote |
| † Electronic supplementary information (ESI) available. See DOI: 10.1039/c8ra09337g |
| This journal is © The Royal Society of Chemistry 2019 |

