 Open Access Article
Creative Commons Attribution 3.0 Unported Licence
The surface-enhanced resonance Raman scattering of dye molecules adsorbed on two-dimensional titanium carbide Ti3C2Tx (MXene) film†
Satheeshkumar
Elumalai‡
 *a,
John R.
Lombardi
b and
Masahiro
Yoshimura
ac
aHierarchical Green-Energy Materials (Hi-GEM) Research Center, Department of Material Science and Engineering and Promotion Center for Global Materials Research (PCGMR), National Cheng Kung University, Tainan 701, Taiwan. E-mail: analyticalsathi@gmail.com
bDepartment of Chemistry, The City College of New York, 160 Convent Avenue, New York, NY 10031, USA
cTokyo Institute of Technology, Tokyo 152-8550, Japan
First published on 30th March 2020
Abstract
In this report, the Raman enhancement of adsorbed dye molecules on a spin-cast two-dimensional (2D) titanium carbide Ti3C2Tx (MXene) film via resonance Raman scattering, so-called MXenes-enhanced resonance Raman scattering (MERRS), was observed. Based on the energy level diagram of the molecule–MXene system, we determined that the location of the charge-transfer transition from the HOMO of crystal violet (CV) to the Fermi level should be at or close to 1.9 eV. This indicates a considerable charge-transfer intensity contribution to the overall SERS enhancement. The as-prepared film showed itself to be extremely sensitive for the detection of CV dye molecules with a surface coverage of 12.732 pg cm−2, and the calculated enhancement factor reached 3.42 × 10⁹.
Surface-enhanced Raman scattering (SERS) is a commonly used rapid analytical technique for the chemical, material and life sciences discovered over 40 years ago.1–3 Recent research in SERS has been on the development of new enhancing substrates for widespread applications. Notably, noble metals (Ag and Au) as SERS substrates have shown enhancement factors of several orders of magnitude.1,4–6 Such a tremendous Raman signal enhancement can be explained by both the electromagnetic mechanism (EM) and the chemical mechanism (CM) where the resonance of the laser is with a surface plasmon resonance (SPR) in the underlying metal nanostructure.4,5
EM enhancement is obtained by the localized surface plasmon resonance (LSPR) of plasmonic or noble metals excited by the excitation laser, while CM enhancement is responsible for the resonance of the charge-transfer (CT) process via CT state complexes formed between substrate materials and absorbed molecules with the incident laser.3–5 There have been numerous noble metal-based SERS substrates for which the enhancement factor (EF) relies on the type of metal, the size, the shape and whether an excitation wavelength laser is being used which are the foremost contributions to the EM. However, non-metallic based substrates have increasingly shown some advantages over metal substrates, such as bandgap, control of stoichiometry, doping (n- and p-type), stability and resistance to degradation.7–9 By combing the SERS and resonance Raman (RR), detection of the single-molecule (SM) level can be achieved by enhancement factors (EFs) up to 1014 where the electronic transition, i.e. the molecular resonance (λmol) of the Raman probe molecules resonant at an excitation wavelength of laser (λ0) is being used.
Two-dimensional (2D) materials have also been explored for use in SERS due to their layer-dependent optical properties.6,10–15 The Raman enhancement mechanism from the monolayers of the 2D material is believed to be mainly CM.2,5,16 It has been reported that another family of 2D materials, transition metal carbides and nitrides (MXenes) can be used as SERS substrates10–13,15 and for other applications.17–19 Both the structure and electronic properties of MXene–Ti3C2Tx were largely affected by the functional groups on the MXenes where X = –F, –O and –OH.11,20–22 Density functional theory (DFT) simulations have reported on the band diagrams and the optical properties of monolayer MXenes; however, the obtained values are yet to be verified by experimental measurements.20–22
According to DFT and high-resolution electron energy-loss spectroscopy (HREELS), the Ti3C2Tx (X = –F or –OH) exhibits intense surface plasmons (SPs) due to the intra- and inter-band transition at the nanometer scale.20,21,23,24 Moreover, the single or few-layered Ti3C2Tx flakes had shown both plasmonic and high metallic conductivity with large transmissivity; however, the metallic characteristics of MXene decreased with the increase in the width of the monolayers.23 The SP resonance in MXene can be tuned by altering the electronic structure while controlling the thickness of the film; as the thickness of the MXene film decreased, a reduction in the bulk plasmons was observed, while the intensity of the SP increased significantly.23,24 An enhancement of the SP intensity has been observed at low thicknesses of MXene film, which significantly increases the total cross-section of the film.23,24 Recently, the SPR sensitivity of a MXene based sensor was decreased by increasing the thicknesses of the Ti3C2Tx flakes.25 For MXene based SERS substrates, the thickness of the film is a key factor towards achieving a metallic nature and minimizing the fluorescence background from the thicker MXene.23
In this work, we report surface-enhanced resonance Raman scattering (SERRS)26 from dyes molecules adsorbed onto a spin-cast Ti3C2Tx film surface, so-called MXenes-enhanced resonance Raman scattering (MERRS) is proposed and we have proposed the SERS mechanism based on the energy level diagram of the molecule–MXene system, which is not reported yet. A transparent SERS substrate (Fig. S1, ESI†) based on Ti3C2Tx films was produced by spin-casting a diluted aqueous solution (50 μg ml−1) of d-Ti3C2Tx colloidal flakes onto glass with various runs (r), ranging from r1 to r3 where the subscript denotes the number of runs (200 μl colloidal d-Ti3C2Tx solution was used for each run). The UV-vis NIR spectra of the colloidal d-Ti3C2Tx flakes (50 μg ml−1) and Ti3C2Tx–MXene films spin-casted with various thicknesses on glass are shown in Fig. 1a top and bottom, respectively. The d-Ti3C2Tx colloidal solution shows two distinguishable broad absorption peaks at around 200–400 nm, and 600–1000 nm due to the functional groups (Tx = –F, –O, –OH) present in the oxidized MXene and SP caused by the interband transitions (IBT) in MXene,11,22–24,27–30 respectively.
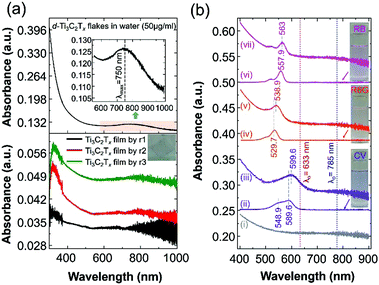 | ||
| Fig. 1 (a) UV-vis NIR spectra of an aqueous solution of delaminated Ti3C2Tx–MXene (d-Ti3C2Tx) flakes with a concentration of 50 μg ml−1 (top) and various thicknesses of Ti3C2Tx film prepared on a glass substrate by spin-casting (bottom) with a run number ranging from r1 to r3. A photograph of the Ti3C2Tx thin film on glass is presented in the inset (Fig. 1a, bottom). For the UV-vis analysis, distilled water and bare glass were used for the background measurements of the colloidal MXene and the film, respectively. (b) The UV-vis spectra of the Ti3C2Tx film@glass substrate (i: black colour spectrum), various dye solutions in ethanol (ii: 0.8425 × 10⁻⁶ M CV; iv: 0.8155 × 10⁻⁶ M R6G; and vi: 0.8829 × 10⁻⁶ M RB; the corresponding dye solutions are shown in the inset photograph) and three dye molecules (ii: CV; v: R6G; and vii: RB), which were drop-cast (300 μL) onto the Ti3C2Tx film@glass substrate (the size of the glass substrate is 18 mm × 18 mm; area a = 3.24 cm2). | ||
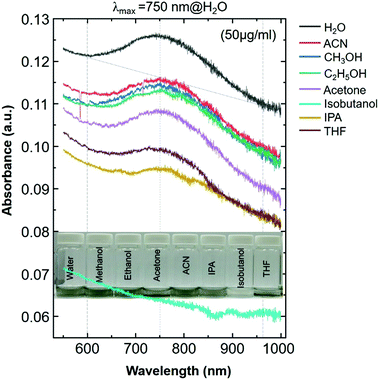
The SP peak of the d-Ti3C2Tx colloidal solution is independent of the dielectric constant of the surrounding solvents where (Fig. S2, ESI†) the peak shifting was not obvious when other organic molecules were used for the delamination of Ti3C2Tx (both intercalation and subsequent delamination of the organic molecule-intercalated Ti3C2Tx bath sonication in the corresponding organic solvent). In the case of the metal nanoparticles, the SPR absorption peak maximum (λmax) position is sensitive to the dielectric constant of the surrounding medium as well as the type of functionalized molecules that are bound to its surface.31 Note that the d-Ti3C2Tx flakes obtained by the organic molecule did not alter the optical absorption characteristics of the Ti3C2Tx film (Fig. 2). The SP absorption peak maximum (λmax) is located at around 750 nm in solution (Fig. 1a, top) and such a peak is not seen for the film obtained by r1 (Fig. 1a, bottom), however, it was achieved by increasing the film thickness by repeating the spin-casting run from r1 to r3. The UV-vis NIR transmittance spectra of various spin-cast Ti3C2Tx films on glass are measured and the resulting %T values (the value at 550 nm is taken for the %T) are 89, 79 and 64 for the films obtained by r1, r2 and r3, respectively.27 In the thicker coating of the glass supported Ti3C2Tx film (also in solution) have a strong increased SP of the optical absorption peak is shown in both the visible and the infrared (IR) regions.11,23,27,32
In this study, we have chosen the minimum thickness of glass-supported Ti3C2Tx film (obtained by r3 by keeping the minimum intensity of the SP peak of the MXene film) to evaluate the SERS performance of different dyes (cationic dyes such as crystal violet – CV and rhodamine 6G – R6G and a hydrophilic anionic dye, rose bengal – RB). It has been reported that the Raman enhancement of dyes is solely dependent on the thickness of the MXene film, as well as the type of supporting substrate, like glass, Si or filter paper.10–13,15,33 Previously, we have shown that SERS enhancement of the Ti3C2Tx thin film on SiO2/Si exhibited a higher EF (5 × 10⁵; λ0 = 514 nm; EF based on both the EM and interband transition/charge transfer (CT) mechanism of the enhancement) than those with a thicker and more uniform coating of Ti3C2Tx film on SiO2/Si by spray-coating.11 However, increasing the thickness of the Ti3C2Tx film leads to a decreased SPR sensitivity as well as the Raman enhancement of dyes adsorbed on Ti3C2Tx on the Si/SiO2 substrate.11,25 Therefore, various thicknesses of the MXene film showed different optical properties, while in the case of the SERS measurements, the thickness of the film (including the metal nanoparticle film) is more sensitive towards the EF.2,34,35 Accordingly, the glass supported Ti3C2Tx film produced by r3 will be used as the SERS substrate for the SM detection based on the molecular resonance (λmol) Raman scattering of the CV dye molecule, which is reported in this study.
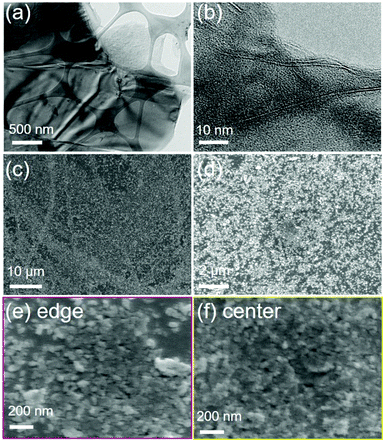
A CV dye is often used as a model Raman probe molecule for SM-SERS due to its very large Raman cross-section when the excitation laser wavelength (λ0) of 633 nm is closer to the molecular resonance (λmol) of the dye molecule.1,2,36–38 Besides, glass supported Ti3C2Tx films with thicknesses down to ∼5 nm have shown similar metallic characteristics,27 therefore they are expected to have a higher EF. Therefore, in this present study, a spin-cast colloidal solution of MXene is diluted 180 times more than our previous study.11 The morphology of the d-Ti3C2Tx flakes (Fig. 3) was examined by transmission electron microscopy (TEM), the corresponding colloidal solution of d-Ti3C2Tx flakes was spin-cast on glass (by r3) and the resulting film was investigated by field emission-scanning electron microscopy (FE-SEM). The TEM images show the layered structured of the d-Ti3C2Tx flakes which consist of single or few-layered MXene flakes with a lateral flake size of around 1 μm (Fig. 3). Furthermore, FE-SEM images revealed that the as-produced Ti3C2Tx film by r3 has a uniform coating at the centre of the glass, while spin-cast flakes at the edge of the glass were not uniformly coated (Fig. 3e).
We first analysed the UV-vis spectra of the Ti3C2Tx film and the probed dye molecules adsorbed on the Ti3C2Tx film to determine the SERS performance of the Ti3C2Tx substrate and the contribution of the CM (including molecular resonance and CT resonance) enhancement. Fig. 1b shows the UV-vis optical absorption spectrum of the Ti3C2Tx film on glass, dyes in solution and drop-cast dye molecules on the Ti3C2Tx film on the glass. The dye solutions in ethanol exhibited a strong absorption λmax at 589.9, 529.7 and 557.9 nm for CV, R6G and RB, respectively. It should be noted that the SP peak of the Ti3C2Tx film does not shift even after the adsorption of dye molecules, whereas a redshift with broadening (absorption λmax at 559.6, 538.9 and 563 nm for the CV@Ti3C2Tx, R6G@Ti3C2Tx and RB@Ti3C2Tx film, respectively) absorption peaks was seen, suggesting the evidence of chemisorption of dye molecules on the MXene surface.2 For the SM-SERS, owing to the absorption peak position (λmax at 559.6 nm) of CV@Ti3C2Tx, an excitation laser wavelength (λ0) of 633 nm was selected because of both the intramolecular resonance and the CT resonance, which are simultaneously active.
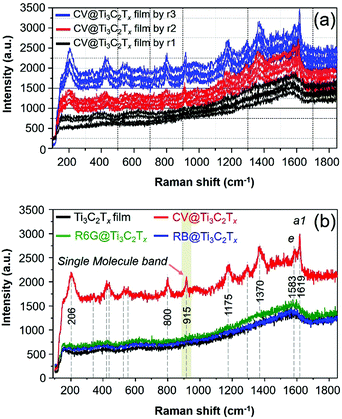
Ti3C2Tx SERS substrates of different thicknesses are fabricated, and the corresponding SERS spectra of the CV adsorbed Ti3C2Tx films are presented in Fig. 4a. The SERS measurement of these substrates was examined, and the uniformity of film is also presented by the acquisition of the Raman spectrum of CV from the randomly selected spot of the Ti3C2Tx film substrate. The surface coverage of ca. 12.732 ng cm−2 of the CV dye molecule on these substrates (Fig. 4a) remains the same unless otherwise specified (Fig. 4a). The SERS signal of the CV dye is gradually enhanced by increasing the thicknesses of the film as presented in Fig. 4a. The SERS signal from the substrate produced by r3 has a uniform Raman signal while r2 > r1. We have also prepared a thicker Ti3C2Tx film SERS substrate (produced by r10, Fig. S2, ESI†), it showed a notably lower EF than those with a thin coating of Ti3C2Tx film on glass (by r3) in comparison (Fig. S2, ESI†). The thicker film had a strong, intense SP peak nearby the excitation laser wavelength of 633 nm,11 thereby resulting in a strong fluorescence background from the MXene (Fig. S2, ESI†). It is therefore evident that our observation is consistent with a previous result on the effect of the thickness of Ti3C2Tx film on the SERS signal of the dye, regardless of the supporting substrate (such as SiO2/Si11).
Therefore, we have optimized the conditions to prepare MXene based SERS substrates with a minimum thickness of film where the substrate did not show a strong intense SP peak nearby the excitation laser wavelength of 633 nm, thereby, it was observed that a strong fluorescence background can be avoided/minimized for the substrate (Fig. S2, ESI†). In addition, the SERS spectra of other dye molecules (R6G and RB) that were drop-cast on the Ti3C2Tx film were also examined and the acquired SERS spectra of these dyes are presented in Fig. 4b. Neither of the R6G and RB dyes show an enhanced Raman signal because the λmol of these probe molecules does not lie near to λ0 (Fig. 1b), however, these dyes show an enhanced Raman signal with an EF of 105 by the λ0 = 515 nm laser.11 For the CV adsorbed MXene film, as shown in Fig. 2b (red spectrum), the SERS bands at 1619 and 1583 cm−1 are assigned as the totally symmetric (a1) mode and nontotally symmetric (e) mode of CV based on D3 symmetry in accordance with previous reports.37,39 For the SERS and SM-SERS of the CV dye, the a1 mode (at 1619 cm−1) is predicted to be a more strongly enhanced Raman signal than the e mode (at 1583 cm−1) based on the Herzberg–Teller surface selection rule.36–38
Next, the enhanced Raman bands at 800 and 1175 cm−1 are both attributed to the overlapping of a1 and e vibrations, respectively, and other vibrational modes of the CV molecules adsorbed on the MXene film are also tabulated (Table S1, ESI†). Note that the vibrational bands at 1619, 1586, 1175, 915 and 800 cm−1 are assigned to the SM-SERS detection of the CV dye on the MXene film.37 To study the EM enhancement effect from the Ti3C2Tx film, the λ0 = 785 nm laser was used by utilizing the SP nature of Ti3C2Tx where the absorption λmax of the Ti3C2Tx film is very close to the λ0 (Fig. 1b, vertical blue line). The absorption λmax values of these dyes adsorbed on the Ti3C2Tx substrates were located between 500 and 650 nm, indicating that the dyes are not intrinsic resonance frequency matched to the λmol nor for CT when λ0 = 785 nm. Moreover, it is necessary to keep the film thickness as minimal as possible to avoid the resonance fluorescence background from the Ti3C2Tx film since the SP of the MXene substrate will resonate at λ0 = 785 nm laser.
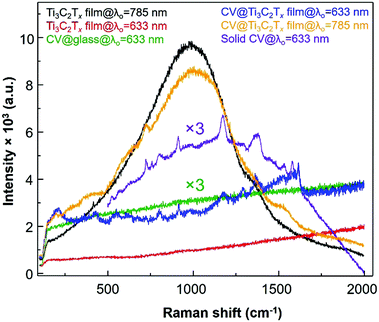
The SERS spectrum acquired with λ0 at 785 nm has a stronger fluorescence background with much less Raman enhancement of the chemisorbed CV dye as compared to that resulting from film excitation with the λ0 = 633 nm laser. Such a stronger fluorescence background is possibly due to the fact that the longitudinal SP absorption peak (λmax = 750 nm) can be in resonance with an excitation wavelength of the 785 nm laser which causes more background fluorescence than Raman scattering of the adsorbed CV dye molecule which was shifted to a higher energy than the absorption peak of CV. When the excitation laser wavelength of the laser (λ0 = 785 nm) matches with the SP of the Ti3C2Tx thin film (SP is located between 600 and 900 nm as seen in the green spectrum at the bottom plot of Fig. 1a), the Raman enhancement of CV was not dominated by fluorescence, however, both Raman and fluorescence are enhanced together (orange spectrum in Fig. 5). However, while the enhanced Raman signal of the CV dye molecule is more pronounced from the radiative resonance Raman enhancement, the fluorescence emission from the Ti3C2Tx film is minimized when the λ0 was 633 nm (blue spectrum in Fig. 5). Therefore, the selection of λ0 for the Ti3C2Tx–MXene based substrate can be subject to “quenching of fluorescence” effects from the substrate whilst an enhanced SERS signal can be seen.
On a different note, when the absorption band edge of both the dye molecule and the Ti3C2Tx film is indirectly resonant with the λ0 (Fig. 1b, red spectrum), the fluorescence is mostly quenched (with respect to the Ti3C2Tx SERS substrate) by nonradiative processes. Besides the thickness of the film, importantly, the MXene based SERS substrate also depends on whether resonant (785 nm laser) or non-resonant excitation (633 nm laser) is being used. Other dyes are also acquired by a λ0 = 785 nm laser, however, these dyes show a very weak enhancement in the Raman signal for the thicker Ti3C2Tx substrate compared to the thin film (Fig. S3 and S4, ESI†). Additionally, the Ti3C2Tx substrate was used for the non-resonant Raman reporters (pNTP, pATP, pHTP and pMBA) and the acquired Raman signal from these molecules were not enhanced by the 633 nm laser (Fig. S5, ESI†). In comparison to the non-resonance conditions (at 785 nm laser), the Ti3C2Tx substrate showed an enhancement of the Raman scattering of the CV dye via resonance effects. We found an optimal thickness of Ti3C2Tx film on the glass surface and observed a greater 3.42 × 10⁹ enhancement in the SERS signal from the crystal violet (CV) dye molecule using the λ0 = 633 nm laser.
We now turn to analysis of these observations within the framework of the unified approach theory of SERS on metal substrates.40 In this theoretical approach, it is shown that breakdowns in the Born–Oppenheimer approximation caused by Herzberg–Teller vibronic coupling produce pairs of coupled resonances in the molecule–metal system. The surface-plasmon resonance (SPR), the charge-transfer resonance (CT) and the molecular resonances (λmol) are coupled by terms in the numerator, producing a synergistic effect between the various resonances, leading to prediction of the ultra-high enhancements observed in SERS.
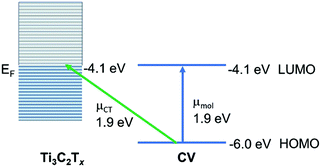
This is the most appropriate procedure since the MXene substrate behaves like a metal,41 with surface-plasmon resonances (near 750 nm) and a work function at the Fermi level (−4.1 eV). Using the well-known HOMO and LUMO of CV37 we may construct an energy level diagram (Fig. 6) of the molecule–metal system and determine that the location of the charge-transfer transition from the HOMO of CV to the Fermi level should be at or close to 1.9 eV. This is confirmed by the broad absorption peak of CV@Ti3C2Tx observed at λmax = 559.6 nm, which can be assigned as the charge-transfer transition. It is this charge-transfer resonance that is expected to be responsible for the SERS enhancement, and therefore it is expected that it lies close to the wavelength of the optimum enhancement which is λmax = 633 nm. Note also the close coincidence of the charge-transfer band with the molecular transition. This enables much stronger coupling of the two transitions, as well as a likely somewhat large Herzberg–Teller coupling constant. Both of these effects are possibly responsible for the relatively large enhancement observed here. Furthermore, we may test this theory by applying the SERS selection rules, which for metal substrates may be summarized by:
| Γ(Qk) = Γ(μCT)XΓ(μmol) |
In summary, we have shown the large enhancement factor (EF) of 3.42 × 10⁹ based on resonance Raman (RR) signal of crystal violet (CV) dyes onto the two-dimensional (2D) MXene–Ti3C2Tx film, so called MXenes-enhanced resonance Raman scattering (MERRS) is reported. The surface plasmons (SPs) of the delaminated Ti3C2Tx (d-Ti3C2Tx) colloid shown an independent absorption maximum (λmax) when d-Ti3C2Tx flakes immersed in various dielectric solvent media; this does not alter the optical absorption characteristics of the Ti3C2Tx film. The enhancement factor (EF) of dye molecules depends on both the film thicknesses and the excitation wavelength of the laser (λ0) being used. Synergy between resonance Raman (RR) and charge-transfer (CT) transitions of Ti3C2Tx displays the potential for the single-molecule (SM) detection of dye molecules. According to the energy level diagram of the molecule–MXene system, the charge-transfer transition from the HOMO of crystal violet (CV) to the Fermi level should be at or close to 1.9 eV. This indicates a considerable charge-transfer intensity contribution to the overall SERS enhancement via RR. Moreover, MXene-based SERS substrates could still be developed for further improvement, and optimization is possible for quantitative SERS using non-resonance Raman reporters. This report shows that thin film MXene is a potential 2D material for biochemical molecular sensing or SERS sensors.
Conflicts of interest
There are no conflicts to declare.Acknowledgements
The authors would like to thank Professor Dr Yury Gogotsi for the pristine MAX phase of Ti3AlC2 and MXene–Ti3C2Tx samples from Drexel University, PA, USA. Also, the authors are grateful to Dr Chia-Ying Su and Mr Bo-Yong Wu for their help with this research project. Dr Satheeshkumar Elumalai acknowledges support from National Cheng Kung University (grant no. HUA 103-3-3-158 under “Aim for Top University Project (ATUP)” as an ATUP Postdoctoral Fellowship), Taiwan.Notes and references
- R. Pilot, R. Signorini, C. Durante, L. Orian, M. Bhamidipati and L. Fabris, Biosensors, 2019, 9, 57 CrossRef CAS PubMed
.
- L. Yang, Y. Peng, Y. Yang, J. Liu, H. Huang, B. Yu, J. Zhao, Y. Lu, Z. Huang, Z. Li and J. R. Lombardi, Adv. Sci., 2019, 6, 1900310 CrossRef PubMed
.
- J. Langer, D. Jimenez de Aberasturi, J. Aizpurua, R. A. Alvarez-Puebla, B. Auguie, J. J. Baumberg, G. C. Bazan, S. E. J. Bell, A. Boisen, A. G. Brolo, J. Choo, D. Cialla-May, V. Deckert, L. Fabris, K. Faulds, F. J. Garcia de Abajo, R. Goodacre, D. Graham, A. J. Haes, C. L. Haynes, C. Huck, T. Itoh, M. Kall, J. Kneipp, N. A. Kotov, H. Kuang, E. C. Le Ru, H. K. Lee, J. F. Li, X. Y. Ling, S. A. Maier, T. Mayerhofer, M. Moskovits, K. Murakoshi, J. M. Nam, S. Nie, Y. Ozaki, I. Pastoriza-Santos, J. Perez-Juste, J. Popp, A. Pucci, S. Reich, B. Ren, G. C. Schatz, T. Shegai, S. Schlucker, L. L. Tay, K. G. Thomas, Z. Q. Tian, R. P. Van Duyne, T. Vo-Dinh, Y. Wang, K. A. Willets, C. Xu, H. Xu, Y. Xu, Y. S. Yamamoto, B. Zhao and L. M. Liz-Marzan, ACS Nano, 2020, 14, 28–117 CrossRef CAS PubMed
.
- D. Graham, R. Goodacre, H. Arnolds, J. F. Masson, G. Schatz, J. Baumberg, D. H. Kim, J. Aizpurua, W. Lum, A. Silvestri, B. de Nijs, Y. Xu, G. Di Martino, M. Natan, S. Schlucker, P. Wuytens, I. Bruzas, C. Kuttner, M. Hardy, R. Chikkaraddy, N. Martin Sabanes, I. Delfino, P. Dawson, S. Gawinkowski, N. Bontempi, S. Mahajan, S. Reich, B. Hourahine, S. Bell, A. Krolikowska, M. Porter, A. Keeler, M. Kamp, A. Fountain, C. Fasolato, F. Giorgis, J. C. Otero, C. Matricardi, R. Van Duyne, J. Lombardi, V. Deckert and L. Velleman, Faraday Discuss., 2017, 205, 173–211 RSC
.
- J. R. Lombardi, Faraday Discuss., 2017, 205, 105–120 RSC
.
- P. K. Kannan, P. Shankar, C. Blackman and C. H. Chung, Adv. Mater., 2019, 31, e1803432 CrossRef PubMed
.
- S. K. Islam, M. Tamargo, R. Moug and J. R. Lombardi, J. Phys. Chem. C, 2013, 117, 23372–23377 CrossRef CAS
.
- J. R. Lombardi and R. L. Birke, J. Phys. Chem. C, 2014, 118, 11120–11130 CrossRef CAS
.
- C. Muehlethaler, C. R. Considine, V. Menon, W.-C. Lin, Y.-H. Lee and J. R. Lombardi, ACS Photonics, 2016, 3, 1164–1169 CrossRef CAS
.
- E. Satheeshkumar, T. Makaryan, A. Melikyan, H. Minassian, Y. Gogotsi and M. Yoshimura, Sci. Rep., 2016, 6, 32049 CrossRef CAS PubMed
.
- A. Sarycheva, T. Makaryan, K. Maleski, E. Satheeshkumar, A. Melikyan, H. Minassian, M. Yoshimura and Y. Gogotsi, J. Phys. Chem. C, 2017, 121, 19983–19988 CrossRef CAS
.
- B. Soundiraraju and B. K. George, ACS Nano, 2017, 11, 8892–8900 CrossRef CAS PubMed
.
- H. Xie, P. Li, J. Shao, H. Huang, Y. Chen, Z. Jiang, P. K. Chu and X. F. Yu, ACS Sens., 2019, 4, 2303–2310 CrossRef CAS PubMed
.
- B. Yang, S. Jin, S. Guo, Y. Park, L. Chen, B. Zhao and Y. M. Jung, ACS Omega, 2019, 4, 20101–20108 CrossRef CAS PubMed
.
- M. Yu, S. Liu, D. Su, S. Jiang, G. Zhang, Y. Qin and M. Y. Li, Nanoscale, 2019, 11, 22230–22236 RSC
.
- H. Kitadai, X. Wang, N. Mao, S. Huang and X. Ling, J. Phys. Chem. Lett., 2019, 10, 3043–3050 CrossRef CAS PubMed
.
- C. Cai, R. Wang, S. Liu, X. Yan, L. Zhang, M. Wang, Q. Tong and T. Jiao, Colloids Surf., A, 2020, 589, 124468 CrossRef
.
- X. Huang, R. Wang, T. Jiao, G. Zou, F. Zhan, J. Yin, L. Zhang, J. Zhou and Q. Peng, ACS Omega, 2019, 4, 1897–1906 CrossRef CAS PubMed
.
- K. Li, T. Jiao, R. Xing, G. Zou, J. Zhou, L. Zhang and Q. Peng, Sci. China Mater., 2018, 61, 728–736 CrossRef CAS
.
- H. Lashgari, M. R. Abolhassani, A. Boochani, S. M. Elahi and J. Khodadadi, Solid State Commun., 2014, 195, 61–69 CrossRef CAS
.
- X. Zhang, Z. Ma, X. Zhao, Q. Tang and Z. Zhou, J. Mater. Chem. A, 2015, 3, 4960–4966 RSC
.
- G. R. Berdiyorov, AIP Adv., 2016, 6, 055105 CrossRef
.
- V. Mauchamp, M. Bugnet, E. P. Bellido, G. A. Botton, P. Moreau, D. Magne, M. Naguib, T. Cabioc'h and M. W. Barsoum, Phys. Rev. B: Condens. Matter Mater. Phys., 2014, 89, 235428 CrossRef
.
- D. Magne, V. Mauchamp, S. Célérier, P. Chartier and T. Cabioc'h, Phys. Rev. B: Condens. Matter Mater. Phys., 2015, 91, 201409(R) CrossRef
.
- Y. Xu, Y. S. Ang, L. Wu and L. K. Ang, Nanomaterials, 2019, 9, 284 CrossRef PubMed
.
- S. E. J. Bell, G. Charron, E. Cortes, J. Kneipp, M. L. de la Chapelle, J. Langer, M. Prochazka, V. Tran and S. Schlucker, Angew. Chem., Int. Ed., 2019, 59(14), 5454–5462, DOI:10.1002/anie.201908154
.
- A. D. Dillon, M. J. Ghidiu, A. L. Krick, J. Griggs, S. J. May, Y. Gogotsi, M. W. Barsoum and A. T. Fafarman, Adv. Funct. Mater., 2016, 26, 4162–4168 CrossRef CAS
.
- Y. Chae, S. J. Kim, S. Y. Cho, J. Choi, K. Maleski, B. J. Lee, H. T. Jung, Y. Gogotsi, Y. Lee and C. W. Ahn, Nanoscale, 2019, 11, 8387–8393 RSC
.
- S. Elumalai, V. Mani, N. Jeromiyas, V. K. Ponnusamy and M. Yoshimura, Microchim. Acta, 2019, 187, 33 CrossRef PubMed
.
- Y. Lee, S. J. Kim, Y.-J. Kim, Y. Lim, Y. Chae, B.-J. Lee, Y.-T. Kim, H. Han, Y. Gogotsi and C. W. Ahn, J. Mater. Chem. A, 2020, 8, 573–581 RSC
.
- A. J. Haes, S. Zou, G. C. Schatz and R. P. Van Duyne, J. Phys. Chem. B, 2004, 108, 109–116 CrossRef CAS
.
- J. Halim, M. R. Lukatskaya, K. M. Cook, J. Lu, C. R. Smith, L. A. Naslund, S. J. May, L. Hultman, Y. Gogotsi, P. Eklund and M. W. Barsoum, Chem. Mater., 2014, 26, 2374–2381 CrossRef CAS PubMed
.
- R. Cheng, T. Hu, M. Hu, C. Li, Y. Liang, Z. Wang, H. Zhang, M. Li, H. Wang, H. Lu, Y. Fu, H. Zhang, Q.-H. Yang and X. Wang, J. Mater. Sci. Technol., 2020, 40, 119–127 CrossRef
.
- M. Osawa and M. Ikeda, J. Phys. Chem., 1991, 95, 9914–9919 CrossRef CAS
.
- C. Lee, C. S. Robertson, A. H. Nguyen, M. Kahraman and S. Wachsmann-Hogiu, Sci. Rep., 2015, 5, 11644 CrossRef CAS PubMed
.
- K. Kneipp, Y. Wang, H. Kneipp, L. T. Perelman, I. Itzkan, R. R. Dasari and M. S. Feld, Phys. Rev. Lett., 1997, 78, 1667–1670 CrossRef CAS
.
- M. V. Cañamares, C. Chenal, R. L. Birke and J. R. Lombardi, J. Phys. Chem. C, 2008, 112, 20295–20300 CrossRef
.
- P. G. Etchegoin and E. C. Le Ru, Phys. Chem. Chem. Phys., 2008, 10, 6079–6089 RSC
.
- L. Angeloni, G. Smulevich and M. P. Marzocchi, J. Raman Spectrosc., 1979, 8, 305–310 CrossRef CAS
.
- J. R. Lombardi and R. L. Birke, J. Phys. Chem. C, 2008, 112, 5605–5617 CrossRef CAS
.
- T. Schultz, N. C. Frey, K. Hantanasirisakul, S. Park, S. J. May, V. B. Shenoy, Y. Gogotsi and N. Koch, Chem. Mater., 2019, 31, 6590–6597 CrossRef CAS
.
Footnotes |
| † Electronic supplementary information (ESI) available. See DOI: 10.1039/d0ma00091d |
| ‡ Present address: Biophotonics and Advanced Microscopies Laboratory, Institute of Biochemistry and Cell Biology-IBBC, National Research Council (CNR), Via Pietro Castellino no. 111, 80131 Napoli, Italy. E-mail: satheesh@ibbc.cnr.it |
| This journal is © The Royal Society of Chemistry 2020 |

