 Open Access Article
Rotational action spectroscopy of trapped molecular ions
Oskar
Asvany
 * and
Stephan
Schlemmer

I. Physikalisches Institut, Universität zu Köln, Zülpicher Str. 77, 50937 Köln, Germany. E-mail: asvany@ph1.uni-koeln.de
First published on 10th November 2021
Abstract
Rotational action spectroscopy is an experimental method in which rotational spectra of molecules, typically in the microwave to sub-mm-wave domain of the electromagnetic spectrum (∼1–1000 GHz), are recorded by action spectroscopy. Action spectroscopy means that the spectrum is recorded not by detecting the absorption of light by the molecules, but by the action of the light on the molecules, e.g., photon-induced dissociation of a chemical bond, a photon-triggered reaction, or photodetachment of an electron. Typically, such experiments are performed on molecular ions, which can be well controlled and mass-selected by guiding and storage techniques. Though coming with many advantages, the application of action schemes to rotational spectroscopy was hampered for a long time by the small energy content of a corresponding photon. Therefore, the first rotational action spectroscopic methods emerged only about one decade ago. Today, there exists a toolbox full of different rotational action spectroscopic schemes which are summarized in this review.
Stephan Schlemmer obtained his PhD in Göttingen 1991, and after working as PostDoc in Berkeley, he finished his Habilitation 2001 in Chemnitz. He heads the spectroscopy group at the I. Physikalisches Institut at the Universität zu Köln. His research interests are molecular physics and spectroscopy, in particular floppy molecular systems. |
1 Introduction
Among the different spectroscopy regimes, rotational spectroscopy takes a prominent role, as it permits an unperturbed determination of the molecular structure, has high sensitivity, and because it probes the lowest molecular quantum levels, typically in the microwave to sub-mm-wave domain of the electromagnetic spectrum (∼1–1000 GHz). Because of the latter fact, molecules in cold interstellar clouds can be detected in emission with high sensitivity, without the need for bright background sources. Since the first radio astronomical detection of a molecule in space, the Λ-type doublet of OH at 1.6 GHz, in 1963,1 microwave and later (sub)mm-wave spectroscopic techniques thus dominated the astronomical detection of molecules, of which more than 220 are now known to exist in the interstellar medium or circumstellar shells.2,3 Closely connected with these developments are also the laboratory rotational spectroscopy techniques, examples being the standard absorption cell, the Fourier-transform microwave (FT-MW) method developed by Balle and Flygare in the 1980s,4 and, more recently, the chirped pulse Fourier-transform technique (CP-FT, ref. 5).Another important subset of spectroscopy concerns the spectroscopy of molecular ions, and a huge body of rotational work has already been accumulated by the techniques mentioned above, see e.g. ref. 6–18. Ions take a prominent role in astrochemistry,19–22 as they are formed readily in space by ionizing radiation and cosmic rays, and because they can substantially influence interstellar chemistry by fast ion–molecule reactions at temperatures as low as 10 K. This efficiency can be traced back to the high collision rate due to the attraction between a charge and an induced dipole, and because of the typically low energy barriers of such reactions. Traditionally, ions are generated igniting a discharge of a suitable neutral precursor gas mixture in a cooled absorption cell or at the nozzle tip of a pulsed supersonic expansion. Unfortunately, the discharge produces a variety of different species (ions, excited neutrals, radicals), which is particularly severe for hydrocarbon molecules, and the missing selection between them poses a severe problem. A famous example for this difficulty is Takeshi Oka's quest for the IR spectrum of CH5+,23 the ‘enfant terrible’ of molecular spectroscopy,24 using a discharge through a CH4–H2–He mixture, for which he needed decades to distinguish the spectroscopic signals of the ions CH5+, CH4+, CH3+, etc. and even of excited methane,  .
.
The problem named above can be avoided by using ion trap setups. These offer the advantage of cryogenic cooling and mass selection, leading to simple and uncontaminated spectra. In addition, the stored ions can be exposed to the radiation field for rather long times, and, therefore, very high spectral resolution can be achieved in principle. The limited number of trapped ions (in the range 103 to 106), though, makes the application of some sort of action spectroscopy mandatory. In this approach the action of the photons on the trapped ionic molecules is detected by subsequent mass selection and counting of parent or product/fragment ions. As counting of the ions has very high efficiency, action spectroscopy is furthermore very sensitive. In the realm of IR laser spectroscopy of molecular ions, action schemes have been routinely applied since the 1980s for vibrational or even electronic investigations with methods like predissociation spectroscopy,25–28 infrared multiphoton dissociation (IRMPD),29–31 or the messenger (tagging) technique.32–36 Later, the toolbox of IR action spectroscopy was enriched with methods like laser induced reactions (LIR),37–40 and laser induced inhibition of complex growth (LIICG),41–44 which are presented in more detail in the following sections.
In view of the above-mentioned importance of mm-wave and submm-wave (THz) spectroscopy to astronomy, it was desirable to transfer the advantages of action spectroscopy to rotational spectroscopy of molecular ions. However, the inherent low photon energy has hampered the development of such rotational methods for a long time. The first demonstration of pure rotational spectroscopy in a cold ion trap was a direct LIR process such as H2D+ + H2 + hν → H3+ + HD, by which the fundamental transitions 101 ← 000 and 111 ← 000 of p-H2D+ and o-D2H+, respectively, could be recorded in the THz regime.45 But this first laboratory demonstration was only possible due to fortuitous chemical and physical circumstances, namely the large rotational spacing of the light ions H2D+ and D2H+, and also due to the existence of a reaction with a low energy barrier (which had to be surmounted by the photon energy). Such a scheme is thus unique and cannot be transferred to other molecular ions in a direct manner. Thus, other, more general rotational action schemes had to be devised.
This work presents a review of novel rotational action spectroscopic methods developed in the last decade. The requirements on the cryogenic trap machines and optics is briefly summarized in Section 2, and some background on vibrational and electronic action spectroscopy is given in Section 3. The developed rotational action schemes are summarized and discussed in detail in Section 4, with an emphasis on the double-resonance techniques developed in Cologne. A particularly exciting recent development is the high-precision rotational spectroscopy of sympathetically cooled ions. Due to its different technical character, it is treated separately in Section 5. An outlook is given in Section 6.
2 Experimental prerequisites
The general principles of an action spectroscopy experiment are explained with the help of Fig. 1. Typically, such a setup consists of an ion source, a first mass filter (which could be a quadrupole or a time-of-flight mass analyzer), the ion trap, followed again by a second mass filter and finally the ion detector. Several such cryogenic trap machines have been described in the literature in detail,35,42,46–53 as well as the central part, typically a multipolar cryogenic ion trap.54–56 The experiments are conducted in a pulsed mode. The pulse of ions generated in the ion source is mass filtered for the ionic species to be investigated in the first filter and then injected into the ion trap. Here the ions can be stored and cooled. The cooling of the translational and internal degrees of freedom usually happens by inelastic collisions with a cold buffer gas, mostly by (a pulse of) helium. In the trap, the ions are excited by narrow-bandwidth and tunable radiation ((sub)mm-wave, IR, vis/UV). For the double-resonance rotational experiments described in Section 4, the (sub)mm-wave and IR beams have to be combined and applied at the same time. For action spectroscopy to work, this excitation has to change the mass composition of the trapped ion ensemble, be it by promoting or hindering a bimolecular reaction, or by simply dissociating or neutralizing the molecular ions. This change of mass composition can be monitored by releasing the total trap content into the second mass filter and counting the mass-filtered ionic reaction products (or fragments) in the detector.For rotational action spectroscopy, one has to adapt such a machine to the applied long wavelength radiation. As radiation at 30 GHz, for instance, has a wavelength of 1 cm, it is getting increasingly cumbersome to refocus the divergent invisible beam through long distances along the axis of the machine, particularly through small orifices. A practical approach is therefore to have a bent machine setup, with a quadrupole ion bender inserted between the first mass filter and the trap (such a bender is not shown in Fig. 1), such to allow for a close proximity of the microwave/mm-wave source to the trap. An alternative possibility is an ion trap with a lateral irradiation window as recently designed by the Innsbruck group.56
Another aspect concerns the vacuum window material for the long wavelength radiation. The most important criteria for this choice are the ultrahigh vacuum compatibility and transparency for the microwave to submillimeter wave region (10–1500 GHz). Apart from this region, double resonance experiments require transparency also in the IR, and future double resonance with electronic excitation potentially even need transparency in the visible and UV regions. Typical window and optical materials used in the mm-wave community, like high density polyethylene (HDPE), polytetrafluorethylene (PTFE), polymethylpentene (TPX) or Teflon do not fulfill the latter requirements. In addition, they exhibit bad vacuum performance, be it because of permeability of air and moisture or because of severe outgassing due to porousness. Window materials suitable for the application here are either z-cut quartz or chemical vapour deposition (CVD) diamond. In particular CVD-diamond, though expensive and with a high refractive index (n ≈ 2.38), is transparent from the near UV to far into the microwave region and is a very robust material.
3 Action spectroscopy
3.1 Why action spectroscopy?
In contrast to conventional absorption spectroscopy, where one detects what the molecules do to the light, in action spectroscopy one detects what the light is doing to the molecules in case of absorption. This action spectroscopy is best done with ions, as their charge offers a firm handle to control, i.e. guide, mass select, trap, and finally count them. As this counting can be done with an efficiency close to unity (e.g. with a Daly detector57), action spectroscopy is very sensitive (while counting of photons close to the quantum limit can be achieved only in exceptional cases). For example, action spectroscopy can operate with a few hundred stored ions (see e.g. the ordinate of Fig. 8) in a trap volume of about 3 cm3 (see e.g. ref. 55) and thus an ion density on the order of 100 cm−3, whereas typical absorption experiments require a minimum number density of the investigated species on the order of 108 cm−3. Other advantages of action spectroscopy are (i) the mass selection, which is often done with compact quadrupole mass selectors, (ii) the cooling capability in cryogenic ion traps, leading to narrow Doppler widths and favorable partition functions (important for complex and floppy molecules), (iii) long interaction times (typically up to several seconds), and finally (iv) the consumption of only tiny amounts of the precursor sample. The latter feature is especially important when one makes experiments with expensive (e.g. isotopically substituted), poisonous or explosive precursors.Action spectroscopic methods have been applied since the 1980s, mainly for rovibrational and electronic spectroscopy of ionic molecules and complexes. Because rotational action spectroscopy is based on these developments, they are briefly reviewed here, with a focus on the methods LIR and LIICG.
3.2 Early days of action spectroscopy
One of the first experiments in which ion detection is used to record spectra of molecular ions is the Doppler-tuned fast-ion-beam laser spectrometer constructed by Wing and coworkers in the 1970s in Tucson, Arizona. It is depicted in Fig. 2. It uses the acceleration of an ion beam (several kV) to Doppler-tune transitions of the molecular ions through a fixed-frequency (but otherwise stepwise tunable) high-power CO-laser. The ions are mass-analyzed, and the excitation of the molecular ions is detected via their different interaction behavior (neutralization, dissociation, scattering) in a gas target and subsequent recording of the ion current in a Faraday cup (see Fig. 2). Many fundamental molecular ions have been measured in the IR for the first time with this setup, as HD+,58 HeH+,59 D3+![[thin space (1/6-em)]](https://www.rsc.org/images/entities/char_2009.gif) 60 and H2D+.61 Although pioneering, the disadvantages of this method are that ions are not cooled and thus produced with internal excitation, the short interaction times, and the insensitivity of the detection method. Also, the ions are not counted, but a tiny current measured.
60 and H2D+.61 Although pioneering, the disadvantages of this method are that ions are not cooled and thus produced with internal excitation, the short interaction times, and the insensitivity of the detection method. Also, the ions are not counted, but a tiny current measured.
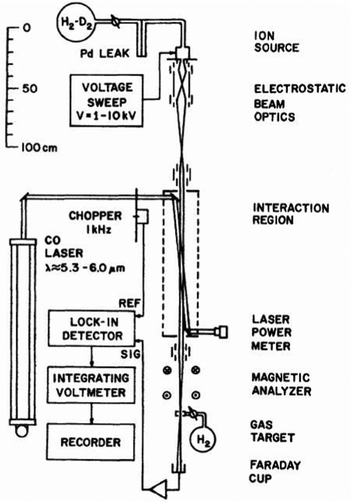 | ||
| Fig. 2 Doppler-tuned fast-ion-beam laser spectrometer by Wing and coworkers. Reprinted from ref. 58 with permission of APS. | ||
3.3 Infrared photodissociation – IRPD
A more advanced method has been developed by Y. T. Lee and collaborators in Berkeley. They used a supersonic expansion source (corona discharge source) to produce cold ionic cores solvated in loosely bound neutral species, such as e.g. CH5+(H2)n. These were first mass selected and then stored shortly in a room-temperature ion trap. There, the ions were excited by IR photons into a resonant vibrational state above the lowest dissociation limit, and the subsequent dissociation has been detected by a second mass spectrometer and a Daly-detector. A nonzero lifetime of these resonant states leads to fairly resolvable (ro)vibrational lines and the obtained spectral pattern thus permits to determine the molecular structure. With this ‘vibrational predissociation’ method, they investigated weakly bound ionic complexes such as H+(H2O)n, CH5+(H2)n or H3+(H2)n.25,26,62–64 In the so-called messenger (or tagging) variant of this approach, a weakly bound rare gas atom is attached to a stable ion under investigation.32,33,65–68 Dissociation with one photon leaves the ion core intact and only leads to the loss of the weakly bound tag. In the limit of large cations and very weakly interacting tags (e.g. He, D0 < 1 kJ mol−1 = 83.6 cm−1), only a minor perturbation is imposed on the structure and spectrum of the core ion, rendering this approach a valuable tool when other vibrational action spectroscopic methods are not available.32,33,35,65,69 Instead of using a one-photon process to destroy a tagged ion, a complementary approach is to use infrared multi-photon dissociation (IRMPD) of the naked ion (without tag) in a short intense laser pulse.29,30,703.4 Laser induced reactions – LIR
The action spectroscopic method of Laser Induced Reaction (LIR) has been pioneered by Schlemmer and Gerlich end of the 1990s in Chemnitz. As the name suggests, laser excitation of a trapped molecular ion ensemble enhances the reactivity with a suitable neutral reaction partner, which is added as a gas to the cold ion trap. The spectroscopic signal is then obtained by counting the laser induced product ions as a function of the laser frequency. LIR was first demonstrated with the endothermic (0.18 eV = 1452 cm−1) charge transfer reaction N2+ + Ar → Ar+ + N2.37 The capability to record (a part of) the known Meinl band spectrum (A2Πu ← X2Σg) of N2+ at low temperature was not the only success of this approach, but, due to the bimolecular collision involved in the detection processes, also state-specific kinetic parameters have been determined. By following the trapped products and reactants in time, and by varying parameters such as the Ar number density or the laser irradiation time, based on a detailed rate equation system, the rotational relaxation rate coefficient in the ground state of o-N2+ (F1 component) has been determined, as well as the reaction rate coefficient for vibrationally excited N2+(v′′ > 0) + Ar.37As LIR forms the basis for the rotational action methods described in Sections 4.1 and 4.2, it is explained here in some detail with the example of the hydrogen abstraction reaction38
| C2H2+ + H2 → C2H3+ + H −50 meV |
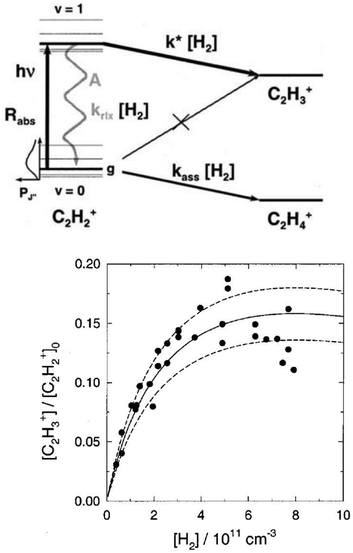 | ||
| Fig. 3 (top) Level scheme for the LIR-process of C2H2+ showing all radiative and collisional rates. (bottom) LIR-signal for the P(9) transition as a function of the H2 number density, including three different solutions of the rate equation system.38 Figures reprinted from ref. 38 with permission of AIP Publishing. | ||
3.5 Laser induced inhibition of He attachment – LIICG
One obvious limitation of the LIR method lies in the need for an endothermic chemical reaction with a neutral reaction partner. This reaction partner should not condense at the low temperatures of the cryogenic trap. Therefore, H2 is often used, allowing for low-temperature experiments down to about 10 K. These requirements restrict the application of LIR to selected cases.An alternative and generally applicable action technique, Laser Induced Inhibition of Complex Growth (LIICG), emerged with the advent of ion traps cooled to 4 K, and exploits the fact that excitation of a stored cation can inhibit ternary He-attachment in a cryogenic He-bath. This method was pioneered by Maier and Gerlich in Basel,41 using rovibronic excitation of N2+ (A2Πu ← X2Σg, the same band that was used for the first demonstration of LIR) to hinder the formation of N2+–He at a nominal trap temperature of 5 K. A short time later, the application of this scheme to rovibrational excitation has been demonstrated with the example of CH5+, as shown in Fig. 4, enabling to decipher this enigmatic molecule for the first time.40,42 For a typical C-H stretching mode as shown in Fig. 4, the internal energy of the naked cation is increased by about E/hc ≈ 3000 cm−1, which is much higher than the helium binding which is typically less than 1 kJ mol−1 (≃83.6 cm−1).35,73,74 This makes the lifetime of a complex formed by the excited CH5+ and He extremely short, so that no collisional stabilization can happen in a ternary collision at the typical He number densities ([He] = 1015 cm−3). This leads to a decrease, a dip, of the formed CH5+–He complexes upon resonant excitation of CH5+, as seen in Fig. 4. As the only broadening mechanism at work here is the Doppler effect, this dip has the form of a narrow Gaussian.
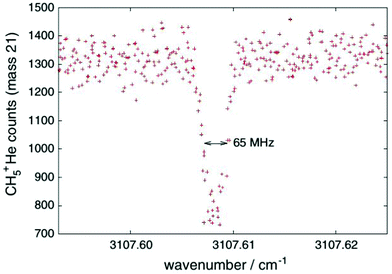 | ||
| Fig. 4 First vibrational LIICG-signal, demonstrated for the floppy CH5+ ion.42 Reprinted with permission of Springer Nature. | ||
The vibrational LIICG method has been successfully applied to many molecular ions.43,44,75–79 Typically, this method needs a high-resolution cw IR source for effectively shifting the equilibrium between tagged and untagged species (for this equilibrium, see also Section 4.5). Experience shows that pulsed IR lasers do not yield an effective vibrational LIICG signal. For pulsed radiation sources, the induced shift of ion composition in the trap is canceled within a very short time by the competing collisions with He. With the He density as given above and assuming a Langevin collision rate coefficient kL = 10−9 cm3 s−1 and a ternary rate coefficient of k3 = 10−28 cm6 s−1, the rate of collisions with He is thus 106 s−1 and the complexes will be formed with a rate 102 s−1. The time scale of complex formation is thus on the order 10 ms (for this specific example), which is shorter than the time between laser pulses, which is 100 ms for a typical 10 Hz laser system. Unless the ion detection is synchronized to happen just after the laser pulse, or using a laser with a higher repetition rate, the effect of the laser excitation will be small.
Very interestingly, rotational excitation, though involving photons carrying very little energy (on the order of only E/hc ≈ 10 cm−1), is also able to influence the ternary rate coefficient for He attachment.80 The exploitation of this effect for high-resolution rotational spectra of molecular cations is discussed in Section 4.5. A first double resonance experiment using rotational excitation followed by vibrational LIICG is presented in Section 4.6.
4 Rotational action spectroscopy
While action spectroscopic techniques for trapped ions and ionic clusters have been available in the vibrational and electronic domain since the 1980s, first rotational action spectroscopic techniques emerged only one decade ago. This section gives an overview of the different techniques, lists their scope of application (e.g. cation or anion, strongly or weakly bound systems), and compares their experimental parameters.4.1 Rotational LIR
For the direct rotational spectroscopy of a molecular ion using laser induced reaction (LIR) a molecule with large rotational quantum level spacings had to be chosen. Ideal candidates were H2D+ and D2H+ as they fulfill this requirement, have a permanent dipole moment, and their fundamental rotational transitions were well bracketed by previous predictions and experiments. Para-H2D+, for instance, was known to have its fundamental rotational transition 101 ← 000 at 1.37 THz81,82 corresponding to 45.7 cm−1 (or 65.75 K or 218.813 μm). In addition, the proton exchange reactions necessary for performing LIR,| H2D+ + H2 → H3+ + HD −232 K | (R1) |
| D2H+ + H2 → H2D+ + HD −187 K | (R2) |
| → H3+ + D2 −340 K | (R3) |
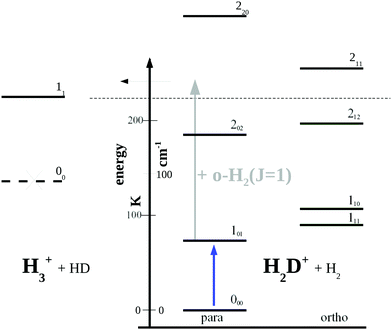 | ||
| Fig. 5 Rotational levels involved in the low-temperature reaction H2D+ + H2 → H3+ + HD (reaction (R1)). The lowest level of H3+ is 11 as the level 00 is forbidden by Pauli exclusion. The given endothermicity (thin dashed line at 232 K) is the difference between the lowest rotational levels of the reactant H2D+ (000) and product H3+ (11). The energy scale is given in K as well as cm−1 (1 cm−1 ≈ 1.4388 K). A similar Figure can be found in ref. 83. | ||
Looking at Fig. 5, one might wonder how the rotational action spectroscopy via LIR works for H2D+ (and D2H+), as the energy of the THz-photon is only a fraction of the energy barrier. The energy barrier for the reaction H2D+ + H2 is estimated to be about 232 K (thin dashed line in the Figure), while the 101 ← 000 THz-photon contributes only 65.75 K additional energy to the reaction system (blue vertical arrow), leaving a deficit of about 166 K. Also the kinetic energy of the reaction partners is negligible at the low-temperature condition of the ion trap (on the order of 3/2kT ≈ 23 K). So a very important energy contribution in reaction (R1) stems from o-H2 contained in the hydrogen reaction partner. o-H2 is exclusively in the rotational state J = 1 at low trap temperature and thus carries an energy content of 170.476 K (grey arrow in Fig. 5), which finally drives the reaction to the detected product H3+.
First test experiments along these lines were conducted at the FELIX facility (Free Electron Laser for Infrared eXperiments84), in Neuwegein, the Netherlands (now moved to Nijmegen). This source is capable to produce pulsed THz-radiation with its long-wavelength FELIX I undulator (range 67–330 cm−1). Previous experiments with FELIX II (range 230–3300 cm−1) in 2005 showed successfully83 that reaction (R1) can be induced with the excitation of the ν2 and ν3 vibrational bands of H2D+ with origins at 2335.45 and 2335.45 cm−1,85 respectively. For the rotational test experiments, conducted in 2006, the same trap setup was used, with an HDPE window for admitting the radiation. The experiments were performed with n-H2 at a nominal temperature of about 15 K. As H2D+ has its dipole moment along its a-axis, it exhibits a-type transitions with selection rules ΔKa = 0 (±2,…) and ΔKc = ±1 (±3, …). The transitions 212 ← 111 at 78.829 cm−1 (=126.856 μm),86 202 ← 101 at 85.951 cm−1 (=116.345 μm),87 211 ← 110 at 103.483 cm−1 (=96.635 μm)87 and 220 ← 101 at 178.155 cm−1 (=56.131 μm)2 (see Fig. 5 for quantum levels) were probed, whereas the fundamental transition at 45.7 cm−1 (blue arrow in Fig. 5) was below the range accessible by FELIX I. No conclusive signals could be detected for these transitions. The non-detection was probably caused by the combination of several reasons, the most important ones being the pulsed structure and limited resolution of the FELIX light source, the use of n-H2 in the experiment (leading to a high background count of H3+ ions), as well as the non-optimal partitioning of the probed quantum levels at a nominal trap temperature of 15 K.
For these reasons, the rotational spectroscopy of H2D+ (and D2H+) has been later continued in the Cologne laboratories with the same trap machine, but using a high-resolution multiplier chain as THz-source, and a vacuum-proof optical CVD diamond window. The setup is shown in Fig. 6.45 The multiplier chain, consisting of a doubler, an intermediate amplifier, a quadrupler, and two triplers, giving a total frequency multiplication factor of 72, operated in the range 1.25 to 1.53 THz with a frequency-dependent output power varying between 1 and 3 μW. It was estimated that a maximum of about 0.5 μW is reaching the trap which is in 0.6 m distance to the diamond vacuum window. Because of this distance a careful and tedious adjustment of the THz-setup on an optical test bench was mandatory. The experience with these first rotational measurements lead finally to the novel ion trap machine designs developed in Cologne.42,52 Also, a hydrogen sample highly enriched in p-H2, produced in an external catalytic p-H2-generator, has been used in the experiment. With this hydrogen sample, the lower rotational energy content of H2 (J= 0 for p-H2 at low temperature) leads to fewer H3+ background counts, and the p-H2D+ under investigation is enriched by collisions with p-H2 in the ion trap. With these prerequisites, the fundamental transitions of p-H2D+ and o-D2H+ could be detected unambiguously for the first time, see Fig. 7 (left). A fit with Doppler profiles yielded line center frequencies of 1370084.880(20) MHz for the 101 ← 000p-H2D+ transition and 1476605.708(15) MHz for the 111 ← 000o-D2H+ transition, and thus a relative precision of Δν/ν = 10−8. With these solid laboratory data, these transitions have also been detected in space a few years later,88,89 using the airborne far-infrared observatory SOFIA (Fig. 7 right). Of particular interest in these detections was the first determination of the ortho-to-para (o/p) ratio of H2D+ and D2H+ towards the observed cold protostellar core. Due to the dependence of these o/p-ratios on the o/p-ratio of the abundant H2 and its thermal history, these ratios are an important indicator of the age of such a region undergoing star-formation.
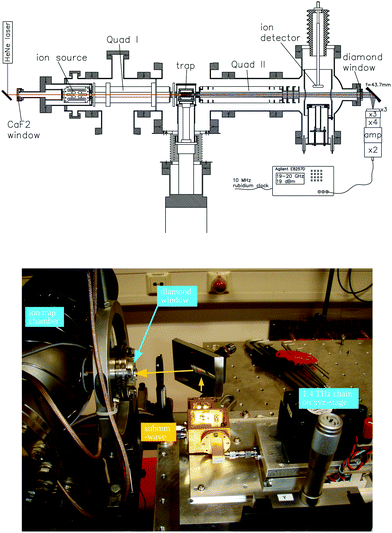 | ||
| Fig. 6 (Upper scheme) Experimental setup for rotational action spectroscopy of H2D+ and D2H+, consisting of the ion trapping machine and the THz source. (bottom photo) The unit consisting of THz source and ellipsoidal mirror is placed on a common support (simple bread board), which has been moved between the trapping machine and a test setup on a nearby optical bench for adjustment and power calibration. The scheme is reprinted from ref. 45 with permission of APS. | ||
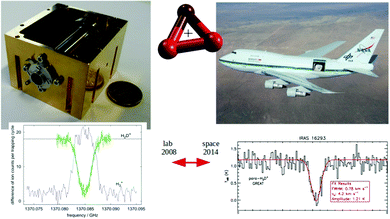 | ||
Fig. 7 (Left) Action spectrum of the H2D+ rotational transition 101 ← 000 (blue arrow in Fig. 5), observed as a decrease of the H2D+ parent species and a simultaneous increase of the H3+ product ion counts when the excitation frequency is in resonance.45 (right) Detection of this transition towards IRAS 16![[thin space (1/6-em)]](https://www.rsc.org/images/entities/char_2009.gif) 293 with the airborne far-infrared observatory SOFIA.88 293 with the airborne far-infrared observatory SOFIA.88 | ||
4.2 Rotational–vibrational double resonance via LIR
The THz-measurements of p-H2D+ and o-D2H+ described in the preceding section are the first pure rotational lines detected by action spectroscopy. Despite this success it has again to be emphasized that only accidentally advantageous molecular parameters made the experiment feasible: (i) low-temperature endothermic reactions schemes (R1–R3) exist for H2D+ and D2H+ and (ii) the energy barriers which have to be surmounted in these reactions are relatively low due to the proton exchange character. Typically, other reactions have transition states with much higher barriers. (iii) H2D+ and D2H+ are molecules with large rotational spacings lying in the THz-range. Therefore the excitation of these transitions by THz-photons increases the energy available for the reaction considerably, enabling action spectroscopy to enhance the named reactions. (iv) The THz-beam with its short wavelength can be easily guided from the submm-wave source through the small-diameter diamond window to the 0.6 m distant ion trap (see Fig. 6 top). Guiding a mm-wave beam (∼100 GHz) through the same setup will be considerably more difficult.For the above reasons, a generalization of this rotational action spectroscopic method to other molecular systems is not possible. For instance, a similar scheme for the heavier ion CH2D+ involves a reaction endothermicity of 370 K,90,91 but the fundamental rotational transition 101 ← 000 of p-CH2D+ has a small energy difference, corresponding to 278691.7708(9) MHz,92 or 13.375 K only. Alternatively, transitions of CH2D+ in the THz domain correspond to higher-lying rotational levels (e.g. 524 ← 423 at 1.341 THz) which are hard to populate at reasonably low temperatures. Early single photon experiments with CH2D+ along these lines in 2009 thus failed. Therefore, other action schemes had to be devised. Double-resonance experiments including ro-vibrational or even ro-vibronic transitions have been suggested as a solution to this problem already in the original LIR publication.45 Such double-resonance schemes have been known to be a powerful tool in the form of IR-UV double resonance to obtain vibrational spectra of cold neutral93 as well as ionic molecules94via the vibronic excitation as the detection tool.
The rotational–vibrational double resonance method is explained in the upper parts of Fig. 8 for the familiar example of H2D+. In these schemes, it is assumed that the temperature is lower than the typical energy difference between the rotational levels, kT < ΔE, so that the higher levels are much less populated than the lower levels (doing the simplifying assumption of thermal equilibrium, e.g., at 20 K the 000 level contains 77.6% of all stored H2D+ ions and the 101 level only 8.9%). Furthermore, IR and (sub)mm-wave radiation is applied simultaneously to the ions. The frequency of the IR photon (red) is kept fixed on a rovibrational transition starting from a rotational level of the vibrational ground state. In combination with H2-collisions, this results in a detectable and constant LIR signal. The sub(mm)-wave photon (blue) then excites a rotational transition starting or ending on the rotational quantum state probed by the IR laser, as depicted on the left and right upper schemes of Fig. 8, respectively. These two combinations thus decrease or increase the LIR signal. Rotational lines can therefore be recorded by scanning the frequency of the (sub)mm-wave source as shown by the examples in the lower parts of Fig. 8.
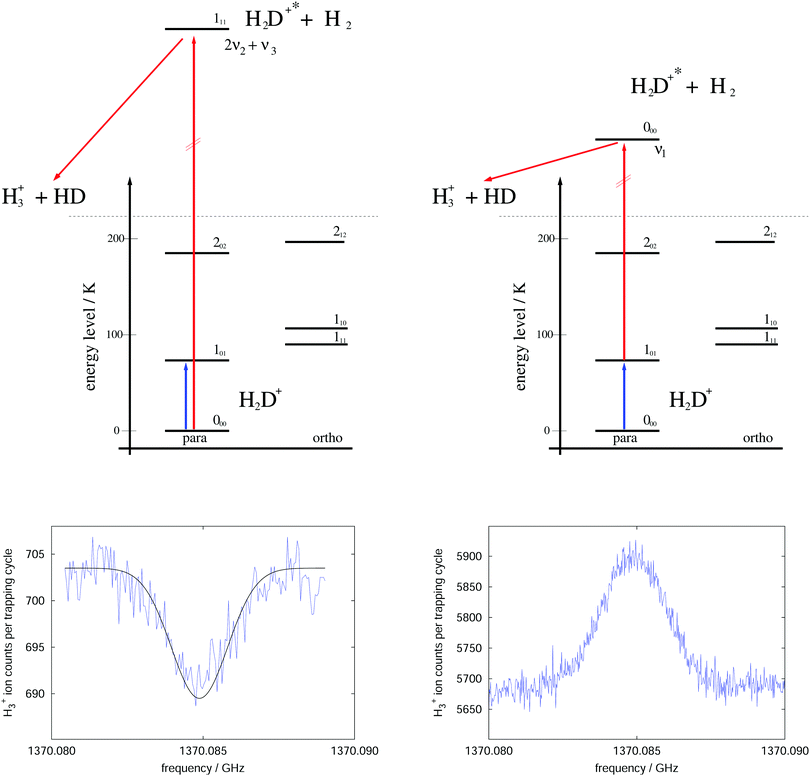 | ||
| Fig. 8 Rotational–rovibrational double resonance schemes (upper part) and corresponding measurements (lower part), demonstrated on the transition 101 ← 000 (blue arrow) of H2D+. The left side shows the first demonstration of such a scheme in 2010 (published as Fig. 8 in ref. 95), measured at a nominal trap temperature of 15 K. The rotational excitation creates a dip in the LIR signal which has been generated by excitation (red arrow) into the overtone band (0,2,1). The right side uses the scheme that enhances the LIR signal. The shown curve is the average of four measurements performed at 8 K. The LIR signal has been generated by excitation (red arrow) into the fundamental band (1,0,0).96 | ||
For the first such rotational–vibrational double resonance experiment95 the same transition 101 ← 000 of H2D+ has been chosen again as a test case, because all involved transitions had been well characterized previously. In particular, the 111 ← 000 IR transition into the overtone band (v1,v2,v3) = (0,2,1) at 6466.532 cm−1![[thin space (1/6-em)]](https://www.rsc.org/images/entities/char_2009.gif) 97 has been chosen as the rovibrational excitation, driven by a commercially available diode laser (Agilent 8164A diode laser controller with laser module 81642A). The setup was identical with the one shown in Fig. 6, with the diode laser replacing the shown HeNe-laser. The level scheme and the original measurement of this first demonstration are shown in the left part of Fig. 8. A fit to this measured dip with a Gaussian profile yielded a center frequency of 1370084.861(40) MHz and thus a value in very good agreement with the original result shown in Fig. 7. Such control measurements are useful to check that the low-temperature ion trap approach is free of frequency shifts induced by ion motion, as sometimes observed in discharge tube experiments. On the right side of Fig. 8, in contrast, the very same rotational transition has been measured, but using the proposed enhancement scheme. The LIR signal has been detected with a cw IR OPO (Aculight Argos Model 2400) exciting the 000 ← 101 transition into the fundamental vibrational band (v1,v2,v3) = (1,0,0) at 2946.8011 cm−1.75,97,98 The measurement has been done in a new-generation ion trap machine with bent structure.42 Six of such measurements at a temperature of 8 K could improve the uncertainty of this astronomically important transition by a factor of two, leading to the value 1370084.899(12) MHz.96
97 has been chosen as the rovibrational excitation, driven by a commercially available diode laser (Agilent 8164A diode laser controller with laser module 81642A). The setup was identical with the one shown in Fig. 6, with the diode laser replacing the shown HeNe-laser. The level scheme and the original measurement of this first demonstration are shown in the left part of Fig. 8. A fit to this measured dip with a Gaussian profile yielded a center frequency of 1370084.861(40) MHz and thus a value in very good agreement with the original result shown in Fig. 7. Such control measurements are useful to check that the low-temperature ion trap approach is free of frequency shifts induced by ion motion, as sometimes observed in discharge tube experiments. On the right side of Fig. 8, in contrast, the very same rotational transition has been measured, but using the proposed enhancement scheme. The LIR signal has been detected with a cw IR OPO (Aculight Argos Model 2400) exciting the 000 ← 101 transition into the fundamental vibrational band (v1,v2,v3) = (1,0,0) at 2946.8011 cm−1.75,97,98 The measurement has been done in a new-generation ion trap machine with bent structure.42 Six of such measurements at a temperature of 8 K could improve the uncertainty of this astronomically important transition by a factor of two, leading to the value 1370084.899(12) MHz.96
A prerequisite for the application of such a double resonance scheme is a thorough knowledge of the ro-vibrational (or even ro-vibronic) spectroscopy of the molecule under investigation. It has to be pointed out that in contrast to the IR-UV double resonance schemes93,94 mentioned above, a continuous scanning of the spectrum of interest (i.e. the rotational spectrum in our case) is not feasible, but for every single rotational line a new pair of rotational and rovibrational transitions has to be adjusted in the experiment. As a reward for this additional complication one obtains an inherent verification of the assignments of all pairs of ro-vibrational and rotational transitions. This check may be of advantage for exotic molecules for which the assignment of rotational quantum states needs confirmation (see the example of CH3+–He in Section 4.3). An additional advantage of the double-resonance method is that all low-lying transitions can be accessed with good signal-to-noise ratio (which, in favourable cases can reach values of ∼10 for a single measurement), so that a complete network of transitions is obtained, which allows for the accurate determination of all molecular parameters, and thus accurate predictions of unmeasured higher-lying transitions in the THz regime. This has been extensively exploited for deuterated cations of astrophysical interest (see examples below). In principle, both schemes presented in Fig. 8, with the two transitions in competing order (left scheme) or with the two transitions in successive order (right scheme), can be used for double resonance spectroscopy. For measuring the fundamental transitions, one cools the trap to the lowest possible temperature (typically 8 K for reactions involving H2), leading to a high population in the 000 state and lower population in the 101 level. Both schemes work in this regime with good signal-to-noise ratio, and the resulting narrow Doppler widths allow to determine the line centers with a precision approaching Δν/ν = 10−9. For higher-lying transitions, one has to heat up the trap slightly (20 to 40 K) to obtain sufficient population of the probed levels. In these cases the left scheme may be preferable, as the rovibrational transition probes a lower rotational level (which has higher population) and thus a more stable LIR signal may be established.
The rotational–vibrational double-resonance scheme has been applied to many fundamental molecular ions with a permanent dipole moment, for which a suitable LIR reaction scheme is available. As mentioned above, the very high sensitivity of this scheme typically allows to detect all rotational transitions, also weak ones, covered by the (sub)mm-wave sources. For instance, the fundamental transition J = 1 ← 0 of the anion OH− has been measured via the endothermic reaction OH− + H2 → H− + H2O, yielding a frequency value of 1123101.0410(14) MHz,99 and improving the former value measured by Matsushima an coworkers100 more than hundred times. Also, deuterated species have been extensively investigated via their endothermic proton exchange reactions. These include the species H2D+ and D2H+,95,96 CH2D+ and CD2H+,76,92 and HCCD+ (whose analysis is ongoing). These ions are all known or suspected to promote the deuteration of other molecules in cold interstellar clouds, and the double resonance measurements help in their search. The highly accurate value for the 111 ← 000 transition of o-D2H+ at 1476605.7125(47) MHz,96 for instance, supported the detection of o-D2H+ in the protostellar binary IRAS 16293-2422 in Ophiuchus with the GREAT receiver onboard SOFIA.89 In a similar way, a complete network of 21 rotational transitions for CH2D+ up to 1.1 THz measured by Töpfer et al.92 enables the radio-astronomical search of this ion in interstellar space. Its detection seems currently very difficult because of the low predicted abundances, so that future observations require deep integration. Also, a complete set of 25 rotational transitions has been measured for the CD2H+ cation. While this doubly deuterated ion is extremely hard to detect in interstellar space, the interest for its transition frequencies stems from molecular physics, as this ion exhibits perturbations in its vibrational bands.71,76,101 Therefore, a thorough characterization of its unperturbed ground vibrational state is desirable. Fig. 9 shows a summary of rotational quantum levels of CD2H+ and the 25 rotational transitions measured by Jusko et al.76 (blue arrows). The application of the double-resonance technique allowed for a complete coverage of all transitions below 1.1 THz, even weak ones with ΔKc = 3 of this asymmetric rotor. With this complete coverage, by forming sums and differences of the measured rotational lines, 43 combination differences within the vibrational ground state could be generated. These combination differences can be used to check the internal consistency of the rotational as well as IR data. For the rotational data, 12 ground state combination differences can be formed in two different ways, and the values of these corroborate the tight accuracies. Also, the 43 combination differences obtained by the rotational measurements can be compared to the ground state combination differences obtained by the highly accurate frequency comb measured IR data of that work.76 For example, the difference of the levels 414 and 312 (see vertical red arrow in Fig. 9) could be formed in two different ways by the rotational data (one difference and one sum, see blue diagonal lines in Fig. 9) and in four different ways by IR combination differences. Plenty of such comparisons can be made with help of the data, forming a consistent set of highly accurate transitions for this molecule.
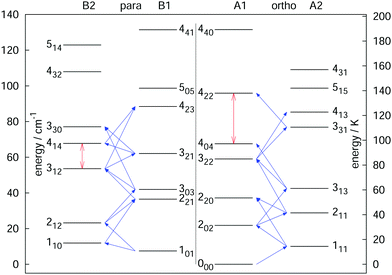 | ||
| Fig. 9 Illustration of the rotational levels of CD2H+ and the 25 rotational transitions (blue arrows) measured with the double resonance scheme in high resolution.76 The red vertical arrows are two examples for combination differences formed by sums or differences of the rotational frequencies (e.g. the 414 ↔ 312 combination difference can be formed by one sum and one difference of the transitions). Such highly accurate combination differences can help to validate IR data of that molecule.76 Reprinted with permission of Elsevier. | ||
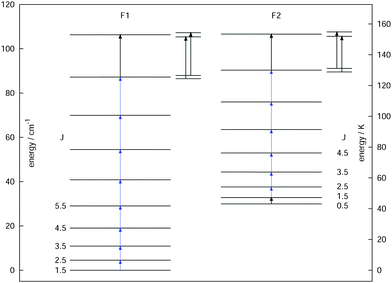
As a final example, the rotational signatures of the linear ion HCCD+ are discussed in the following. Similar to the ions mentioned above, the high-resolution IR spectroscopy work of this ion was pioneered by the Oka group.71,102 For the double resonance work, first the ν1 symmetric stretching band of HCCD+ was revisited using LIR, for which the band center was determined to be at about 3183.4 cm−1. In contrast to the ions mentioned above, HCCD+ is an open shell molecule, with a 2Π ground state (i.e. with a lone electron with spin S = 1/2 and orbital angular momentum along the molecular axis Λ = 1), thus exhibiting spin–orbit interaction and Λ-doubling. The corresponding rotational levels are depicted in Fig. 10, illustrating the two spin–orbit components F1 (2Π3/2) and F2 (2Π1/2). With the double-resonance method, 8 rotational transitions have been measured within F1 between 135 and 519 GHz, and 6 within F2 (see blue arrows in Fig. 10), each consisting of two Λ-doubling components. These rotational lines exhibit a pronounced hyperfine structure (not depicted in the Figure) due to the interaction with the nuclear spins of the hydrogen and deuterium nuclei (with nuclear spins of I = 1/2 and I = 1, respectively). Although the analysis of the extended hyperfine structure is not complete yet, it seems clear at this point that the severe signal dilution for this ion due to the fine and hyperfine structure (and potentially also the Zeeman effect) will make the detection of this ion in space very challenging (apart from its low abundance).
4.3 Rotational–vibrational double resonance via predissociation
The preceding section demonstrated that high-resolution rotational spectroscopy can be performed by double resonance via a vibrational action spectroscopy scheme. This means that if a vibrational action spectroscopy scheme with rotational resolution exists for a molecule, the spectroscopy can be readily extended into the rotational domain by such double-resonance methods. One well-proven vibrational action spectroscopic method is predissociation. In the domain of ionic complexes, it has been applied to fundamental weakly bound systems such as H+(H2O)n, CH5+(H2)n or H3+(H2)n,25,26,62,63,67,103 as well as to cation-rare gas complexes104–108 at low temperature, and in particular to cation–helium complexes.32,33,35,65,69 The first demonstration of the rotational-predissociation double resonance technique has been shown for the CH3+−He complex,28 based on earlier IR predissociation work by Dopfer and coworkers65 in Basel. This test system has been chosen because of its easy production, its presumable simple spectrum (closed shell symmetric top), its large dipole moment (2.9 D101), and because its ν3 band (antisymmetric C–H stretch) features well-separated rovibrational lines.65 The action scheme is illustrated in Fig. 11, and is very similar to the schemes shown in Fig. 8. A tunable narrow-bandwidth (sub)mm-wave beam is overlapped with an IR laser beam. The laser frequency is fixed on one predissociating vibrational transition (one of the red arrows in Fig. 11) to obtain a constant photodissociation signal. Depending on the choice of the vibrational transition combined with the rotational transition (blue arrow), either depletion or enhancement of the signal intensity is obtained, when the (sub)mm-wave source is tuned through the rotational resonance. Please observe that the different signal forms (peak vs. dip) in Fig. 8 and 11 are due the detection of the product ion (H3+ in Fig. 8) and the parent ion (CH3+−He in Fig. 11), respectively.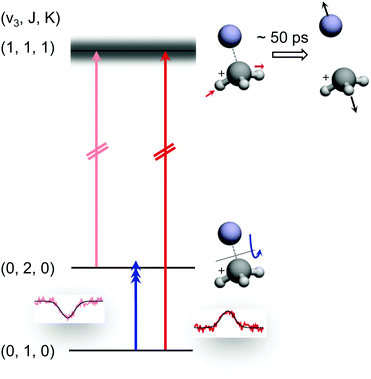 | ||
| Fig. 11 Rotational-predissociation double resonance scheme illustrated for the example of CH3+–He.28 The fixed IR laser probes either the initial (dark red) or the final (light red) level of the rotational transition (blue), giving rise to different signal forms when the frequency of the rotational excitation is scanned: in the left combination, the rotational transition pumps ions into the level (0,2,0) probed by the IR laser, enhancing the dissociation of CH3+–He. In the right combination, the rotational transition pumps ions out of the level (0,1,0) probed by the IR laser, thus hindering the dissociation. Reprinted with permission of APS. | ||
When this rotational method is applied to cation–helium complexes, interesting spectroscopic features may be anticipated due to the large amplitude motion of the loosely bound He atom. Up to date, the symmetric top CH3+−He28 and the linear HCO+−He109 have been investigated, for which twenty-three and eleven highly resolved rotational lines have been measured, respectively. In both cases, the non-harmonic shallow potential energy surfaces lead to poorly converging spectroscopic fits, so that high orders of centrifugal distortion constants have to be included. In addition, the symmetric top CH3+−He28 exhibits an unexpected perturbation, which effectively renders the Hamiltonian to be formally that of a slightly asymmetric top. This is detected as splittings for the K = 1 transitions of the order of 1 MHz (see Fig. 12), which increase with J, whereas levels with K = 0 and K ≥ 2 have no and negligible splittings, respectively. It has been speculated28 that this perturbation is caused by the large amplitude motion of the He atom in the ground vibrational state, with the He atom located on average about 10° off from the C3 symmetry axis,65 in combination with the internal rotation of the CH3-moiety.
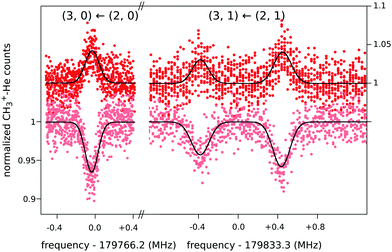 | ||
| Fig. 12 Four single measurements of rotational ground state transitions of CH3+–He at a nominal trap temperature of 4 K.28 The color code (light and dark red) corresponds to the two measurement schemes illustrated in Fig. 11. The given quantum numbers (J,K) are those of a symmetric top. The unexpected small splitting for the K = 1 transition is explained in the text. Reprinted with permission of APS. | ||
The presented double resonance scheme is widely applicable, as it is based on the fragmentation of a molecule. The only requirements are long-lived resonances in the vibrationally excited state so that individual rovibrational transitions can be picked out by the high-resolution IR laser (typically lifetimes should be longer than τ = 10 ps leading to Lorentzian FWHM linewidths of less than Δ![[small nu, Greek, tilde]](https://www.rsc.org/images/entities/i_char_e0e1.gif) = 1/(2πτ) ≈ 0.5 cm−1). Advantages of this method are the inherent verification of the assignments of the involved ro-vibrational and rotational transitions (of importance in case of perturbations as described for CH3+−He), as well as the high resolution achieved for Doppler-limited rotational lines measured at cryogenic conditions. Such a high resolution is prevented by lifetime broadening in bare predissociation spectra (this broadening is indicated in Fig. 11 for the predissociating level). On the other hand, the broadened IR lines are beneficial in double resonance experiments, because the requirements for laser stabilization are less strict. Other (action) spectroscopic methods for measuring rotational spectra of weakly bound complexes are less suitable. For instance, measurements of the rotational transitions of CH3+−He and HCO+−He with the state-selective attachment method described in Section 4.5 failed.28,109
= 1/(2πτ) ≈ 0.5 cm−1). Advantages of this method are the inherent verification of the assignments of the involved ro-vibrational and rotational transitions (of importance in case of perturbations as described for CH3+−He), as well as the high resolution achieved for Doppler-limited rotational lines measured at cryogenic conditions. Such a high resolution is prevented by lifetime broadening in bare predissociation spectra (this broadening is indicated in Fig. 11 for the predissociating level). On the other hand, the broadened IR lines are beneficial in double resonance experiments, because the requirements for laser stabilization are less strict. Other (action) spectroscopic methods for measuring rotational spectra of weakly bound complexes are less suitable. For instance, measurements of the rotational transitions of CH3+−He and HCO+−He with the state-selective attachment method described in Section 4.5 failed.28,109
The wide applicability of the rotational-predissociation double resonance allows many interesting systems to be investigated in the future. These include more strongly bound complexes such as CH3+–Ne106 and CH3+–Ar,105 as well as HCO+–H2.110 Even more advantages can be expected by applying this method to ionic complexes containing nuclei with a quadrupole moment, as e.g. N2H+–He,111 NH2+–He,112 N2+–He,113 DCO+–He or ND2+–He. The hyperfine structure can be resolved in these cases, providing additional information on the internal dynamics of the complexes. Further future target systems (possessing a permanent dipole moment) include fundamental complexes such as CH+–He,44,114 H3+–He,27 H2+–He,115,116 or H+–He3.74,79,117 The latter three complexes are interesting, as they are floppy, consist of only hydrogen and helium atoms, and are thus fundamental few-electron systems. For H2+–He, although being a fundamental three-electron system, only difficult-to-assign microwave spectra close to the dissociation limit exist,118,119 as well as ab initio data for its rovibrational levels.115,116,120 This ion may have played an important role in the early universe, and it still plays an important role in astrochemistry as the intermediate collision complex in the fundamental He – H2+ scattering process. For H+–He3, a floppy asymmetric rotor of C2v symmetry, first experiments to measure its rotational transitions via the presented double resonance scheme in high resolution failed, as the probed proton shuttle motion at 1300 cm−1![[thin space (1/6-em)]](https://www.rsc.org/images/entities/char_2009.gif) 79,117 suffers from substantial lifetime broadening (τ ≈ 4 ps). Future investigations for this molecule will thus target its bending motion at 800 cm−1 in high resolution.
79,117 suffers from substantial lifetime broadening (τ ≈ 4 ps). Future investigations for this molecule will thus target its bending motion at 800 cm−1 in high resolution.
4.4 Rotational spectroscopy via electron detachment
Since the first detection of a molecular anion in space, linear C6H−,12 anions have taken a firm place in astrochemical models, and to date six molecular anions have been identified in space based on standard microwave absorption work (see e.g. ref. 14, 17 and 121). For future laboratory detections of anions, high-resolution rotational action spectroscopy via double resonance schemes is in principle feasible and has been demonstrated for OH−![[thin space (1/6-em)]](https://www.rsc.org/images/entities/char_2009.gif) 99via the reaction given in Section 4.2. But generally it is a fortunate coincidence to find a suitable reaction scheme. Therefore, a more general 2-color action scheme has been developed by Roland Wester and collaborators in Freiburg and Innsbruck, consisting of a sequential resonant (bound-bound) absorption of a THz rotational photon, transferring the anion from a lower rotational state into an upper rotational state, followed by a non-resonant (bound-free) detachment of the excess electron of the anion from the upper rotational state by a tunable laser. In this scheme, the detachment laser is tuned and then fixed so that anions in the upper rotational level are detached, but not the anions in the lower rotational level. Ground for this technique has been laid by former photodetachment spectroscopy work on OH−,122 resolving the stepwise opening of additional detachment channels on tuning of the laser, by which the rotational temperature of the trapped and buffer gas cooled anion ensemble could be determined. The neutralization of the anion in the ion trap can thus be taken as the action signal for rotational spectroscopy, which is altered when the THz frequency is scanned over the rotational resonance. This scheme and the corresponding signals for the transitions J = 1 ← 0 and J = 2 ← 1 of OD− are presented in Fig. 13.123 For the detachment of the excess electron, a cw tunable ring dye laser at 680 nm has been applied (the detachment threshold for OH− in J = 0 is 14740.982(7) cm−1
99via the reaction given in Section 4.2. But generally it is a fortunate coincidence to find a suitable reaction scheme. Therefore, a more general 2-color action scheme has been developed by Roland Wester and collaborators in Freiburg and Innsbruck, consisting of a sequential resonant (bound-bound) absorption of a THz rotational photon, transferring the anion from a lower rotational state into an upper rotational state, followed by a non-resonant (bound-free) detachment of the excess electron of the anion from the upper rotational state by a tunable laser. In this scheme, the detachment laser is tuned and then fixed so that anions in the upper rotational level are detached, but not the anions in the lower rotational level. Ground for this technique has been laid by former photodetachment spectroscopy work on OH−,122 resolving the stepwise opening of additional detachment channels on tuning of the laser, by which the rotational temperature of the trapped and buffer gas cooled anion ensemble could be determined. The neutralization of the anion in the ion trap can thus be taken as the action signal for rotational spectroscopy, which is altered when the THz frequency is scanned over the rotational resonance. This scheme and the corresponding signals for the transitions J = 1 ← 0 and J = 2 ← 1 of OD− are presented in Fig. 13.123 For the detachment of the excess electron, a cw tunable ring dye laser at 680 nm has been applied (the detachment threshold for OH− in J = 0 is 14740.982(7) cm−1![[thin space (1/6-em)]](https://www.rsc.org/images/entities/char_2009.gif) 122,124), and for the THz radiation the difference of two cw NIR diodes has been generated on a photomixer, and the radiation (with a power on the order of several 100 nW) admitted to the 22-pole ion trap through a Teflon window. The experiment has been performed at a nominal trap temperature of 8.5 K. The Lorentzian signal shape seen in Fig. 13 is given by the spectral shape of the THz source, with a linewidth of a few MHz, which is in turn given by the linewidth of one of the diode lasers. Lorentzian fits yield center frequencies of f01 = 598596.077(188) MHz for the transition J = 1 ← 0 and f12 = 1196791.573(266) MHz for J = 2 ← 1, being in good agreement with previous high-resolution discharge tube absorption measurements by Cazzoli and Puzzarini.15,125 The obtained uncertainty is on the order of a few 100 kHz, and thus a factor of three to six larger than in the previous absorption experiment. However, the demonstration of this action scheme for anion THz spectroscopy paves the way for the laboratory detection of unexplored molecular anions of astrophysical interest, as a tool complementary to the very successful direct absorption and FT-MW techniques. Due to the non-resonant character of the photodetachment process, a large population difference between the rotational levels is required. The authors estimate that with a future trap temperature of 4 K, rotational transition frequencies as low as 200 GHz become accessible.
122,124), and for the THz radiation the difference of two cw NIR diodes has been generated on a photomixer, and the radiation (with a power on the order of several 100 nW) admitted to the 22-pole ion trap through a Teflon window. The experiment has been performed at a nominal trap temperature of 8.5 K. The Lorentzian signal shape seen in Fig. 13 is given by the spectral shape of the THz source, with a linewidth of a few MHz, which is in turn given by the linewidth of one of the diode lasers. Lorentzian fits yield center frequencies of f01 = 598596.077(188) MHz for the transition J = 1 ← 0 and f12 = 1196791.573(266) MHz for J = 2 ← 1, being in good agreement with previous high-resolution discharge tube absorption measurements by Cazzoli and Puzzarini.15,125 The obtained uncertainty is on the order of a few 100 kHz, and thus a factor of three to six larger than in the previous absorption experiment. However, the demonstration of this action scheme for anion THz spectroscopy paves the way for the laboratory detection of unexplored molecular anions of astrophysical interest, as a tool complementary to the very successful direct absorption and FT-MW techniques. Due to the non-resonant character of the photodetachment process, a large population difference between the rotational levels is required. The authors estimate that with a future trap temperature of 4 K, rotational transition frequencies as low as 200 GHz become accessible.
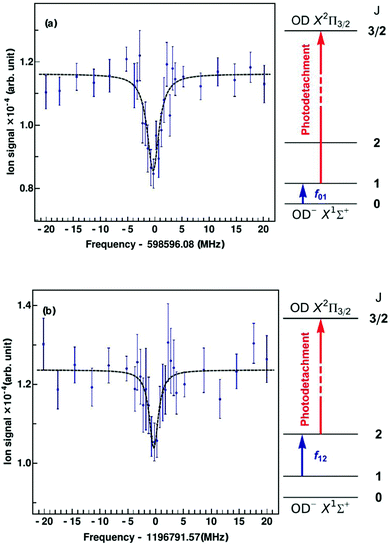 | ||
| Fig. 13 Rotational action spectroscopy of the OD− anion in a 22-pole ion trap.123 On rotational resonance, ions are pumped into the next higher rotational state, shown as blue arrows in the energy level diagrams, J = 1 ← 0 (top, a) and J = 2 ← 1 (bottom, b). The increase in population of the upper rotational level is probed using state-selective photodetachment (red arrows), leading to neutralization of the anion in the trap. The data points are obtained from the average of 40 spectral scans. The measured data are fitted using Lorentzian profiles. From the fit, the central frequency is obtained as f01 = 598596.077(188) MHz for J = 1 ← 0 and f12 = 1196791.573(266) MHz for J = 2 ← 1. Figures reprinted from ref. 123 with permission of APS. | ||
While the hydroxyl anion, OH−, is well measured in the laboratory (but not detected in interstellar molecular clouds), the deprotonated form of the interstellar abundant ammonia, the NH2− anion, has been less well characterized. NH2− is an asymmetric top with a singlet electronic ground state, so that its rotational spectrum is not complicated by fine structure. With only rough estimates of its rotational transition frequencies at hand, an astronomical absorption feature detected with the HIFI instrument onboard the Herschel satellite towards SgrB2(M) at 934 GHz126 has been tentatively assigned to this molecule. Recently, the Innsbruck group used the presented rotational-photodetachment spectroscopy scheme to measure the lowest two rotational transitions of deprotonated ammonia, the b-type ortho-transition 110 ← 101 at 447375.1(30) MHz and the para-transition 111 ← 000 at 933954.2(20) MHz.127 Due to the low electron affinity of NH2 (6224(1) cm−1![[thin space (1/6-em)]](https://www.rsc.org/images/entities/char_2009.gif) 128), a tunable IR laser near 1600 nm is sufficient for the detachment of NH2−. Now, with a laboratory frequency value accurate to a few MHz, the authors obtained a discrepancy between the sky and laboratory signal, concluding that the former tentative assignment126 is incorrect.
128), a tunable IR laser near 1600 nm is sufficient for the detachment of NH2−. Now, with a laboratory frequency value accurate to a few MHz, the authors obtained a discrepancy between the sky and laboratory signal, concluding that the former tentative assignment126 is incorrect.
4.5 Rotational spectroscopy via state-specific He attachment
As mentioned in Section 4.3, attaching noble gas atoms (traditional ‘tags’ are argon or neon) or other small molecules to ionic species can be exploited for vibrational spectroscopy via predissociation.34,67,129–131 This is a very valuable approach in cases where the spectra of the untagged (naked) species are difficult to obtain. Of course, the vibrational transition frequencies of the tagged species are shifted compared to the untagged species, but one obtains good estimations of the vibrational band positions of the naked ion which can then be compared to ab initio calculations. Reducing the influence of the tag can be achieved by attaching helium, as it is much less strongly bound so that much less distortions of the molecular structure and thus smaller shifts in the spectrum can be expected. In the first experiments along these lines, He-tagged clusters have been produced directly in supersonic expansion ion sources,73,132 but more recently, modern cryogenic methods allow to produce them in situ in cold ion traps filled with helium gas.33,35,42Such cryogenic ion trap experiments operating close to 4 K allow an equilibrium of the parent cation and its helium-tagged counterpart to be formed (vide infra). Very interestingly, perturbation of this equilibrium by IR excitation via a cw laser does not only lead to the vanishing of the cation–helium complexes by predissociation, but, by exciting the parent ion, it can also lead to the suppression of the attachment of the loosely bound helium atom, thus making direct spectroscopy of the naked cation feasible. The latter effect, called ‘Laser Induced Inhibition of Complex Growth’ (LIICG), has been explained in Section 3.5. Cases have been observed, where the predissociation and the LIICG signals of the tagged and untagged species, respectively, are recorded in one and the same scan of the vibrational spectrum.27,44,79
The LIICG method as applied to electronic or vibrational spectroscopy can be conveniently explained by an energy argument: the energy absorbed in an electronic or vibrational transition is much higher than the binding energy of the He atom (which is on the order of ∼50 cm−1). Therefore, it came as a surprise, when Brünken and Schlemmer pioneered the application of this approach to pure rotational spectroscopy of a cation, where much lower photon energies are involved. The first application of rotational LIICG was demonstrated on the l-C3H+ cation,133 a linear molecule with a 1Σ ground state. Four rotational transitions have been measured at a nominal trap temperature of 4 K in the range 44 to 113 GHz, of which one is depicted in Fig. 14. This unambiguous laboratory detection also confirmed the origin of lines which had been previously detected in the Horsehead photodissociation region136 and toward Sgr B2(N),137 and thus ended discussions about their potential carrier.
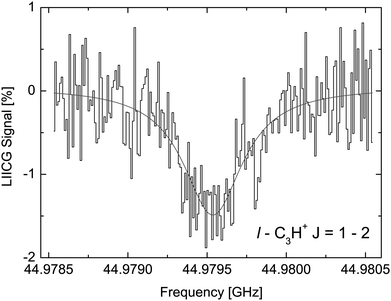 | ||
| Fig. 14 The rotational transition J = 2 ← 1 of l-C3H+ measured by storing several ten thousand C3H+ ions in a cold (4.1 K) and dense (∼1015 cm−3) helium bath and continuous irradiation with tunable narrow-band mm-wavelength radiation. The rotational transition of the bare ion can be recorded by counting the C3H+–He complex ions as a function of excitation frequency. On resonance, the number of formed complex ions (black histogram) decreases by about 1.5%. The black line is a fit with a Lorentzian line-shape function to the data. In the original publication,133 the lines for J = 3 ← 2 and J = 4 ← 3 are shown. | ||
Due to the very specific nature of LIICG when applied in the rotational domain, it has been later renamed to ‘Rotational state-dependent attachment of He atoms’. A very detailed account on the kinetics of this process has been given by Brünken et al.80 on the example of the fundamental J = 1 ← 0 transition of CD+. This transition as well as the next higher transition J = 2 ← 1 are depicted in Fig. 15. In such an experiment, several ten thousand CD+ parent ions are stored per trapping cycle in the cold ion trap where they are cooled to the ambient temperature (4 K) by collisions with He gas. The helium gas is leaked into the trap in a constant fashion, with the equilibrium He density on the order of 1015 cm−3. Owing to these conditions, helium will readily attach to the trapped ions via ternary collision processes. The formed CD+–He ion–atom complexes can, on the other hand, be dissociated again by collisions with helium (collision induced dissociation – CID), leading to the equilibrium
 | (1) |
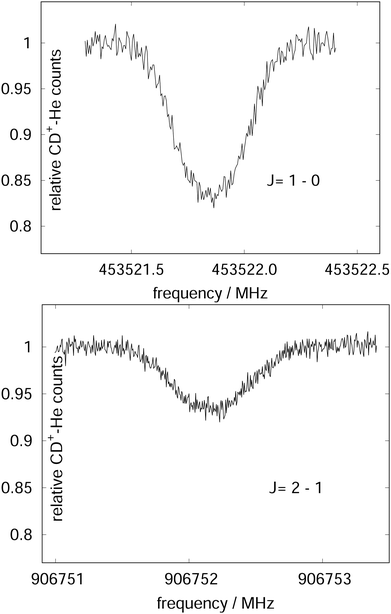 | ||
| Fig. 15 The rotational transitions J = 1 ← 0 and J = 2 ← 1 of CD+, measured via state-specific He attachment, with depletions of about 17% and 7%, respectively. Several of such measurements yield the center frequencies 453521.8530(6) and 906752.1649(17) MHz, respectively, improving the uncertainty for the latter transition by nearly two orders of magnitude,134 while the accurate value existing for the J = 1 ← 0 transition (measured previously in the Cologne laboratories) has been confirmed.80,135 Unpublished Figures of the work described in ref. 44. | ||
To perform rotational spectroscopy of the trapped ions with a cw (sub)mm-wave source, one exploits the fact that the ternary helium attachment rate k3 (see equation above) depends on the wavefunction of the state with total angular momentum J. Typically, a state with higher J has lower k3(J). For instance, k3(1) = 0.55·k3(0) has been deduced for CD+ by comparing measurements to a detailed kinetic model.80 The observed effective attachment rate coefficient k3 is then a weighted average of state-specific rate coefficients k3(J) with the weights given by the relative rotational state populations p(J):
 | (2) |
As these experiments are operating close to 4 K, only a few occupied quantum levels are involved in this process. Upon excitation of a rotational transition, J → J + 1, the initial Boltzmann-like state population is altered, resulting in a lowering of the effective attachment rate coefficient k3. Consequently, the equilibrium given in (1) is shifted to the left, and the number of complex ions CD+–He is decreasing on resonance, as depicted in Fig. 15. A complete scheme of these elementary processes is illustrated in Fig. 16, including collisional (inelastic collisions of CD+ with He, ternary attachment leading to CD+–He, and collision induced dissociation of CD+–He) and radiative processes (spontaneous and stimulated radiative rotational transitions), as thoroughly described in ref. 80.
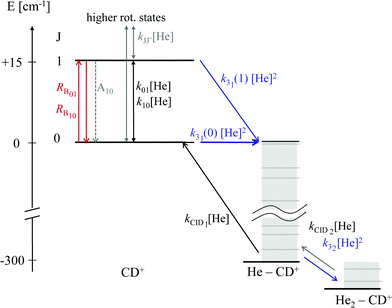 | ||
| Fig. 16 Scheme of the elementary kinetic processes involved in the ternary attachment of He to CD+ and the simultaneous excitation of the CD+J = 1 ← 0 rotational transition. The processes are depicted as arrows and include the rotational state-dependent ternary Helium-cluster formation (blue), the collision induced cluster dissociation (CID, black), the rotational (de-)excitation of the CD+ ions by collisions with Helium, the spontaneous emission of the J = 1 level, and the radiative stimulated (de-)excitation of CD+ (red), with the associated rates given by the corresponding symbols. Figure reprinted from ref. 80 with permission of Elsevier. | ||
The presented rotational action spectroscopic scheme needs a high-resolution cw radiation source for effectively shifting the equilibrium given in eqn (1). Pulsed sources are ineffective for this method (similar to LIICG as explained in Section 3.5). Furthermore, the method is confined to trap temperatures close to 4 K, and therefore only a few low-lying rotational levels and transitions can be accessed. But a big advantage is its extreme versatility, as a helium atom can be attached in principle to any cation. More than a dozen molecular cations, for which no other suitable rotational action spectroscopic method could be identified, have been investigated in the laboratory with the state-dependent He attachment method, many for the first time. Exact rotational transition frequencies have been provided for l-C3H+,133 CF+,138 SiH+,139 HCO+,109 CD+,44,80 CH+ and 13CH+,44 NH3D+,138,140 NH2D2+ and NHD3+,140 CN+,141 CH2NH2+,77 CH3NH3+,142 NO+![[thin space (1/6-em)]](https://www.rsc.org/images/entities/char_2009.gif) 143 and CCl+.144
143 and CCl+.144
To date, attempts to attach a helium atom to an anion at 4 K, e.g. to OH−,99 were unsatisfactory, because the involved binding energies are even lower than for complexes consisting of a neutral molecule and He.145 For the spectroscopy of anions via this method, traps operating well below 4 K (with e.g. pulse tube cooling) have to be constructed in the future. But also for cations, there have been failed attempts to record rotational transitions, though He atoms could be attached. As mentioned above, the state-dependent He attachment method relies on the dependence of k3 on the quantum state. But one cannot know a priori whether there is such a substantial dependence. Also, the cw radiation source must be powerful enough to compete with the collisional processes.80 There have been cases where the detection via the rotational state-dependent attachment method simply failed because of these reasons. These failed attempts include the rotational spectroscopy of O2H+ (3A′′),43 C3H2+ (2A1),146 PH+ (2Π) and N2O+ (2Π)143 as well as the well-predicted transition J = 1–2 of SiH+ (1Σ)139 and the 20–10 and 21–11 transitions of the symmetric rotor NH3D+ (1A1).138,140 Also, very interestingly, for the N = 1–0 transition of CO+ (2Σ), only one fine structure component (13/2–01/2) could be detected, the one in which the total angular momentum quantum number J = S + N changes, but not the other transition (11/2–01/2) of that doublet.80 It is extremely striking that all successful examples of this method have a singlet electronic ground state, while the failed examples above contain many open-shell species. One obvious reason contributing to this finding is that open-shell species exhibit more spectral features and thus suffer from signal dilution. Nevertheless, further investigations on the application of this method to open-shell systems seem mandatory.
4.6 Rotational–vibrational double resonance via LIICG
Quite recently, the vibrational version of LIICG (see Section 3.5) has been applied to perform rotational spectroscopy77via double-resonance. This may seem obsolete, as hindering of He attachment can be achieved by a rotational photon alone, as demonstrated in the preceding Section 4.5. But in contrast to electronic or vibrational excitation, the photons involved in molecular rotational transitions have very little energy (on the order of only E/hc ≈ 10 cm−1), so the suppression of complex formation upon resonant absorption is rather limited, since the ternary attachment of He is only hindered (or changed) instead of inhibited. To improve the limited depletion signal in a pure rotational excitation, a double resonance scheme which is based on the more pronounced LIICG-signal of the rovibrational excitation has been demonstrated for protonated methanimine, CH2NH2+.77 The scheme and the results are shown in Fig. 17. For this scheme, the IR excitation frequency of the optic parametric oscillator is held on a rovibrational transition, producing a LIICG depletion signal. This LIICG depletion can then be altered by a rotational transition which pumps additional ions into the rotational state probed by the IR laser. By scanning the mm-wave excitation frequency over the rotational transition frequency while the IR wavenumber is kept fixed on resonance, the rotational line can be recorded. As seen on the right side of Fig. 17, this novel double resonance scheme exhibits a signal up to 2–3 times stronger than the rotation-only method, which enabled the detection of weak pure rotational transitions of the CH2NH2+ molecule. Up to date, this novel method has been applied to CH2NH2+ only, but it seems to be a promising tool in cases where other rotational action schemes failed (e.g. O2H+,43 C3H2+,146 HC3O+ or the J = 1–2 transitions of SiH+,139 see also preceding section).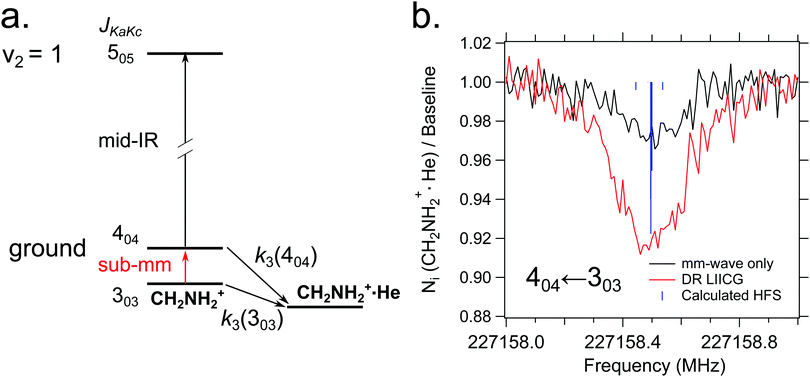 | ||
| Fig. 17 (a) A simple diagram showing the transitions and tagging mechanism involved in the double resonance scheme for the CH2NH2+ molecule. The ternary association rate with He is designated k3. (b) A comparison between scans of the 404 ← 303 transition taken with standard mm-wave-only scheme (black) and double resonance using LIICG (red), which in this case was stronger by a factor of three. Hyperfine structure from the 14N nucleus (I = 1) is indicated with blue sticks but was not resolved in the spectroscopic measurements. Reproduced from ref. 77 with permission from the PCCP Owner Societies. | ||
5 Rotational spectroscopy of sympathetically cooled ions
The examples of the preceding sections showed some quantum state control of the molecular ion ensemble and spectroscopy in high resolution simply by cooling them via helium buffer gas. Even lower kinetic temperatures, and in particular Doppler-free operation, as well as better quantum state control can be obtained by co-trapping molecular ions with laser-cooled atomic ions (or even a single molecule with a single atom) in a linear Paul trap (so-called sympathetic cooling). In combination with other techniques, e.g. quantum logic spectroscopy,148 very detailed information and highest rotational resolution is obtained, as shown with the two examples of HD+ and CaH+ in the following. These examples can be considered action spectroscopy. But in contrast to the examples given before, the spectroscopic signal here is not given by counting the ions (as shown in Fig. 1), but by observing the fluorescence of the cooled atomic ions.The first example concerns the most fundamental molecule having electric dipole-allowed rotational transitions, HD+ (2Σg+). It consists only of a proton, a deuteron and a single electron. Due to this simple composition, computations from high-level ab initio theory can be compared to high-resolution experiments, helping to determine fundamental constants as the proton mass or the proton-to-electron mass ratio. HD+ has an interesting coupling scheme of angular momenta for low values of the rotational angular momentum N, in which (in order of the most important energy contributions) first the electron spin (s = 1/2) and the proton nuclear spin (I = 1/2) couple, and then the nuclear spin of the deuteron (I = 1). The resulting angular momentum of these spins then couples with N to form the total angular momentum F.149 Experiments by Schiller and coworkers pursue the spectroscopy of this ion by sympathetic cooling inside a Coulomb crystal of laser-cooled atomic ions (Be+), all confined in a linear Paul trap.150–152 By this approach, kinetic temperatures as low as approximately 10 mK are achieved for the molecular ions. Additionally, applying a rotational cooling scheme by two IR lasers, the population in N = 0 may be enhanced compared to the room-temperature blackbody equilibrium situation. Recently, they achieved to operate the experiment in the Lamb-Dicke regime, in which the Doppler broadening is eliminated.147 The Lamb-Dicke regime is reached by confining the motion of the species under investigation along the spectroscopy beam direction, δx < λ/2π. This is most easily achieved for rotational spectroscopy with its long wavelength λ. They recorded two overlapping hyperfine components (N,F,mF) = (1,3,±3) ← (0,2,±2) of the fundamental rotational transition in very high resolution. Here, mF is the projection of F along the quantization axis (a small magnetic field has been applied). The rotational excitation was provided by a multiplier/amplifier chain. The resonant excitation was detected destructively via two following steps, one resonant vibrational overtone transition at 1420 nm and one non-resonant electronic transition at 266 nm, leading finally to dissociation of HD+. The measurement of the given transition under low-power conditions, as shown in Fig. 18, yields the value 1.3149358280(4)(3) THz (the numbers in parentheses indicating the statistical and systematic error, respectively147). More recently, the Schiller group improved the described experimental approach, reaching even higher experimental resolution153 and enabling the determination of center frequencies with a relative uncertainty on the 10−11 level. By this, the two Zeeman components included in the signal in Fig. 18 could be resolved. In total, they measured six hyperfine components of the fundamental rotational transition of HD+ (six out of 32 possible), and compared them to high-level ab initio calculations. This comparison yields values for fundamental constants and combinations of them which are able to challenge the current CODATA 2018 set of fundamental constants. For instance, the proton-to-electron mass ratio derived from this experiment has an uncertainty three times smaller than the value derived from Penning trap experiments. Thus, “for the first time, fundamental constants have been determined with competitive uncertainty making use of the rotational motion of a physical system”.153
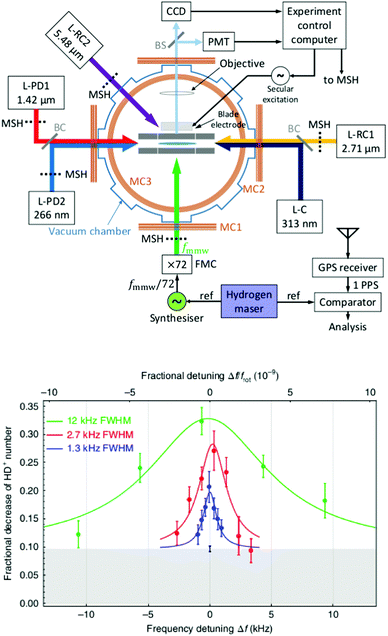 | ||
| Fig. 18 (Top) Setup for sympathetic cooling and rotational spectroscopy of HD+ (L-RC: rotational cooling laser, L-PD: photodissociation laser, L-C: Be+ cooling laser). (bottom) Spectroscopy signal of two unresolved hyperfine components (N,F,mF) = (1,3,±3) ← (0,2,±2) of the fundamental rotational transition of HD+. The different traces were recorded at different power levels. Figures reprinted from ref. 147 with permission of Springer Nature. | ||
Another very promising approach has been demonstrated very recently for the rotational spectroscopy and quantum state control of a single 40CaH+ ion.155 This ion has a 1Σ ground state and hyperfine structure due to the nuclear spin I = 1/2 of the proton. The 40CaH+ ion was co-trapped with a single laser-cooled 40Ca+ ion in the presence of a small magnetic field, leading to the separation of the molecular states with different projection quantum number m (this is the projection of the total angular momentum along the magnetic field, the total angular momentum consisting of rotational angular momentum and the proton nuclear spin). At very low temperature, the motion of both ions is coupled along the longitudinal axis of the ion trap (they occupy harmonic oscillator levels), and the quantum state of 40CaH+ can be read out non-destructively using quantum logic spectroscopy148,154via the 40Ca+ atom. Rotational spectroscopy of 40CaH+ has been done by coherently driving stimulated Raman transitions with two optical frequency combs, which were frequency shifted by acusto-optical modulators to match the allowed Raman transitions with selection rules ΔJ = 0,±2 and Δm = ±1. Four Raman transitions have been recorded with 11 significant digits, one of which is shown in Fig. 19. Using these four values and ab initio computed corrections to cancel the influence of the magnetic field and the hyperfine structure, the rotational parameters have been determined to fourth order, with a rotational constant B = 142.5017779(17) GHz. The beauty of this method lies in the use of highly stable frequency combs operating in the NIR to drive the rotational transitions, without resorting to mm-wave or THz-sources, as well as the high degree of quantum control. When extended to polyatomic molecular ions, in particular chiral ones, many more fundamental discoveries may be expected in the future.
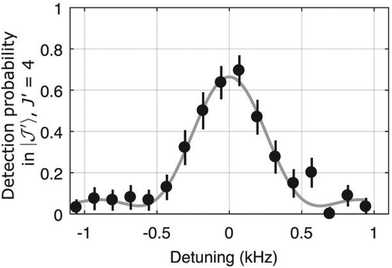 | ||
| Fig. 19 After preparing a single 40CaH+ ion in the (J,m,ξ) = (2, −5/2, –) state, the probability to be in the (4, −7/2, –) state is detected by quantum-logic techniques.154,155 When the comb Raman pulses (duration 1.6 ms) drive the transition (4, −7/2, –) ← (2, −5/2, –) at a difference frequency 1.992911000121(16) THz, the 40CaH+ ion is coherently transferred into this state. Figure reprinted from ref. 155 with permission of AAAS. | ||
6 Conclusions and outlook
The last decade has witnessed the development of many new rotational action spectroscopic schemes. As seen in Section 4, rotational action spectroscopy can be performed by double resonance via a known rovibrational or rovibronic action spectroscopy scheme. This means that if a robust vibrational or electronic action scheme exists for a molecule, the spectroscopy can be readily extended into the rotational domain by such double-resonance methods. This has already been demonstrated for the rotational-LIR (Section 4.2), the rotational-predissociation (Section 4.3) and the rotational–vibrational LIICG (Section 4.6) double resonance schemes. Novel schemes of this kind are needed to investigate anions (as a complementary tool to non-resonant electron detachment, Section 4.4), or for such ions that eluded the rotational detection by the otherwise general LIICG method (Section 4.5).Prime targets of the existing action schemes are floppy molecular ions which are best investigated in cryogenic ion traps. Examples include the mentioned hydrogen–helium complexes HnHem+,27,79,116–118 as well as the enigmatic CH5+![[thin space (1/6-em)]](https://www.rsc.org/images/entities/char_2009.gif) 23,24,40,156 mentioned in the introduction. It is highly desirable to record first mm-wave spectra of CH5+, not only to understand its dynamics, but also for searches of this astrochemically important molecule in space (see e.g.Fig. 1 in ref. 21). The method of choice here is the rotational–vibrational double resonance explained in Section 4.2 using LIR. LIR of CH5+ with CO2 is known to have an excellent signal-to-noise ratio and can be operated at low temperature.40,156,157 As long as no detailed model of quantum levels and transitions of CH5+ is available,158 the quest for its mm-wave spectrum has to be done in an unbiased way. For this, one chooses a couple of strong IR transitions out of the 2897 known ones,40 and does a double-resonance with a mm-wave source. For a first unbiased search, the mm-wave source is preferably highly tunable, has lower resolution, and high power.
23,24,40,156 mentioned in the introduction. It is highly desirable to record first mm-wave spectra of CH5+, not only to understand its dynamics, but also for searches of this astrochemically important molecule in space (see e.g.Fig. 1 in ref. 21). The method of choice here is the rotational–vibrational double resonance explained in Section 4.2 using LIR. LIR of CH5+ with CO2 is known to have an excellent signal-to-noise ratio and can be operated at low temperature.40,156,157 As long as no detailed model of quantum levels and transitions of CH5+ is available,158 the quest for its mm-wave spectrum has to be done in an unbiased way. For this, one chooses a couple of strong IR transitions out of the 2897 known ones,40 and does a double-resonance with a mm-wave source. For a first unbiased search, the mm-wave source is preferably highly tunable, has lower resolution, and high power.
Further technical developments of ion trap machines suitable for rotational action schemes are the extension to temperatures lower than 4 K (this can be e.g. achieved with pulse tube coolers and will be needed for applying LIICG to anions or for the effective cooling of more complex ions) and the extension to lower excitation frequencies. Concerning the latter point, up to now, rotational action spectroscopy experiments typically have a cutoff frequency limit given by the geometry of the trap electrode orifices which are on the order of 1 cm. The lowest-frequency rotational action spectroscopic measurement up to now was performed at 23 GHz,92 which already exhibited some broadening artefacts connected with attenuation and excessive use of microwave power. Large and complex molecular ions need access to lower frequencies. This could be accomplished in the future in traps with a long and lateral irradiation window,56 or even better, by incorporation of a lateral microwave feed horn into the ion trap. The latter solution would furthermore simplify the setup by replacing a free-space beam by a vacuum-proof RF cable leading to the ion trap.
Conflicts of interest
There are no conflicts to declare.Acknowledgements
The work in Cologne has been supported by the Deutsche Forschungsgemeinschaft (DFG) via SFB 956 (project ID 184018867), sub-project B2, the Gerätezentrum “Cologne Center for Terahertz Spectroscopy” (DFG SCHL 341/15-1), as well as grants AS 319/2-2 and SCHL341/6-1/2.Notes and references
- S. Weinreb, A. H. Barrett, M. L. Meeks and J. C. Henry, Nature, 1963, 200, 829–831 CrossRef CAS.
- C. P. Endres, S. Schlemmer, P. Schilke, J. Stutzki and H. S. P. Müller, J. Mol. Spectrosc., 2016, 327, 95–104 CrossRef CAS.
- H. S. P. Müller, F. Schlöder, J. Stutzki and G. Winnewisser, J. Mol. Struct., 2005, 742, 215–227 CrossRef.
- T. J. Balle and W. H. Flygare, Rev. Sci. Instrum., 1981, 52, 33–45 CrossRef CAS.
- G. G. Brown, B. C. Dian, K. O. Douglass, S. M. Geyer, S. T. Shipman and B. H. Pate, Rev. Sci. Instrum., 2008, 79, 053103 CrossRef PubMed.
- R. C. Woods, T. A. Dixon, R. J. Saykally and P. G. Szanto, Phys. Rev. Lett., 1975, 35, 1269–1272 CrossRef CAS.
- M. Bogey, C. Demuynck, M. Denis, J. L. Destombes and B. Lemoine, Astron. Astrophys., 1984, 137, L15–L16 CAS.
- M. Bogey, H. Bolvin, C. Demuynck and J. L. Destombes, Phys. Rev. Lett., 1987, 58, 988–991 CrossRef CAS PubMed.
- F. C. De Lucia, E. Herbst, G. M. Plummer and G. A. Blake, J. Chem. Phys., 1983, 78, 2312–2316 CrossRef CAS.
- H. E. Warner, W. T. Conner, R. H. Petrmichl and R. C. Woods, J. Chem. Phys., 1984, 81, 2514 CrossRef CAS.
- E. Hirota and Y. Endo, J. Mol. Spectrosc., 1988, 127, 527–534 CrossRef CAS.
- M. C. McCarthy, C. A. Gottlieb, H. Gupta and P. Thaddeus, Astrophys. J., 2006, 652, L141–L144 CrossRef CAS.
- F. Matsushima, T. Oka and K. Takagi, Phys. Rev. Lett., 1997, 78, 1664–1666 CrossRef CAS.
- C. A. Gottlieb, A. J. Apponi, M. C. McCarthy, P. Thaddeus and H. Linnartz, J. Chem. Phys., 2000, 113, 1910–1915 CrossRef CAS.
- G. Cazzoli and C. Puzzarini, J. Chem. Phys., 2005, 123, 041101 CrossRef PubMed.
- T. Amano and T. Hirao, J. Mol. Spectrosc., 2005, 233, 7–14 CrossRef CAS.
- H. Gupta, S. Brünken, F. Tamassia, C. A. Gottlieb, M. C. McCarthy and P. Thaddeus, Astrophys. J., 2007, 655, L57–L60 CrossRef CAS.
- T. Amano, Astron. Astrophys., 2010, 516, L4 CrossRef.
- E. Herbst and W. Klemperer, Astrophys. J., 1973, 185, 505–534 CrossRef CAS.
- S. Petrie and D. K. Bohme, Mass Spectrom. Rev., 2007, 26, 258–280 CrossRef CAS PubMed.
- M. Larsson, W. D. Geppert and G. Nyman, Rep. Prog. Phys., 2012, 75, 066901 CrossRef CAS PubMed.
- B. A. McGuire, O. Asvany, S. Brünken and S. Schlemmer, Nat. Rev. Phys., 2020, 2, 402–410 CrossRef CAS.
- E. T. White, J. Tang and T. Oka, Science, 1999, 284, 135–137 CrossRef CAS PubMed.
- T. Oka, Science, 2015, 347, 1313–1314 CrossRef CAS PubMed.
- M. Okumura, L. I. Yeh and Y. T. Lee, J. Chem. Phys., 1985, 83, 3705–3706 CrossRef CAS.
- L. I. Yeh, M. Okumura, J. D. Myers, J. M. Price and Y. T. Lee, J. Chem. Phys., 1989, 91, 7319–7330 CrossRef CAS.
- I. Savić, D. Gerlich, O. Asvany, P. Jusko and S. Schlemmer, Mol. Phys., 2015, 113, 2320–2332 CrossRef.
- M. Töpfer, T. Salomon, S. Schlemmer, O. Dopfer, H. Kohguchi, K. M. T. Yamada and O. Asvany, Phys. Rev. Lett., 2018, 121, 143001 CrossRef PubMed.
- J. Oomens, A. van Roij, G. Meijer and G. von Helden, Astrophys. J., 2000, 542, 404–410 CrossRef CAS.
- K. R. Asmis, N. L. Pivonka, G. Santambrogio, M. Brümmer, C. Kaposta, D. M. Neumark and L. Wöste, Science, 2003, 299, 1375–1377 CrossRef CAS PubMed.
- N. C. Polfer, Chem. Soc. Rev., 2011, 40, 2211–2221 RSC.
- S. A. Nizkorodov, J. P. Maier and E. J. Bieske, J. Chem. Phys., 1995, 103, 1297–1302 CrossRef CAS.
- M. Brümmer, C. Kaposta, G. Santambrogio and K. R. Asmis, J. Chem. Phys., 2003, 119, 12700–12703 CrossRef.
- J. M. Headrick, E. G. Diken, R. S. Walters, N. I. Hammer, R. A. Christie, J. Cui, E. M. Myshakin, M. A. Duncan, M. A. Johnson and K. D. Jordan, Science, 2005, 308, 1765–1769 CrossRef CAS PubMed.
- J. Jašík, J. Žabka, J. Roithová and D. Gerlich, Int. J. Mass Spectrom., 2013, 354, 204–210 CrossRef.
- E. K. Campbell, M. Holz, D. Gerlich and J. P. Maier, Nature, 2015, 523, 322–323 CrossRef CAS PubMed.
- S. Schlemmer, T. Kuhn, E. Lescop and D. Gerlich, Int. J. Mass Spectrom., 1999, 185, 589–602 CrossRef.
- S. Schlemmer, E. Lescop, J. V. Richthofen and D. Gerlich, J. Chem. Phys., 2002, 117, 2068–2075 CrossRef CAS.
- O. Asvany, T. Giesen, B. Redlich and S. Schlemmer, Phys. Rev. Lett., 2005, 94, 073001 CrossRef CAS PubMed.
- O. Asvany, K. M. T. Yamada, S. Brünken, A. Potapov and S. Schlemmer, Science, 2015, 347, 1346–1349 CrossRef CAS PubMed.
- S. Chakrabarty, M. Holz, E. K. Campbell, A. Banerjee, D. Gerlich and J. P. Maier, J. Phys. Chem. Lett., 2013, 4, 4051–4054 CrossRef CAS.
- O. Asvany, S. Brünken, L. Kluge and S. Schlemmer, Appl. Phys. B, 2014, 114, 203–211 CrossRef CAS.
- H. Kohguchi, P. Jusko, K. M. T. Yamada, S. Schlemmer and O. Asvany, J. Chem. Phys., 2018, 148, 144303 CrossRef PubMed.
- J. L. Doménech, P. Jusko, S. Schlemmer and O. Asvany, Astrophys. J., 2018, 857, 61 CrossRef PubMed.
- O. Asvany, O. Ricken, H. S. P. Müller, M. C. Wiedner, T. Giesen and S. Schlemmer, Phys. Rev. Lett., 2008, 100, 233004 CrossRef PubMed.
- A. Svendsen, U. J. Lorenz, O. V. Boyarkin and T. R. Rizzo, Rev. Sci. Instrum., 2010, 81, 073107 CrossRef PubMed.
- J. G. Redwine, Z. A. Davis, N. L. Burke, R. A. Oglesbee, S. A. McLuckey and T. S. Zwier, Int. J. Mass Spectrom., 2013, 348, 9–14 CrossRef CAS.
- N. Heine and K. R. Asmis, Int. Rev. Phys. Chem., 2015, 34, 1–34 Search PubMed.
- S. Xu, S. Gozem, A. I. Krylov, C. R. Christopher and J. Mathias Weber, Phys. Chem. Chem. Phys., 2015, 17, 31938–31946 RSC.
- A. Günther, P. Nieto, D. Müller, A. Sheldrick, D. Gerlich and O. Dopfer, J. Mol. Spectrosc., 2017, 332, 8–15 CrossRef.
- S. Spieler, C. H. Duong, A. Kaiser, F. Duensing, K. Geistlinger, M. Fischer, N. Yang, S. S. Kumar, M. A. Johnson and R. Wester, J. Phys. Chem. A, 2018, 122, 8037–8046 CrossRef CAS PubMed.
- P. Jusko, S. Brünken, O. Asvany, S. Thorwirth, A. Stoffels, L. van der Meer, G. Berden, B. Redlich, J. Oomens and S. Schlemmer, Faraday Discuss., 2019, 217, 172–202 RSC.
- E. K. Campbell and P. W. Dunk, Rev. Sci. Instrum., 2019, 90, 103101 CrossRef.
- D. Gerlich, Phys. Scr., 1995, T59, 256–263 CrossRef.
- O. Asvany, F. Bielau, D. Moratschke, J. Krause and S. Schlemmer, Rev. Sci. Instr., 2010, 81, 076102 CrossRef PubMed.
- K. Geistlinger, M. Fischer, S. Spieler, L. Remmers, F. Duensing, F. Dahlmann, E. Endres and R. Wester, Rev. Sci. Instr., 2021, 92, 023204 CrossRef CAS PubMed.
- N. R. Daly, Rev. Sci. Instr., 1960, 31, 264–267 CrossRef CAS.
- W. H. Wing, G. A. Ruff, W. E. Lamb and J. J. Spezeski, Phys. Rev. Lett., 1976, 36, 1488–1491 CrossRef CAS.
- D. E. Tolliver, G. A. Kyrala and W. H. Wing, Phys. Rev. Lett., 1979, 43, 1719–1722 CrossRef CAS.
- J. T. Shy, J. W. Farley, W. E. Lamb and W. H. Wing, Phys. Rev. Lett., 1980, 45, 535–537 CrossRef CAS.
- J.-T. Shy, J. W. Farley and W. H. Wing, Phys. Rev. A: At., Mol., Opt. Phys., 1981, 24, 1146–1149 CrossRef CAS.
- M. Okumura, L. I. Yeh and Y. T. Lee, J. Chem. Phys., 1988, 88, 79–91 CrossRef CAS.
- D. W. Boo, Z. Liu, A. G. Suits, J. Tse and Y. T. Lee, Science, 1995, 269, 57–59 CrossRef CAS PubMed.
- D. W. Boo and Y. T. Lee, J. Chem. Phys., 1995, 103, 520–530 CrossRef CAS.
- R. V. Olkhov, S. A. Nizkorodov and O. Dopfer, J. Chem. Phys., 1999, 110, 9527–9535 CrossRef CAS.
- S. A. Nizkorodov, D. Roth, R. V. Olkhov, J. P. Maier and O. Dopfer, Chem. Phys. Lett., 1997, 278, 26–30 CrossRef CAS.
- E. Bieske and O. Dopfer, Chem. Rev., 2000, 100, 3963–3998 CrossRef CAS PubMed.
- O. Dopfer, Int. Rev. Phys. Chem., 2003, 22, 437–495 Search PubMed.
- J. Jašík, R. Navrátil, I. Němec and J. Roithová, J. Phys. Chem. A, 2015, 119, 12648–12655 CrossRef PubMed.
- O. V. Boyarkin, S. R. Mercier, A. Kamariotis and T. R. Rizzo, J. Am. Chem. Soc., 2006, 128, 2816–2817 CrossRef CAS PubMed.
- M.-F. Jagod, M. Rösslein, C. M. Gabrys, B. D. Rehfuss, F. Scappini, M. W. Crofton and T. Oka, J. Chem. Phys., 1992, 97, 7111–7123 CrossRef CAS.
- S. Schlemmer, O. Asvany and T. Giesen, Phys. Chem. Chem. Phys., 2005, 7, 1592–1600 RSC.
- A. Patzer, M. Schütz, T. Möller and O. Dopfer, Angew. Chem., Int. Ed., 2012, 51, 4925–4929 CrossRef CAS PubMed.
- A. G. Császár, T. Szidarovszky, O. Asvany and S. Schlemmer, Mol. Phys., 2019, 117, 1559 CrossRef.
- P. Jusko, C. Konietzko, S. Schlemmer and O. Asvany, J. Mol. Spectrosc., 2016, 319, 55–58 CrossRef CAS.
- P. Jusko, A. Stoffels, S. Thorwirth, S. Brünken, S. Schlemmer and O. Asvany, J. Mol. Spectrosc., 2017, 332, 59–66 CrossRef CAS.
- C. Markus, S. Thorwirth, O. Asvany and S. Schlemmer, Phys. Chem. Chem. Phys., 2019, 21, 26406–26412 RSC.
- J. L. Doménech, O. Asvany, C. R. Markus, S. Schlemmer and S. Thorwirth, J. Mol. Spectrosc., 2020, 374, 111375 CrossRef PubMed.
- M. Töpfer, A. Jensen, K. N. Anders, H. Kohguchi, T. Szidarovszky, A. G. Császár, S. Schlemmer and O. Asvany, Phys. Chem. Chem. Phys., 2020, 22, 22885 RSC.
- S. Brünken, L. Kluge, A. Stoffels, J. Pérez-Ríos and S. Schlemmer, J. Mol. Spectrosc., 2017, 332, 67–78 CrossRef.
- D. A. Jennings, C. Demuynck, M. Banek and K. M. Evenson, unpublished.
- J. Ramanlal and J. Tennyson, Mon. Not. R. Astron. Soc., 2004, 354, 161–168 CrossRef CAS.
- S. Schlemmer, O. Asvany, E. Hugo and D. Gerlich, IAU Symposium 231, 2005, pp. 125–134.
- D. Oepts, A. F. G. van der Meer and P. W. van Amersfoort, Infrared Phys. Technol., 1995, 36, 297–308 CrossRef CAS.
- S. C. Foster, A. R. W. McKellar, I. R. Peterkin, J. K. G. Watson, F. S. Pan, M. W. Crofton, R. S. Altman and T. Oka, J. Chem. Phys., 1986, 84, 91–99 CrossRef CAS.
- T. Yonezu, F. Matsushima, Y. Moriwaki, K. Takagi and T. Amano, J. Mol. Spectrosc., 2009, 256, 238–241 CrossRef CAS.
- T. Amano, Philos. Trans. R. Soc., A, 2006, 364, 2943–2952 CrossRef CAS PubMed.
- S. Brünken, O. Sipilä, E. T. Chambers, J. Harju, P. Caselli, O. Asvany, C. E. Honingh, T. Kamiński, K. M. Menten, J. Stutzki and S. Schlemmer, Nature, 2014, 516, 219–221 CrossRef PubMed.
- J. Harju, O. Sipila, S. Brňnken, S. Schlemmer, P. Caselli, M. Juvela, K. M. Menten, J. Stutzki, O. Asvany, T. Kamiński, Y. Okada and R. Higgins, Astrophys. J., 2017, 840, 63 CrossRef.
- H. Roberts, E. Herbst and T. J. Millar, Mon. Not. R. Astron. Soc., 2002, 336, 283–290 CrossRef CAS.
- D. Smith, N. Adams and E. Alge, Astrophys. J., 1982, 263, 123–129 CrossRef CAS.
- M. Töpfer, P. Jusko, S. Schlemmer and O. Asvany, Astron. Astrophys., 2016, 593, L11 CrossRef.
- R. H. Page, Y. R. Shen and Y. T. Lee, J. Chem. Phys., 1988, 88, 5362–5376 CrossRef CAS.
- M. Guidi, U. J. Lorenz, G. Papadopoulos, O. V. Boyarkin and T. R. Rizzo, J. Phys. Chem. A, 2009, 113, 797–799 CrossRef CAS PubMed.
- S. Gärtner, J. Krieg, A. Klemann, O. Asvany, S. Brünken and S. Schlemmer, J. Phys. Chem. A, 2013, 117, 9975–9984 CrossRef PubMed.
- P. Jusko, M. Töpfer, H. S. P. Müller, P. N. Ghosh, S. Schlemmer and O. Asvany, J. Mol. Spectrosc., 2017, 332, 33–37 CrossRef CAS.
- O. Asvany, E. Hugo, F. Müller, F. Kühnemann, S. Schiller, J. Tennyson and S. Schlemmer, J. Chem. Phys., 2007, 127, 154317 CrossRef PubMed.
- T. Amano and J. K. G. Watson, J. Chem. Phys., 1984, 81, 2869–2871 CrossRef CAS.
- P. Jusko, O. Asvany, A.-C. Wallerstein, S. Brünken and S. Schlemmer, Phys. Rev. Lett., 2014, 112, 253005 CrossRef PubMed.
- F. Matsushima, T. Yonezu, T. Okabe, K. Tomaru and Y. Moriwaki, J. Mol. Spectrosc., 2006, 235, 261–264 CrossRef CAS.
- O. Asvany, S. Thorwirth, B. Redlich and S. Schlemmer, J. Mol. Spectrosc., 2018, 347, 1–6 CrossRef CAS.
- M. Rösslein, M. F. Jagod, C. M. Gabrys and T. Oka, Astrophys. J., 1991, 382, L51–L53 CrossRef.
- Y.-S. Wang, C.-H. Tsai, Y. T. Lee, H.-C. Chang, J. C. Jiang, O. Asvany, S. Schlemmer and D. Gerlich, J. Phys. Chem. A, 2003, 107, 4217–4225 CrossRef CAS.
- S. A. Nizkorodov, M. Meuwly, J. P. Maier, O. Dopfer and E. J. Bieske, J. Chem. Phys., 1998, 108, 8964–8975 CrossRef CAS.
- R. V. Olkhov, S. A. Nizkorodov and O. Dopfer, J. Chem. Phys., 1998, 108, 10046–10060 CrossRef CAS.
- O. Dopfer, R. V. Olkhov and J. P. Maier, J. Chem. Phys., 2000, 112, 2176–2186 CrossRef CAS.
- O. Dopfer, N. Solcá, R. V. Olkhov and J. P. Maier, Chem. Phys., 2002, 283, 85–110 CrossRef CAS.
- D. C. McDonald, D. T. Mauney, D. Leicht, J. H. Marks, J. A. Tan, J.-L. Kuo and M. A. Duncan, J. Chem. Phys., 2016, 145, 231101 CrossRef PubMed.
- T. Salomon, M. Töpfer, P. Schreier, S. Schlemmer, H. Kohguchi, L. Surin and O. Asvany, Phys. Chem. Chem. Phys., 2018, 21, 3440 RSC.
- E. Bieske, S. Nizkorodov, F. Bennett and J. Maier, J. Chem. Phys., 1995, 102, 5152–5164 CrossRef CAS.
- S. A. Nizkorodov, J. P. Maier and E. J. Bieske, J. Chem. Phys., 1995, 102, 5570–5571 CrossRef CAS.
- O. Dopfer, D. Roth and J. P. Maier, Chem. Phys. Lett., 1999, 310, 201–208 CrossRef CAS.
- E. Bieske, A. Soliva, A. Friedmann and J. Maier, J. Chem. Phys., 1992, 96, 4035–4036 CrossRef CAS.
- T. Salomon, J. L. Doménech, P. C. Schmid, E. A. Michael, S. Schlemmer and O. Asvany, J. Mol. Spectrosc., 2021, 377, 111421 CrossRef CAS PubMed.
- D. Papp, A. G. Császár, K. Yamanouchi and T. Szidarovszky, J. Chem. Theory Comput., 2018, 14, 1523–1533 CrossRef CAS PubMed.
- O. Asvany, S. Schlemmer, A. van der Avoird, T. Szidarovszky and A. G. Császár, J. Mol. Spectrosc., 2021, 377, 111423 CrossRef CAS.
- O. Asvany, S. Schlemmer, T. Szidarovszky and A. G. Császár, J. Phys. Chem. Lett., 2019, 10, 5325–5330 CrossRef CAS PubMed.
- A. Carrington, D. I. Gammie, A. M. Shaw, S. M. Taylor and J. M. Hutson, Chem. Phys. Lett., 1996, 260, 395–405 CrossRef CAS.
- D. I. Gammie, J. C. Page and A. M. Shaw, J. Chem. Phys., 2002, 116, 6072–6078 CrossRef CAS.
- D. Koner, J. C. San Vicente Veliz, A. van der Avoird and M. Meuwly, Phys. Chem. Chem. Phys., 2019, 21, 24976–24983 RSC.
- S. Brünken, H. Gupta, C. A. Gottlieb, M. C. McCarthy and P. Thaddeus, Astrophys. J., 2007, 664, L43–L46 CrossRef.
- R. Otto, A. von Zastrow, T. Best and R. Wester, Phys. Chem. Chem. Phys., 2013, 15, 612–618 RSC.
- S. Lee, D. Hauser, O. Lakhmanskaya, S. Spieler, E. S. Endres, K. Geistlinger, S. S. Kumar and R. Wester, Phys. Rev. A, 2016, 93, 032513 CrossRef.
- F. Goldfarb, C. Drag, W. Chaibi, S. Kröger, C. Blondel and C. Delsart, J. Chem. Phys., 2005, 122, 014308 CrossRef PubMed.
- G. Cazzoli and C. Puzzarini, Astrophys. J., Lett., 2006, 648, L79–L81 CrossRef CAS.
- C. M. Persson, M. Hajigholi, G. E. Hassel, A. O. H. Olofsson, J. H. Black, E. Herbst, H. S. P. Müller, J. Cernicharo, E. S. Wirström, M. Olberg, Å. Hjalmarson, D. C. Lis, H. M. Cuppen, M. Gerin and K. M. Menten, Astron. Astrophys., 2014, 567, A130 CrossRef.
- O. Lakhmanskaya, M. Simpson, S. Murauer, M. Nötzold, E. Endres, V. Kokoouline and R. Wester, Phys. Rev. Lett., 2018, 120, 253003 CrossRef CAS PubMed.
- O. Lakhmanskaya, M. Simpson, S. Murauer, V. Kokoouline and R. Wester, J. Chem. Phys., 2018, 149, 104302 CrossRef PubMed.
- M. Okumura, L. I. Yeh, J. D. Myers and Y. T. Lee, J. Phys. Chem., 1990, 94, 3416–3427 CrossRef CAS.
- A. M. Ricks, G. E. Douberly, P. V. R. Schleyer and M. A. Duncan, J. Chem. Phys., 2010, 132, 051101 CrossRef PubMed.
- M. Z. Kamrath, R. A. Relph, T. L. Guasco, C. M. Leavitt and M. A. Johnson, Int. J. Mass Spectrom., 2011, 300, 91–98 CrossRef CAS.
- E. J. Bieske, A. Soliva, M. A. Welker and J. P. Maier, J. Chem. Phys., 1990, 93, 4477–4478 CrossRef CAS.
- S. Brünken, L. Kluge, A. Stoffels, O. Asvany and S. Schlemmer, Astrophys. J., Lett., 2014, 783, L4 CrossRef.
- S. Yu, B. J. Drouin, J. C. Pearson and T. Amano, J. Mol. Spectrosc., 2018, 350, 30–36 CrossRef CAS.
- T. Amano, Astrophys. J., Lett., 2010, 716, L1–L3 CrossRef CAS.
- J. Pety, P. Gratier, V. Guzmán, E. Roueff, M. Gerin, J. R. Goicoechea, S. Bardeau, A. Sievers, F. Le Petit, J. Le Bourlot, A. Belloche and D. Talbi, Astron. Astrophys., 2012, 548, A68 CrossRef.
- B. A. McGuire, P. B. Carroll, R. A. Loomis, G. A. Blake, J. M. Hollis, F. J. Lovas, P. R. Jewell and A. J. Remijan, Astrophys. J., 2013, 774, 56 CrossRef CAS.
- A. Stoffels, L. Kluge, S. Schlemmer and S. Brünken, Astron. Astrophys., 2016, 593, A56 CrossRef.
- J. L. Doménech, S. Schlemmer and O. Asvany, Astrophys. J., 2017, 849, 60 CrossRef PubMed.
- J. L. Doménech, S. Schlemmer and O. Asvany, Astrophys. J., 2018, 866, 158 CrossRef PubMed.
- S. Thorwirth, P. Schreier, T. Salomon, S. Schlemmer and O. Asvany, Astrophys. J. Lett., 2019, 882, L6 CrossRef CAS.
- P. C. Schmid, S. Thorwirth, C. P. Endres, M. Töpfer, Á. Sánchez-Monge, A. Schwörer, P. Schilke, S. Schlemmer and O. Asvany, Front. Astron. Space Sci., 2021, submitted Search PubMed.
- O. Asvany, C. R. Markus, A. Roucou, S. Schlemmer, S. Thorwirth and C. Lauzin, J. Mol. Spectrosc., 2021, 378, 111447 CrossRef CAS.
- O. Asvany, C. R. Markus, K. Nagamori, H. Kohguchi, J. Furuta, K. Kobayashi, P. C. Schmid, S. Schlemmer and S. Thorwirth, Astrophys. J., 2021, 910, 15 CrossRef CAS.
- F. Grandinetti, Int. J. Mass Spectrom., 2004, 237, 243–267 CrossRef CAS.
- O. Asvany, C. R. Markus, T. Salomon, P. C. Schmid, S. Banhatti, S. Brünken, F. Lipparini, J. Gauss and S. Schlemmer, J. Mol. Struct., 2020, 1214, 128023 CrossRef CAS.
- S. Alighanbari, M. G. Hansen, V. I. Korobov and S. Schiller, Nat. Phys., 2018, 14, 555–559 Search PubMed.
- P. O. Schmidt, T. Rosenband, C. Langer, W. M. Itano, J. C. Bergquist and D. J. Wineland, Science, 2005, 309, 749–752 CrossRef CAS PubMed.
- D. Bakalov, V. I. Korobov and S. Schiller, Phys. Rev. Lett., 2006, 97, 243001 CrossRef PubMed.
- B. Roth, J. C. J. Koelemeij, H. Daerr and S. Schiller, Phys. Rev. A: At., Mol., Opt. Phys., 2006, 74, 040501 CrossRef.
- J. Shen, A. Borodin, M. Hansen and S. Schiller, Phys. Rev. A: At., Mol., Opt. Phys., 2012, 85, 032519 CrossRef.
- I. V. Kortunov, S. Alighanbari, M. G. Hansen, G. S. Giri, V. I. Korobov and S. Schiller, Nat. Phys., 2021, 17, 569–573 Search PubMed.
- S. Alighanbari, G. S. Giri, F. L. Constantin, V. I. Korobov and S. Schiller, Nature, 2020, 581, 152–158 CrossRef CAS PubMed.
- C.-W. Chou, C. Kurz, D. B. Hume, P. N. Plessow, D. R. Leibrandt and D. Leibfried, Nature, 2017, 545, 203–207 CrossRef CAS PubMed.
- C. W. Chou, A. L. Collopy, C. Kurz, Y. Lin, M. E. Harding, P. N. Plessow, T. Fortier, S. Diddams, D. Leibfried and D. R. Leibrandt, Science, 2020, 367, 1458–1461 CrossRef CAS PubMed.
- O. Asvany, P. Kumar, P. B. Redlich, I. Hegemann, S. Schlemmer and D. Marx, Science, 2005, 309, 1219–1222 CrossRef CAS PubMed.
- O. Asvany, J. Krieg and S. Schlemmer, Rev. Sci. Instr., 2012, 83, 093110 CrossRef PubMed.
- H. Schmiedt, P. Jensen and S. Schlemmer, Phys. Rev. Lett., 2016, 117, 223002 CrossRef PubMed.
| This journal is © the Owner Societies 2021 |

