 Open Access Article
Screening semiconducting polymers to discover design principles for tuning charge carrier mobility†
Rex
Manurung
 and
Alessandro
Troisi
 *
*
Department of Chemistry, University of Liverpool, Crown St, Liverpool L69 7ZD, UK. E-mail: a.troisi@liverpool.ac.uk
First published on 5th September 2022
Abstract
We employ a rapid method for computing the electronic structure and orbital localization characteristics for a sample of 36 different polymer backbone structures. This relatively large sample derived from recent literature is used to identify the features of the monomer sequence that lead to greater charge delocalization and, potentially, greater charge mobility. Two characteristics contributing in equal measure to large localization length are the reduced variation of the coupling between adjacent monomers due to conformational fluctuations and the presence of just two monomers in the structural repeating units. For such polymers a greater mismatch between the HOMO orbitals of the fragments and, surprisingly, a smaller coupling between them is shown to favour greater delocalization of the orbitals. The underlying physical reasons for such observations are discussed and explicit and constructive design rules are proposed.
1. Introduction
Semiconducting conjugated polymers have a modular structure where the electronic properties are largely determined by the sequence of monomers for the individual polymer chains in the bulk material. The possibility thus exists to tune the properties of the polymer through finding optimal monomers for the desired properties. Conjugated polymers have been explored for use in flexible electronics,1 with their incorporation demonstrated in devices including field effect transistors,2 photovoltaic devices3 and light emitting diodes4 for which a desirable property is higher charge carrier mobility in the polymer material, where a higher mobility increases the sensitivity and conversion efficiency of currents to output in these devices. Examples of currently known high mobility polymers display charge carrier mobilities in the range 0.5–20 cm2 V−1 s−1,5,6 which is comparable to amorphous silicon7 but still significantly behind conventional inorganic materials such as Gallium Arsenide (GaAs)8 and silicon wafers9 that exceed 100 cm2 V−1 s−1. Unlike inorganic conductors that have defined lattice structures for which band-like transport can be observed, conjugated polymers display morphologies ranging from semicrystalline to amorphous. This morphological difference thus precludes band transport throughout conjugated polymer materials and makes it challenging to define a structure property relation for charge mobility.Morphology defines the nature of the charge carrier transport at multiple scales, as the characteristics are sensitive to features at the mesoscopic scale (chain alignments, chain coiling, domains) and those at the molecular level (onsite energies, electronic coupling), thus the type of morphology indicates the route to optimisation of the material properties for transport.10,11 The impact of morphology has been studied using molecular dynamics which can be done with the atomistic details included explicitly,12,13 or with representative models of the polymer chain such done as coarse-graining14 and graph networks15,16 when simulating the bulk material. The features of the morphology are significant in determining the mode of charge carrier transport through different parts of the material; boundaries between crystalline and disordered regions hinder charge due to the absence of states that overlap across both regions17 and trap charges,18 tie chains connecting between ordered aggregates are important in improving transport by providing states that access both ordered and disordered regions,10,19 and the different types of aggregates that can form20 can lead to increased mobility due to improved interchain overlap between MOs on monomers.21 Earlier examples of conjugated polymers studied, such as PBTTT, feature semicrystalline morphologies, in which there are discernible domains of ordered, lamellar and interdigitated chains separated by amorphous region boundaries.22,23 The picture from these materials favours the idea of polymer backbones which maintain longer range order throughout the material, and charge carrier transport that is delocalised along chains while in the domains with hopping transport through amorphous regions between the ordered domains.17,24 However, the best performing polymers currently are donor–acceptor copolymers, such as IDT-BT, which show a higher proportion of bulk material as amorphous regions with scattered aggregated domains of ordered chains and have no apparent long-range order.25 The charge carrier transport in this mostly amorphous morphology is facilitated by tie chains traversing between the ordered aggregates which can maintain a relatively ordered backbone, thus precluding the need for long range order throughout the material.26 We consider in this work only polymers without semicrystalline domains for which there are good indications that the transport is dominated by single chain properties and it is possible to obtain information on their charge transport characteristics without explicit modelling of their local structure. Consideration of only a single chain picture is supported by previous observations in increased conductivity of chains on stretching,27 which suggests a stronger influence on the charge carrier lifetime along a single chain compared to the interchain hopping time, and higher mobilities observed in polymers displaying high disorder, lower density and non-interdigitated side chain morphologies where intrachain transport is expected to be the main contributor to carrier mobility.28 Previous modelling of charge carrier diffusion in coarse grained chains with different persistence length shows that the intra-chain transport is more important for relatively rigid chains.29 The electronic density of states of bulk amorphous polymers is largely determined by the electronic structure of the ensemble of single chains constituting the polymer because of the weak electronic interaction between the chains.30
The morphology in amorphous conjugated polymers results in disrupted coupling between monomers, weak enough to result in localisation of charge carrier states. From this, electronic disorder arises as the conjugation between the monomer subunits is disrupted which causes a spread of energies in the charge carrier states, known as Anderson localisation.31–33 Charge carriers are modelled as polarons formed from the charge and the nuclear reorganisation of the surrounding molecular structure, and displacements of the polaron across the polymer chain are thermally activated.34 Transport is disordered polymers is widely modelled using the Gaussian Disorder Model (GDM),35 in which transport occurs via hopping transitions between localised states on chain segments in the material, formed from the frontier molecular orbitals (MOs) that form the valence (HOMO) and conduction (LUMO) bands.36,37 The states accessible to charge carriers can be characterised through calculating the density of states (DOS) for the bulk polymer material, which reflects the localisation of the charge carriers with respect to energy. For disordered organic semiconductors, the DOS is computed using a Gaussian function of standard deviation σ.38 An important feature of the DOS is the distribution of states near the edge of the bands, specifically the width of the DOS tail; for example, torsional disorder the polymer chain can hinder charges through forming trap states, which appear at the tail of DOS bands.39,40 For p-type semiconductors, the tail states at the valence band edge are highly localised in energy and have spacing much less than the thermal energy, making them thermally accessible to charge carriers.41 The significance of the tail state distribution width and slope of the band tail has been confirmed by multiple experimental studies, where a narrower width corresponds to lower energetic disorder along the polymer backbone and higher mobilities.28,42,43 Additionally, narrower bands in the DOS is a characteristic that could indicate higher mobility as it places charge carriers closer to the vicinity of the more delocalised states at the band edge.44 The DOS thus provides us with a “checklist” of target features with which we can correlate atomistic features and its features which indicate high charge carrier mobility.
The design of polymer backbones can be approached through tuning the torsional disorder and electronic disorder, where both can and not necessarily be concomitant. Torsional disorder can be tuned by engineering side chain interactions to lock dihedral angles and planarising the π-conjugated core of the monomers, with the view that this concomitantly reduces electronic disorder. For side chains, an extensively researched approach is side chain functionalisation with heteroatoms to introduce non-covalent interactions that soft lock the dihedral angle between the plane of monomers.45 These non-covalent interactions include known hydrogen bonding interactions O–H and N–H, but also N–S, O–S and the corresponding halogen based X–H and X–S interactions, with the participating heteroatoms either as side groups or embedded in the conjugated backbone.46,47 As a result of altering the backbone planarity via this approach, such interactions allow for tuning of the aggregate domain sizes, their crystallinity and thus morphology to achieve better mobility.48,49 An additional benefit to heteroatom non-covalent interactions is the ability to tune the electronic properties, where such interactions have been shown to narrow HOMO–LUMO bandgaps which facilitates charge transfer between affected monomeric units.50 Another feature to tune in the polymer backbone is the monomer size, where the perspective is mixed. Increasing the monomer length can increase number of interchain contacts and thus connectivity for charge carrier hopping,51 but at the cost of increasing the distance between atoms on the backbone periphery which can participate in non-covalent interactions, resulting in less torsional rigidity.52 A contrary view to designing torsional rigidity is instead to make the coupling between monomers along backbones tolerant to non-planarity,53 where a possible route is to exploit overlap between π-MOs and n-lone pairs from peripheral groups on the monomer backbone.54 Higher mobility has also been attributed to polymer backbones which can stabilise the charge carrier polaron, where localisation of the polaron to a smaller segment on polymer chains gives an energetically narrow distribution of states that the charge carrier can occupy and allows the chain to host more charge carriers on the chain.55,56 The sequence of monomers is significant for the electronic coupling features of the polymer. An important result from phenomenological modelling reveals the importance of the sequence architecture for donor acceptor (DA) copolymers, showing that overall perfectly alternating (AB type sequences) DA sequences and block copolymers with closer to uniform block lengths exhibit better predicted mobilities than more randomised DA sequences, and the influence of the energy gap between charge carrier states on mobility.57 For the latter, however, there are contrasting views on whether the energy gap between MOs on adjacent monomers should be large or small, with large gaps suggested to be unfavourable as they result in localisation and thus trapping of the charge carrier,58 while other work suggests a preference for large gaps due to narrowing of bands which makes charge carrier states more accessible.44,57 It has also been proposed that influence of tuning MO energy differences is diminished or enhanced depending on whether the hopping occurs across an energetically localised or delocalised bands.57 The current work for polymer backbone design reveals some consistent principles across several examples but this has still yielded a variety of monomer structures, sequence architectures and moieties thus indicating an overall consensus on structure property relation is still lacking.6
An overarching issue with some of the above examples of design strategies is that they quote results for specific polymers and interactions, thus precluding a definite general structure property relation. The available evidence suggests that polymers can thus be screened by their electronic properties in the width of the tail state distribution of the valence band tail, or the localisation of the chain MO states at the band edge. In previous work,59 we demonstrated a method for the rapid calculation of the polymer electronic structure including DOS and localization characteristics for 5 polymers, taking into account the conformational space sampled by the polymer chain. To understand what chemical features promote greater charge delocalization at the valence band edge (or, equivalently, steeper band edge and reduced disorder), it would be desirable to consider a much broader sample. In this paper, we perform a screening type study with a large sample of 36 semiconducting conjugated polymers obtained from the literature. Using this realistic set, it will be possible to establish the chemical composition and the underlying physical reasons that promote greater charge delocalization and charge mobility. This study will be employed to derive explicit and constructive design rules.
2. Methods and dataset
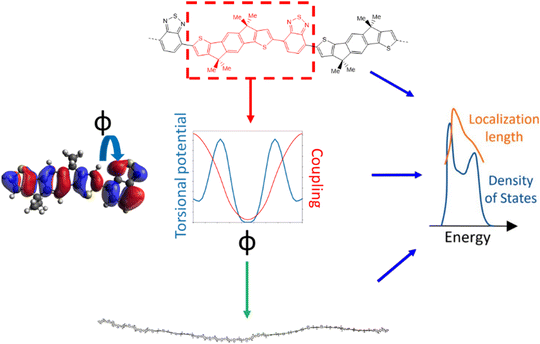
The approach followed in this paper, outlined in Fig. 1, can be divided into 4 main parts. First, we compile a list of polymers reported in literature which represents a good sample of the current chemical state-of-the-art for p-type semiconducting conjugated polymers. For these polymers we identify the adjacent monomer pairs from their structural repeating units (SRUs) and compute the relevant electronic coupling and torsional potentials for the dimers of these monomer pairs as a function of the intermonomer dihedral angle ϕ. These data are then used to generate polymer chain conformations for calculating the average electronic structure, used to obtain the density of states (DOS) and localisation length. As the last two properties are related to the charge carrier mobility is possible to deduce the features of monomer sequences that promote larger mobility.2.1 Polymer sample
The polymer sample we choose for our study is shown in Fig. 2, based on structures compiled from tables in a recent review,6 with the addition of novel structural repeating units (SRUs) from collaborators with one monomer, C5C6, derived from a reported non-fullerene acceptor.60 From these sources, we selected polymer backbones from only the p-type and ambipolar type polymers on which to base the SRUs included in our sample. We obtained the SRUs from those of the original polymers in ref. 26 but removing or replacing the larger side chains (2+ carbon atoms) with a methyl group (when connected to spiro-carbon atoms) or hydrogen atoms (in all other cases) as shown in Fig. 2.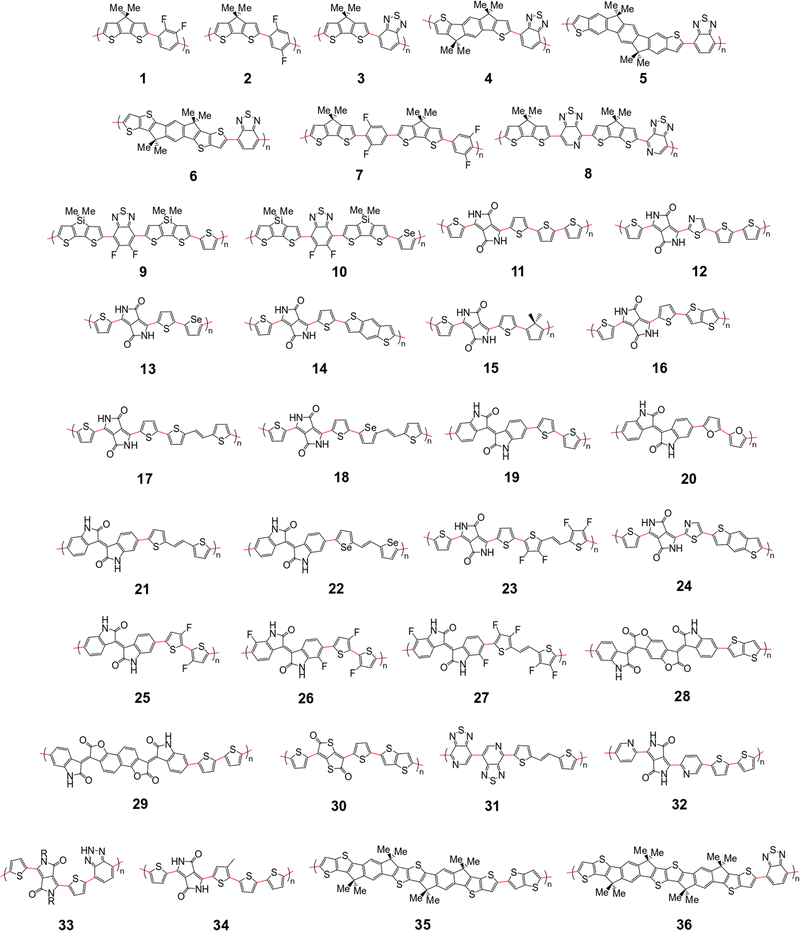 | ||
| Fig. 2 Structural repeating units (SRUs) based on polymers selected from ref.6 and from collaborators in this work. The red bonds denote connections between individual monomers in the polymer chain. | ||
The pool of monomers used to build the SRUs in Fig. 2 and their corresponding name labels are shown in Fig. 3. Each monomer has 2 connection site atoms on which other monomers can bond to. Connection site atoms which are chemically identical in environment are coloured with a black circle, while chemically inequivalent connection sites are instead denoted by a red or blue circle. For those monomers with non-identical connection sites, we assign a label in the SRU sequence to its name label to indicate how the connection sites are bonded, shown in Fig. 3; [A] if the blue circle connection site atom is bonded to the monomer left of it in the sequence and [B] for the alternative orientation with the red circle connection site, and monomers at the start of the sequence are labelled with [A] or [B] according to which of the aforementioned connection sites is bonded to the second monomer in the SRU sequence.
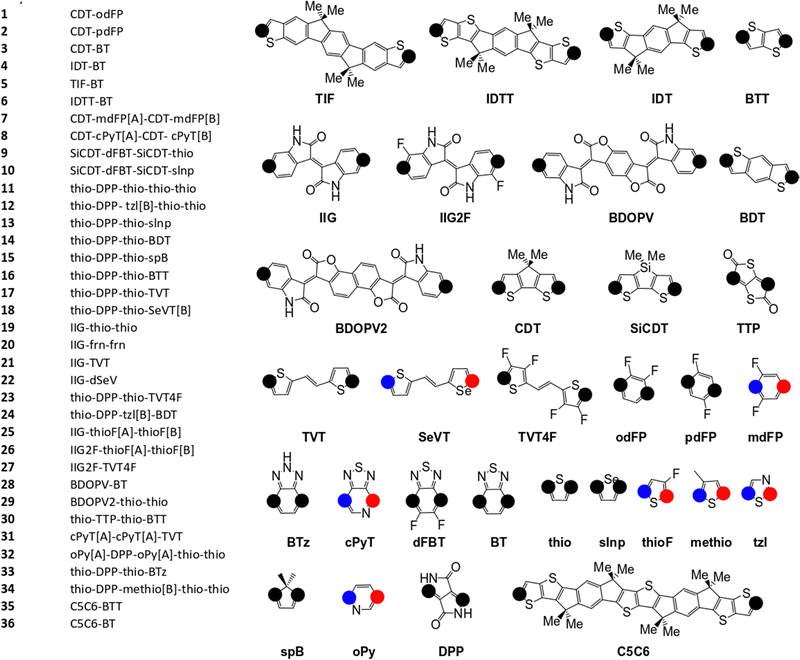 | ||
| Fig. 3 Monomers and list of monomer sequences for the polymer SRUs in Fig. 2. The black circles on each monomer denote the connection sites, while the blue and red coloured circles denote non-equivalent connection sites. | ||
2.2 Electronic structure calculation for simulated bulk polymer chains
For each unique polymer in Fig. 2, we calculate the averaged electronic structure in two independent steps; we first generate several polymer chain conformations and then calculate the electronic structure for each polymer chain using the localised molecular orbital method (LMOM)62 for which we followed the implementation detailed in ref. 59.A polymer chain conformation, given a sequence of rigid monomers, is defined by the sequence of dihedral angles ϕ between the pairs of adjacent monomers in the chain. The latter is generated by selecting the dihedral angles ϕ in the chain with Boltzmann sampling using the torsional potential energies where the absolute system temperature T is set at 300 K. The torsional potentials of each adjacent monomer pair are considered independent of each other and calculated for dimers of each adjacent monomer pair that appear in our polymers at the B3LYP/6-311G+** level. This method for obtaining the coupling explicitly for each ϕ is necessary as there are several orbital couplings which contribute to the overall electronic structure, where the coupling between different MOs is correlated and thus cannot be considered independent for each MO pair. For the polymer chain conformations, we generate 100 conformations of polymer chains containing 48 monomers (or 50 if the repeating units had 5 monomers), and there is no further relaxation of the conformations once generated. Additional details on this component of the calculation are given in ESI,† S1. We generate the explicit polymer conformations for calculating the localisation length, described in the subsequent Section 2.3, which requires the atomic coordinates of the polymer chains and calibration calculations for improving the energies from our approximate method described in our previous work ref. 59. Using explicit chain conformations thus allows us to obtain the localisation length in realistic molecular scale dimensions.
For the electronic structure calculation, we use LMOM which requires the onsite energies of the monomer MOs included in the basis set and transfer integral (coupling) matrices for the dimers of adjacent monomer pairs contained in our polymers. The basis set for our calculations is the full set of π-MOs from each monomer, with the exception of the oPy monomer which has a σ-symmetry HOMO also included and discussed in ESI,† S2 Fig. S5. The transfer integral matrices are obtained by transforming the atomic basis Fock and overlap matrices FA and SA using molecular orbital coefficients calculated for the monomers expressed in the LMO basis. The molecular orbital coefficients Cki, where the subscript indexes denote the ith MO on the kth monomer, are calculated for a rigid monomer in the relative geometry they would occupy in the dimer. Cki is truncated such that it is the same size in coefficients as the number basis functions that exist in the dimer with atomic basis matrices FA and SA. The transformation from atomic to LMO basis is given for the Fock and overlap matrices in (1) and (2), respectively, where FLMOki,jl and SLMOki,jl are the LMO basis elements thus obtained.
| FLMOki,jl = CTkiFACjl | (1) |
| SLMOki,jl = CTkiSACjl | (2) |
As will be discussed below, there are two descriptors of the coupling between consecutive monomers that are particularly important; the mean average coupling magnitude 〈|Ji,i+1|〉 between HOMO orbitals localized on consecutive monomer i and i + 1 and the standard deviation of such matrix elements σi,i+1 due to the conformations explored by the chains which we will refer to as the fluctuation of the (HOMO–HOMO) coupling. We further define a relative coupling fluctuation σreli,i+1 = σi,i+1/〈|Jil|〉.
2.3 Characterising the electronic structure of polymers
We aim to discover structure property relationships for the charge carrier mobility, thus it is ideal to characterise the potential charge transport properties with measures that result directly from parameters corresponding to molecular features, such as the MO coupling and torsional potentials. Previously it was shown how the width of the tail state distribution in the DOS, which measures the electronic disorder in the material, correlated with measured charge carrier mobilities42 and that delocalised states facilitate higher currents of charge carrier transport.41,44 Thus, a measure of the tail state distribution width in the DOS and delocalisation of MOs involved in charge carrier transport provide ways to infer the charge carrier mobility from characterisation of the electronic structure. For our polymers, we use the localisation length and tail slope at the band edge, both of which are determined by the density of states for the bulk polymer, to measure the relative charge carrier mobilities of our polymers by proxy. The density of states (DOS) f(E) is computed as where g(E − Em) is the normalised Gaussian function centred at energy E (data are reported with broadening width 0.016 eV) and Em is the energy of the molecular orbital (MOs) on the polymer chains from the bulk sample.
The localisation length measures the delocalisation of the polymer chain MOs and is first calculated for each chain MO in individual chains, then averaged over the energy range of the MOs to obtain the localisation length for the bulk polymer sample. The localisation length of orbital m on a single polymer chain, LL(m), is calculated as  where rk is the centre of mass of the kth monomer, P(m)k is the population of the mth orbital on the kth monomer and
  the “centre of mass” of the orbital.59 To obtain an overall measure of the localisation length for the bulk polymer chain MOs we average LL(m) over the whole sample of polymer chains, thus averaging over all the conformations, by calculating the energy-dependent localisation length LL(E) in (3).
 | (3) |
The band edge of the polymer EEDGE is defined as the point of inflection along the uppermost edge of the DOS and the tail slope is the gradient of the DOS at EEDGE (= df(E = EEDGE)/dE), the calculation details for which are outlined in ESI,† S1. The localisation length we compare across the polymers is also the one at EEDGE, denoted LL(EEDGE). Both the localisation length and tail slope indicate the level of electronic disorder in the polymer chain; a high localisation length means more delocalised MOs along the polymer chains and a steeper tail slope df(E = EEDGE)/dE corresponds to an electronically more ordered polymer. One important consideration is finite size effects associated with the defined chain length relative to the localisation length, where such effects would not be relevant in the case where the latter is much less than the former. In ESI,† S2 we confirm this is the case showing that the approximate contour length of each polymer chain when the number of monomers is 48 or 50 is at least 4 times longer than LL(EEDGE) for the polymers.
3. Results
3.1 Localisation length as proxy property of charge carrier mobility
The localisation length at the band edge and width of the tail state distribution in the DOS have been shown theoretically and found experimentally to be closely correlated with charge carrier mobility.42,44 Thus, we can use either the localisation length or tail slope at the band edge EEDGE, our measure of the tail state distribution width in the DOS, can be used as proxy properties of the charge carrier mobility, which enables comparison across materials without directly modelling charge carrier transport. This approximation is valid as long as the mobility remains limited by static electronic disorder. Cases where this approach would not be valid include (i) a situation with no appreciable disorder (where a polaronic band is formed) and (ii) a situation where the coupling is so weak that a small polaron localized on each monomer is formed (transport takes place as a sequence of charge hopping events to nearest neighbours). While (i) is highly unlikely and definitely not relevant for the polymers considered here (ii) is highly relevant because one could in principle decrease the coupling along the chain down to a point where the transport is completely suppressed. As indicated in the introduction there is strong experimental evidence that, for this family of polymers, the transport is indeed limited by electronic disorder and that reducing such disorder can be a goal for the chemical design. Furthermore, a charge mobility above ∼0.1 cm2 V−1 s−1 (for the best performing polymers) is completely inconsistent with short range polaron.61In Fig. 4, we plot the magnitude of the tail slope against localisation length at the band edge. We measure the strength of the correlation between these two properties using the Spearman rank order correlation coefficient ρR(X),R(Y) for variables x and y belonging to sets X and Y:
 | (4) |
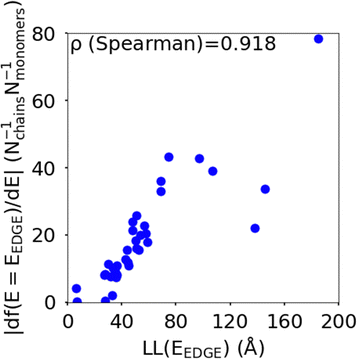 | ||
| Fig. 4 Correlation between the localisation length LL(EEDGE) and magnitude of tail slope (= |df(E = EEDGE)/dE|) at the band edge. | ||
Each element x and y in the datasets for the variables is associated with ranks xr and yr from the set of ranks Xr and Yr, where xr is the rank order of variable x in the set X and yr is the rank order of variable y in the set Y. ρR(X),R(Y) ∈ [−1,1], where negative and positive values indicate monotonically decreasing and increasing relationship between variables x and y, respectively, and the closeness of |ρR(X),R(Y)| to 1 indicates how strong the relationship between the variables is. The value of ρR(X),R(Y) obtained for the localisation length and tail slope, shown in Fig. 4, suggests a strong positive correlation between these two proxy measures of the charge carrier mobility, thus only one of these is necessary for our subsequent analysis. While both the localisation length and tail slope are justifiable choices because being linked to transport models32 and experimental measurements,30 respectively, for the rest of the paper we choose to only use localisation length at the band edge as our preferred proxy property for charge carrier mobility.
3.2 Main trends
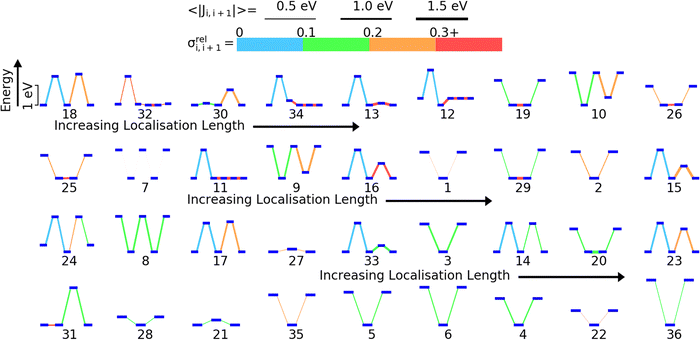
We have previously shown that for 5 model polymers the DOS and localisation length at the band edge were predominantly influenced by the relative position of the HOMO energy levels of the monomers and fluctuations in the coupling between the HOMOs on adjacent monomers along the polymer SRU.59 The localization length at the band edge is likely determined by the sequence of on-site energy, the strength of the HOMO–HOMO coupling and the fluctuation of this coupling. To visualize all these features in a single diagram and guide the analysis we have ordered in Fig. 5 the 36 polymers in order of the lowest (polymer 18) to highest LL(EEDGE) (polymer 36). For each polymer we show the energy level diagram of the HOMO orbitals on each monomer of the sequence, where larger vertical separation between the HOMO levels corresponds to larger energy separation. The lines connecting the orbital level indicates the strength of the coupling (thicker lines have larger average coupling 〈|Ji,i+1|〉) and the relative fluctuation of such coupling σreli,i+1 (using the colour code given in Fig. 4).We identify three key trends from Fig. 5. The first is that A–B type polymers (2 monomers only in the structural repeating unit) appears to have higher localisation length than non A–B type polymers (the 8 polymers with highest localization length contains 2 monomers in the structural repeating unit). Second, the localisation length appears to be affected by the size of the difference in HOMO energies on adjacent monomers along the polymer SRU; in A–B type polymers, a higher difference in HOMO energy appears give higher localisation length. Lastly, there appears to be tendency to have lower fluctuation in the coupling for individual monomer pairs in the polymers on the higher end of localisation length and strong coupling fluctuation between at least one pair of consecutive monomers for low localization length polymers. We will examine the correlations between localisation length and properties of the polymers in the subsequent sections.
To rationalize the results is it useful to consider a limited number of parameters of the model. In particular, we have found very convenient to consider the energy and coupling fluctuation of only the localized HOMO on each fragment, an approach that appears to be generally well-justified. In Fig. 6 we compare LL(EEDGE) computed with the complete starting basis set and for models which only include the HOMO localized on each monomer. The two results are well correlated, and, in the majority of cases, one can attribute the difference in localization length only to features of the HOMO orbitals. The few exceptions, discussed in Section S3 of the ESI,† are easy to explain and can be anticipated from the shape of the HOMO containing very diffuse orbitals (for Se containing monomers in polymers 18 and 22) or negligible coupling between neighbouring HOMO orbitals due to the presence of nodal planes (polymer 7). We also note in Fig. 6 the point for polymer 32, where the apparent low deviation between the results obtained using the complete and HOMO only basis set result from Sigma-symmetry in the oPy HOMO, outlined in Section S3 of ESI,† which results in low LL(EEDGE) regardless of the basis set. Finally, the two data points where LL(EEDGE) increases the most with including all orbitals are also the two outliers in Fig. 4; that is, multi-orbital effects explain the lack of perfect correlation between and DOS tail.
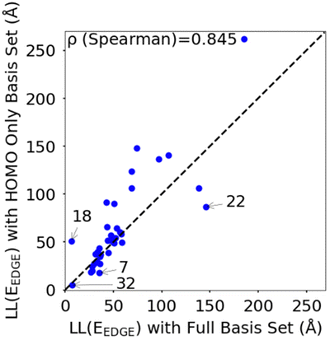 | ||
| Fig. 6 Correlation between localisation length obtained with complete starting basis set and reduced HOMO only basis set. | ||
3.3 Polymer structural features and localisation length
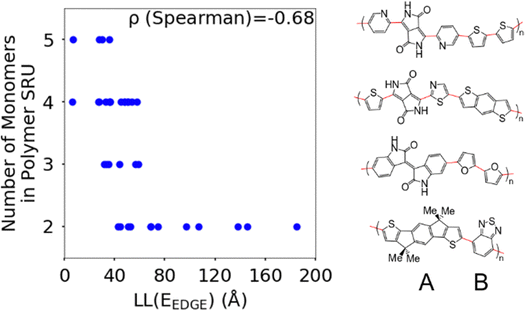
The first polymer structural feature we discuss is the number of chemically unique monomers in the polymer structural repeating unit. While these are not included in our polymer sample to begin with, polymers with only one monomer in the structural repeating unit (homopolymers), such as polythiophene, were already found in our previous work59 to show worse DOS and localisation features donor–acceptor copolymers which have 2 or more different monomers. The correlation in Fig. 7 clearly shows that having only 2 unique monomers in the structural repeating unit is optimal, as it increases the likelihood of large localization length, although the range of localization lengths seen in polymers with 2 repeating units is very large. In Section 3.4 below we show that the geometric average of all coupling fluctuations between all adjacent monomers correlates negatively with the decrease of the localization length. Polymers containing only 2 monomers in the repeating unit are expected to display the largest distribution of localization lengths (because there is only one element in the average) and, consequently, the maximum likelihood of particularly large localization length.Another feature which is noticeably varied amongst reported polymers taken for our study sample is the size of the monomers in the polymer chain. To measure the combined size of the monomers for each polymer SRU we use the polymer SRU length, shown in Fig. 8, which is measured as the sum of distances between the connection sites on each monomer and bonds between the sites connecting each monomer in the structural repeating unit. We find no clear correlation between the polymer structural repeating unit length and the localisation length, shown in Fig. 8.
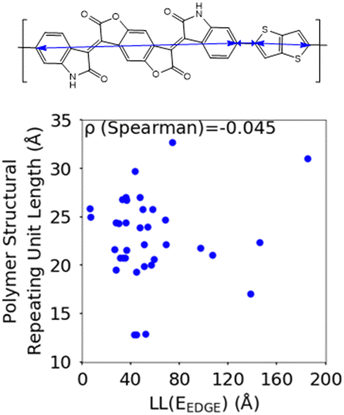 | ||
| Fig. 8 Correlation between the localisation length at band edge and polymer structural repeating unit length (bottom) defined as the sum of the length of each monomer. | ||
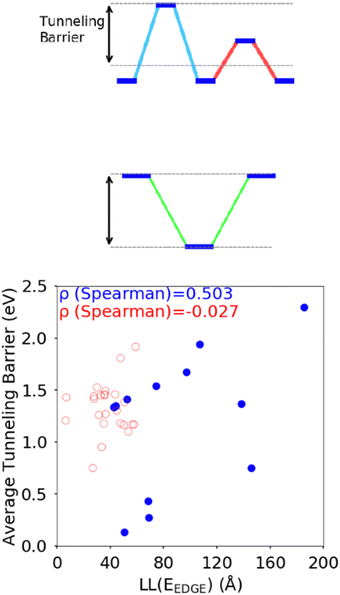
The difference between the HOMO energy levels of adjacent monomers in the polymer chain, noted in Section 3.2, appears to be another feature influencing the localisation length. To accommodate analysis of both A–B and non A–B type polymers, we consider the correlation of the localisation length with the average tunnelling barrier for the hole, defined as the difference between the highest energy HOMO along the polymer SRU and the mean average of all the other HOMO energies on the monomers in the SRU, shown in Fig. 9. The Spearman ρ correlation for the average tunnelling barrier and localisation length was computed to be between −0.099 and 0.836 at the 95% confidence level. The negative lower limit suggests only a moderate correlation, although the observation made in ref. 31 where an increase of the orbital gap between A–B polymers is shown to increase the localization length supports the correlation of the latter with the average tunnelling barrier.44 There is no statistically significant correlation between localization length and tunnelling barrier when there are more than 2 monomers in the SRU, likely because of the many additional parameters that influence this second case.
3.4 Coupling features and localisation length
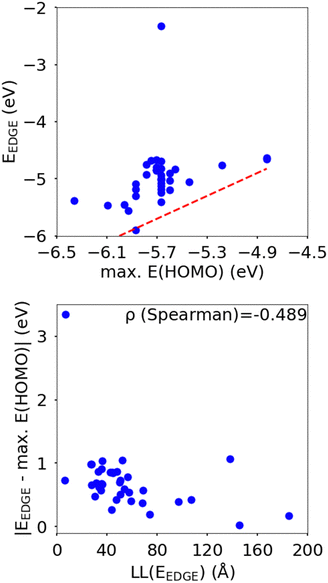
In this section we wish to explore the relation between the strength and fluctuation of the electronic coupling between monomers and the localization length. In all polymers containing a monomer with higher energy HOMO the highest energy orbitals tend to be linear combination of HOMOs localized on such monomers.44 The polymer orbitals deriving from monomers with the highest energy HOMO form a band with bandwidth which becomes larger if the effective coupling between high energy HOMO is larger. The energy difference between the polymer highest occupied band edge EEDGE and the energy of the highest onsite energy HOMO of a monomer, max(E(HOMO)) (Fig. 10) is a global measure of the electronic coupling between highest energy HOMOs or the bandwidth for hole transport. In Fig. 10 right we show that |EEDGE − max(E(HOMO))| is negatively correlated with the localization length (ρ in the range between −0.704 and −0.191 with 95% confidence level); that is, larger bandwidths or stronger couplings are detrimental for transport. This is in line with the expectations outlined in ref. 33 where narrow bands are shown to facilitate transport and is fully in line with the evolution of the research field from the widest band of MEH-PPV62 in the early days of organic electronics to the narrowest band of highest mobility polymers such as those containing the DPP monomer.63The other aspect of coupling we examine is the fluctuation in coupling magnitude, which describes the extent of electronic disorder in the polymer chains. The effective coupling between two localized orbitals coupled through a one-dimensional chain of localized orbitals has been studied extensively in the context of electron transfer theory64 and single molecule electronics.65 According to perturbative theories66 and more advanced techniques67 the effective coupling is proportional to the product of the coupling along the chain Ji,i+1. For small normal fluctuations, the relative fluctuation of the overall coupling is given by  (as encountered in standard error propagation analysis), with the summation extending to all adjacent pairs in the SRU, and we used this simplified and intuitive measure to rationalize the results. Fig. 11 shows that lower combined coupling fluctuation
  is correlated with higher localisation length thus we see that lower electronic disorder along polymer chains is preferred. Such a correlation (ρ in the range −0.807 and −0.411 with 95% confidence level) also explains a key feature of Fig. 7, where the localization length is more narrowly distributed for polymers with more monomers in the SRU because more terms are involved in the summation.
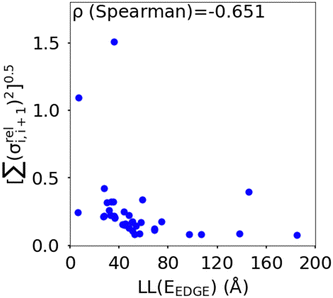 | ||
Fig. 11 Correlation between the localisation length at band edge and combined coupling fluctuation  . . | ||
From the correlations in Fig. 10 and 11 it is apparent that low coupling fluctuation and magnitude are desirable for higher localisation length, which is in line with previously reported examples of work suggesting the importance of minimising electronic disorder to achieve higher charge carrier mobility.28,42 The results, however, provide more than just broad agreement with certain phenomenological models because the data can be used to establish the degree of confidence in following certain design rules such as focusing on 2 monomers per SRU and maximizing the gap between HOMO orbitals in different monomers. However, we do not explicitly rank the importance of each design rule as this is not just dependent on the robustness of the correlation shown with LL(EEDGE) but also related to the facility of implementation in designing new polymers. For example, the design rule of A–B polymer sequences is easily implemented and many of the approximation of our model won’t affect this conclusion, whereas reducing coupling fluctuation requires calculation and its impact is modulated by possible effects of intermolecular interactions.
3.5 Torsional potential features and electronic disorder
While the number of monomer and the energy mismatch between their HOMO level can be easily engineered it is not clear from the data presented so far how can one decrease the coupling fluctuation. Two ideas have been put forward in literature. The first one is that the coupling fluctuation is reduced if the torsional potential favours a mutual geometry of the monomers in which they lie in the same plane as rigidly as possible.45 In agreement with this view, we observe a strong correlation shown in Fig. 12 between LL(EEDGE) and the torsional entropy , which measures the dihedral angles accessible at a given temperature and is related to the Boltzmann probability pi of occupying a certain dihedral angle, at 298.15 K. There is one noticeable outlier point in the plot of Sϕ and σreli,i+1 caused by the dimer DPP-oPy[A] which is discussed in ESI,† S3. In general, Sϕ is minimal in the presence of deep potential energy well in the torsional potential.
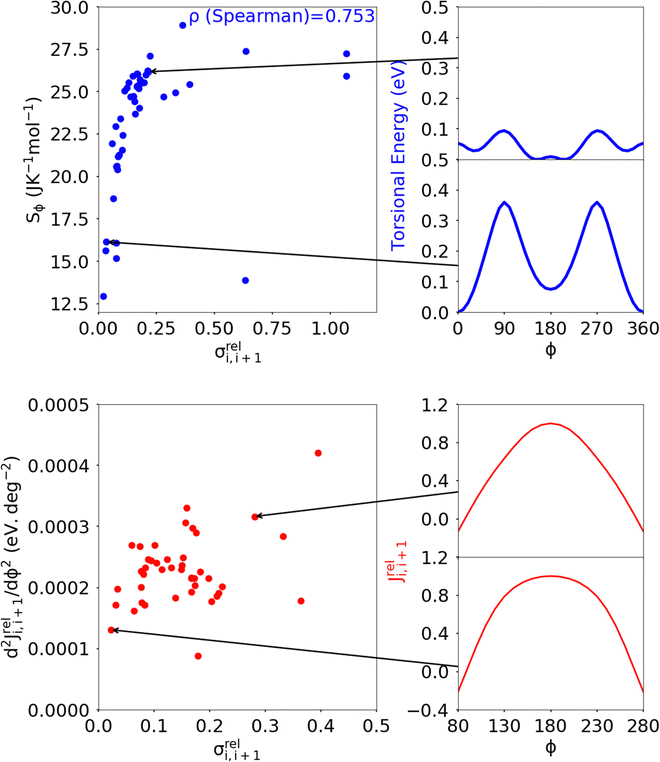 | ||
| Fig. 12 Correlation of the relative coupling fluctuation σreli,i+1, our main measure for electronic disorder, with each the torsional entropy of the dimers (blue) and curvature in the relative coupling profile d2Jreli,i+1(ϕ)/dϕ2 measured at the global minima in the torsional potential for each dimer (red). In the Sϕvs. σreli,i+1 plot, the point for polymer 32 is not shown as it lies significantly above the range covered by points from the other polymers of our sample. The plot for d2Jreli,i+1(ϕ)/dϕ2vs. σreli,i+1 excludes points which deviate significantly from the cluster of points shown, the full plot is included in ESI,† S4 Fig. S9. | ||
A distinct proposal for reducing the coupling fluctuation is to consider monomer pairs for which the HOMO–HOMO coupling is less sensitive to the dihedral angle. It was indeed noticed that in some instances the relative coupling profile Jreli,i+1(ϕ) = Ji,i+1(ϕ)/Ji,i+1(ϕ = 180°) is flatter around ϕ = 0 or 180°, where the first derivative is null by symmetry.54 We thus characterised Jreli,i+1(ϕ) with the curvature, defined as the second derivative d2Jreli,i+1(ϕ)/dϕ2 calculated at the global minimum in the torsional potential of the dimers. While there are some examples of dimers showing varying curvature in Jreli,i+1(ϕ), shown in Fig. 12, overall there is not a strong correlation between d2Jreli,i+1(ϕ)/dϕ2 and σreli,i+1(ϕ) indicating that optimising the curvature is not a viable approach considering the pool of monomer pairs in the dataset considered.
Lastly, we briefly examined the molecular structures of select low and high σreli,i+1 dimers, where the structures of the dimers with the 10 lowest and highest σreli,i+1, respectively, excluding dimers containing the monomer oPy, are shown in Fig. S10 and S11 in ESI,† S5. We notice some common features amongst those lower σreli,i+1 dimers; contiguous fused ring motifs, heteroatoms which can form non-covalent interactions, and monomer dipoles. Of these features, only the presence of contiguous fused ring motifs is mostly absent amongst the higher σreli,i+1 dimers, with several dimers having only small thiophene sized monomers. However, we have not determined these features to be conclusive, for which we leave to future work and is beyond the scope of this paper.
3.6 Further rationalization of the results through a simplified model Hamiltonian
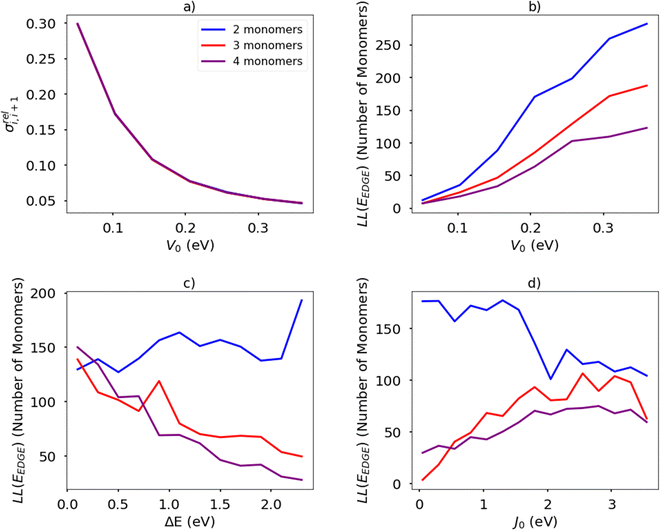
To further verify the explanation of the design rules discussed so far, we have performed calculations on a model Hamiltonian where we could explore more systematically the effect of the different parameters. The model includes only one orbital per site, and 2, 3, or 4 repeating units. The overlap matrix is assumed to be the identity matrix. The continuous parameters of the model are set as follows:– The energy of the orbital in the first repeating unit is set to parameter ΔE controlling the relative orbital energies, while the other repeating units have orbital energy set to zero. ΔE is sampled between 0.1 and 2.3 eV, corresponding to the range of the average tunnelling barrier observed for our polymers, and set to the median of the range ΔE = 1.2 eV when the other parameters are changed.
– The coupling characteristics is controlled by parameter J0 which determines the amplitude of the cosine defining the dependence of the coupling J between adjacent monomers on the relative dihedral angle ϕ where J = 0.5J0![[thin space (1/6-em)]](https://www.rsc.org/images/entities/char_2009.gif) cos(ϕ). J0 is sampled in the range between 0.05 and 3.55 eV, corresponding to the range of amplitudes typically observed in the coupling profiles of our dimers, and is set to the median of the range J0 = 1.8 eV when the other parameters are changed.
cos(ϕ). J0 is sampled in the range between 0.05 and 3.55 eV, corresponding to the range of amplitudes typically observed in the coupling profiles of our dimers, and is set to the median of the range J0 = 1.8 eV when the other parameters are changed.
– The torsional potential is controlled by parameter V0 determining the depth of the minima and assumed to be of the form V = V0 sin2(ϕ). V0 is sampled in the range between 0.05 and 0.36 eV, corresponding to the range of minima depths observed in the torsional potentials of our dimers, and is set to the median of the range V0 = 0.20 eV when the other parameters are changed.
The temperature is fixed at 298.15 K. The relative coupling fluctuation σreli,i+1 is controlled by the parameter V0; as shown in Fig. 13(a). To compute the localisation length LL(EEDGE), we considered the polymer as being a rigid rod with the distance between adjacent monomers being the unit length. The results in Fig. 13(b)–(d) are averages over 100 chains of 1200 monomer-long chains.
The main observations of the first part of the manuscript are reproduced by the results shown in Fig. 13(b). The localization length increases by increasing the rigidity of the chain (i.e. larger V0 and therefore smaller σreli,i+1) and the increase in the number of monomers in structural repeating unit causes a decrease in localization length. The increase of the orbital gap ΔE shown in Fig. 13(c) (in effect analogous to the decrease of the coupling J0 shown in Fig. 13(d)) cause a moderate increase of localization length for polymers with 2 repeat units and a decrease of localization length with polymers with more than 2 monomers in the structural repeat unit. The effect seen for polymers with 2 monomers in the repeat unit was observed with a more realistic Hamiltonian in Fig. 9, while no correlation was observed for larger numbers of monomers in the repeat units probably because of the much greater number of parameters affecting the results of realistic systems in comparison with the idealised model. It is worth noticing in passing, that over the past 40 years the top performing polymers of each decade (PPV, P3HT, PBTTT, DPP-based)4 display a decreasing bandwidth; that is, as a long as the transport remains delocalized, electronic coupling along the chain seems not to be the primary factor determining the charge mobility.
4. Conclusion
In this study, we analysed the electronic structure and charge delocalization characteristics of a large number of polymer models and determined the features that most effectively produce greater charge delocalization and reduced electronic disorder. Given the sample of polymers considered, we were able to identify structure–property relations that can be trusted with an associated degree of statistical significance. Two features are jointly the most important in determining greater localization length: (i) a reduced relative fluctuation of the coupling between localized HOMO orbitals σreli,i+1 and (ii) the presence of only two monomers in the SRU, i.e. a preference for AB type polymer sequences. Less important but also contributing to greater localization length are (iii) a greater difference in the energy of the HOMO orbitals for polymers with SRUs containing only two monomers (AB type polymers) and (iv) an overall smaller coupling between HOMO orbitals localized on adjacent monomers.Our results are in line with previous works in that they considers the electronic disorder as the most significant factor; this appears to be the aim of strategies employed by others such as incorporating more planarized and fused ring monomers,5,68,69 and engineering non-covalent locks in chains to planarize polymer chain backbones and thus minimise backbone torsional disorder.69 However, several polymers reported have a significant number with non AB type sequences, thus our results which suggests a preference for AB type polymer sequence, is not only supported previous theoretical work but observes this preference over a large sample of polymers thus providing an important contribution in verifying the potential of an AB type only approach to sequence design.57 Additionally, our finding that the disorder in the coupling is more significant than its magnitude is contrary to other views on this matter.70 Finally, the opportunity provided by increasing the energy mismatch between the HOMO orbitals in AB type polymers was never directly exploited in materials design.
Most of the derived structure–property relations can be immediately used for the development of new polymers as they concern the monomer sequence (part of synthetic design) and the energy levels of the monomer MOs (normally known). Identifying monomer pairs with reduced fluctuation of the electronic coupling still defies simple intuitive rules but the relevant electronic structure calculations are straightforward and can be employed to explore new chemistries at marginal costs.
Conflicts of interest
The authors declare no competing financial interest.Acknowledgements
The authors thank the Leverhulme Trust for funding this research via the Leverhulme Research Centre for Functional Materials Design. Alessandro Troisi acknowledges the support of ERC (Grant No. 101020369).References
- M. Wang, P. Baek, A. Akbarinejad, D. Barker and J. Travas-Sejdic, J. Mater. Chem. C, 2019, 7, 5534–5552 RSC.
- S. Holliday, J. E. Donaghey and I. McCulloch, Chem. Mater., 2014, 26, 647–663 CrossRef CAS.
- Z. G. Zhang and J. Wang, J. Mater. Chem., 2012, 22, 4178–4187 RSC.
- O. Ostroverkhova, Chem. Rev., 2016, 116, 13279–13412 CrossRef CAS PubMed.
- A. F. Paterson, S. Singh, K. J. Fallon, T. Hodsden, Y. Han, B. C. Schroeder, H. Bronstein, M. Heeney, I. McCulloch and T. D. Anthopoulos, Adv. Mater., 2018, 30, 1801079 CrossRef PubMed.
- M. Kim, S. U. Ryu, S. A. Park, K. Choi, T. Kim, D. Chung and T. Park, Adv. Funct. Mater., 2020, 30, 1904545 CrossRef CAS.
- A. R. Moore, Appl. Phys. Lett., 1977, 31, 762–764 CrossRef CAS.
- M. I. Nathan, W. P. Dumke, K. Wrenner, S. Tiwari, S. L. Wright and K. A. Jenkins, Appl. Phys. Lett., 1988, 52, 654–656 CrossRef CAS.
- K. Kang, S. Xie, L. Huang, Y. Han, P. Y. Huang, K. F. Mak, C.-J. Kim, D. Muller and J. Park, Nature, 2015, 520, 656–660 CrossRef CAS PubMed.
- E. D. Miller, M. L. Jones and E. Jankowski, Polymers, 2018, 10, 1358 CrossRef PubMed.
- D. Fazzi and M. Caironi, Phys. Chem. Chem. Phys., 2015, 17, 8573–8590 RSC.
- O. Alexiadis and V. G. Mavrantzas, Macromolecules, 2013, 46, 2450–2467 CrossRef CAS.
- M. M. Henry, M. L. Jones, S. D. Oosterhout, W. A. Braunecker, T. W. Kemper, R. E. Larsen, N. Kopidakis, M. F. Toney, D. C. Olson and E. Jankowski, J. Phys. Chem. C, 2017, 121, 26528–26538 CrossRef.
- N. E. Jackson, J. Phys. Chem. B, 2021, 125, 485–496 CrossRef CAS PubMed.
- E. Van, M. Jones, E. Jankowski and O. Wodo, Mol. Syst. Des. Eng., 2018, 3, 853–867 RSC.
- R. Noruzi, E. Lim, B. S. S. Pokuri, M. L. Chabinyc and B. Ganapathysubramanian, npj Comput. Mater., 2022, 8, 38 CrossRef.
- M. Mladenović and N. Vukmirović, J. Phys. Chem. C, 2015, 119, 23329–23333 CrossRef.
- X. Shi, V. Nádaždy, A. Perevedentsev, J. M. Frost, X. Wang, E. von Hauff, R. C. I. MacKenzie and J. Nelson, Phys. Rev. X, 2019, 9, 021038 CAS.
- S. A. Mollinger, B. A. Krajina, R. Noriega, A. Salleo and A. J. Spakowitz, ACS Macro Lett., 2015, 4, 708–712 CrossRef CAS PubMed.
- N. E. Jackson, K. L. Kohlstedt, B. M. Savoie, M. Olvera de la Cruz, G. C. Schatz, L. X. Chen and M. A. Ratner, J. Am. Chem. Soc., 2015, 137, 6254–6262 CrossRef CAS PubMed.
- L. Berencei, A. Grout-Smith, J. E. Poole and W. Barford, J. Chem. Phys., 2019, 151, 064120 CrossRef.
- I. McCulloch, M. Heeney, C. Bailey, K. Genevicius, I. MacDonald, M. Shkunov, D. Sparrowe, S. Tierney, R. Wagner, W. Zhang, M. L. Chabinyc, R. J. Kline, M. D. McGehee and M. F. Toney, Nat. Mater., 2006, 5, 328–333 CrossRef CAS PubMed.
- C. Poelking, E. Cho, A. Malafeev, V. Ivanov, K. Kremer, C. Risko, J.-L. Brédas and D. Andrienko, J. Phys. Chem. C, 2013, 117, 1633–1640 CrossRef CAS.
- P. Gemünden, C. Poelking, K. Kremer, K. Daoulas and D. Andrienko, Macromol. Rapid Commun., 2015, 36, 1047–1053 CrossRef PubMed.
- X. Zhang, H. Bronstein, A. J. Kronemeijer, J. Smith, Y. Kim, R. J. Kline, L. J. Richter, T. D. Anthopoulos, H. Sirringhaus, K. Song, M. Heeney, W. Zhang, I. McCulloch and D. M. DeLongchamp, Nat. Commun., 2013, 4, 2238 CrossRef PubMed.
- R. Noriega, J. Rivnay, K. Vandewal, F. P. V. Koch, N. Stingelin, P. Smith, M. F. Toney and A. Salleo, Nat. Mater., 2013, 12, 1038 CrossRef CAS PubMed.
- D. S. Pearson, P. A. Pincus, G. W. Heffner and S. J. Dahman, Macromolecules, 1993, 26, 1570–1575 CrossRef CAS.
- D. Venkateshvaran, M. Nikolka, A. Sadhanala, V. Lemaur, M. Zelazny, M. Kepa, M. Hurhangee, A. J. Kronemeijer, V. Pecunia, I. Nasrallah, I. Romanov, K. Broch, I. McCulloch, D. Emin, Y. Olivier, J. Cornil, D. Beljonne and H. Sirringhaus, Nature, 2014, 515, 384–388 CrossRef CAS PubMed.
- P. Carbone and A. Troisi, J. Phys. Chem. Lett., 2014, 5, 2637–2641 CrossRef CAS PubMed.
- T. Qin and A. Troisi, J. Am. Chem. Soc., 2013, 135, 11247–11256 CrossRef CAS PubMed.
- W. Barford, M. Marcus and O. R. Tozer, J. Phys. Chem. A, 2016, 120, 615–620 CrossRef CAS PubMed.
- P. W. Anderson, Phys. Rev., 1958, 109, 1492–1505 CrossRef CAS.
- B. Movaghar, L. O. Jones, M. A. Ratner, G. C. Schatz and K. L. Kohlstedt, J. Phys. Chem. C, 2019, 123, 29499–29512 CrossRef CAS.
- L. Berencei, W. Barford and S. R. Clark, Phys. Rev. B, 2022, 105, 014303 CrossRef CAS.
- W. F. Pasveer, J. Cottaar, C. Tanase, R. Coehoorn, P. A. Bobbert, P. W. M. Blom, D. M. de Leeuw and M. A. J. Michels, Phys. Rev. Lett., 2005, 94, 206601 CrossRef CAS PubMed.
- N. Tessler, Y. Preezant, N. Rappaport and Y. Roichman, Adv. Mater., 2009, 21, 2741–2761 CrossRef CAS.
- H. Sirringhaus, Adv. Mater., 2005, 17, 2411–2425 CrossRef CAS.
- S. D. Baranovskii, Phys. Status Solidi B, 2014, 251, 487–525 CrossRef CAS.
- V. Lemaur, J. Cornil, R. Lazzaroni, H. Sirringhaus, D. Beljonne and Y. Olivier, Chem. Mater., 2019, 31, 6889–6899 CrossRef CAS.
- N. Vukmirović, Phys. Chem. Chem. Phys., 2013, 15, 3543–3551 RSC.
- R. P. Fornari, P. W. M. Blom and A. Troisi, Phys. Rev. Lett., 2017, 118, 086601 CrossRef PubMed.
- M. Nikolka, K. Broch, J. Armitage, D. Hanifi, P. J. Nowack, D. Venkateshvaran, A. Sadhanala, J. Saska, M. Mascal, S.-H. Jung, J. K. Lee, I. McCulloch, A. Salleo and H. Sirringhaus, Nat. Commun., 2019, 10, 2122 CrossRef PubMed.
- X. Yan, M. Xiong, X.-Y. Deng, K.-K. Liu, J.-T. Li, X.-Q. Wang, S. Zhang, N. Prine, Z. Zhang, W. Huang, Y. Wang, J.-Y. Wang, X. Gu, S. K. So, J. Zhu and T. Lei, Nat. Commun., 2021, 12, 5723 CrossRef CAS PubMed.
- R. P. Fornari and A. Troisi, Adv. Mater., 2014, 26, 7627–7631 CrossRef CAS PubMed.
- Z.-D. Yu, Y. Lu, J.-Y. Wang and J. Pei, Chem. – Eur. J., 2020, 26, 16194–16205 CrossRef CAS PubMed.
- N. E. Jackson, B. M. Savoie, K. L. Kohlstedt, M. Olvera de la Cruz, G. C. Schatz, L. X. Chen and M. A. Ratner, J. Am. Chem. Soc., 2013, 135, 10475–10483 CrossRef CAS PubMed.
- C. Zhu and L. Fang, Macromol. Rapid Commun., 2018, 39, 1700241–1700258 CrossRef PubMed.
- G. P. Kini, Y. W. Han, S. J. Jeon, Y. J. Lee and D. K. Moon, Mater. Chem. Front., 2022, 6, 1759–1769 RSC.
- Q. Wang, S. Böckmann, F. Günther, M. Streiter, M. Zerson, A. D. Scaccabarozzi, W. L. Tan, H. Komber, C. Deibel, R. Magerle, S. Gemming, C. R. McNeill, M. Caironi, M. R. Hansen and M. Sommer, Chem. Mater., 2021, 33, 2635–2645 CrossRef CAS.
- B. Liu, D. Rocca, H. Yan and D. Pan, JACS Au, 2021, 1, 2182–2187 CrossRef CAS.
- R. Dilmurat, V. Lemaur, Y. Olivier, S. M. Gali and D. Beljonne, J. Phys. Chem. C, 2022, 126, 3118–3126 CrossRef CAS.
- H. Chen, A. Wadsworth, C. Ma, A. Nanni, W. Zhang, M. Nikolka, A. M. T. Luci, L. M. A. Perdigão, K. J. Thorley, C. Cendra, B. Larson, G. Rumbles, T. D. Anthopoulos, A. Salleo, G. Costantini, H. Sirringhaus and I. McCulloch, J. Am. Chem. Soc., 2019, 141, 18806–18813 CrossRef CAS PubMed.
- A. Troisi and A. Shaw, J. Phys. Chem. Lett., 2016, 7, 4689–4694 CrossRef CAS.
- R. P. Fornari and P. de Silva, Chem. – Eur. J., 2019, 25, 14651–14658 CrossRef CAS PubMed.
- M. Caironi, M. Bird, D. Fazzi, Z. Chen, R. Di Pietro, C. Newman, A. Facchetti and H. Sirringhaus, Adv. Funct. Mater., 2011, 21, 3371–3381 CrossRef CAS.
- D. Fazzi and F. Negri, Adv. Electron. Mater., 2021, 7, 2000786 CrossRef CAS.
- J. C. Maier and N. E. Jackson, Macromolecules, 2021, 54, 7060–7069 CrossRef CAS.
- R. Dilmurat, S. Prodhan, L. Wang and D. Beljonne, J. Chem. Phys., 2022, 156, 084115 CrossRef CAS PubMed.
- R. Manurung, P. Li and A. Troisi, J. Phys. Chem. B, 2021, 125, 6338–6348 CrossRef CAS PubMed.
- J. Qu, Q. Zhao, J. Zhou, H. Lai, T. Liu, D. Li, W. Chen, Z. Xie and F. He, Chem. Mater., 2019, 31, 1664–1671 CrossRef CAS.
- A. Troisi, Org. Electron., 2011, 12, 1988–1991 CrossRef CAS.
- T. W. Hagler, K. Pakbaz, K. F. Voss and A. J. Heeger, Phys. Rev. B: Condens. Matter Mater. Phys., 1991, 44, 8652–8666 CrossRef CAS.
- C. B. Nielsen, M. Turbiez and I. McCulloch, Adv. Mater., 2013, 25, 1859–1880 CrossRef CAS.
- M. D. Newton, Chem. Rev., 1991, 91, 767–792 CrossRef CAS.
- A. Nitzan, Annu. Rev. Phys. Chem., 2001, 52, 681–750 CrossRef CAS PubMed.
- H. M. McConnell, J. Chem. Phys., 1961, 35, 508–515 CrossRef CAS.
- S. Priyadarshy, S. S. Skourtis, S. M. Risser and D. N. Beratan, J. Chem. Phys., 1996, 104, 9473–9481 CrossRef CAS.
- W. Zhang, Y. Han, X. Zhu, Z. Fei, Y. Feng, N. D. Treat, H. Faber, N. Stingelin, I. McCulloch, T. D. Anthopoulos and M. Heeney, Adv. Mater., 2016, 28, 3922–3927 CrossRef CAS PubMed.
- H. Chen, M. Hurhangee, M. Nikolka, W. Zhang, M. Kirkus, M. Neophytou, S. J. Cryer, D. Harkin, P. Hayoz, M. Abdi-Jalebi, C. R. McNeill, H. Sirringhaus and I. McCulloch, Adv. Mater., 2017, 29, 1702523 CrossRef PubMed.
- S. Prodhan, J. Qiu, M. Ricci, O. M. Roscioni, L. Wang and D. Beljonne, J. Phys. Chem. Lett., 2020, 11, 6519–6525 CrossRef CAS PubMed.
Footnote |
| † Electronic supplementary information (ESI) available. See DOI: https://doi.org/10.1039/d2tc02527b |
| This journal is © The Royal Society of Chemistry 2022 |

