Thermal transport across copper–water interfaces according to deep potential molecular dynamics†
Received
27th November 2022
, Accepted 29th January 2023
First published on 20th February 2023
Abstract
Nanoscale thermal transport at solid–liquid interfaces plays an essential role in many engineering fields. This work performs deep potential molecular dynamics (DPMD) simulations to investigate thermal transport across copper–water interfaces. Unlike traditional classical molecular dynamics (CMD) simulations, we independently train a deep learning potential (DLP) based on density functional theory (DFT) calculations and demonstrated its high computational efficiency and accuracy. The trained DLP predicts radial distribution functions (RDFs), vibrational densities of states (VDOS), density curves, and thermal conductivity of water confined in the nanochannel at a DFT accuracy. The thermal conductivity decreases slightly with an increase in the channel height, while the influence of the cross-sectional area is negligible. Moreover, the predicted interfacial thermal conductance (ITC) across the copper–water interface by DPMD is 2.505 × 10⁸ W m−2 K−1, the same order of magnitude as the CMD and experimental results but with a high computational accuracy. This work seeks to simulate the thermal transport properties of solid–liquid interfaces with DFT accuracy at large-system and long-time scales.
1. Introduction
Thermal transport at solid–liquid interfaces is a crucial phenomenon that occurs widely in the fields of device cooling,1–3 solar-driven interfacial evaporation,4 photothermal cancer therapy5 and laser-induced drug release.6 Hindered by experimental equipment and the environment, it is extremely difficult to accurately measure the thermal physical properties at the solid–liquid interface when the characteristic length is reduced to the nanoscale.
Classical molecular dynamics (CMD), as a powerful tool to capture atoms’ motion trajectories, has been widely applied to simulate nanoscale thermal transport. Ohara and Torii7 performed CMD simulations to study the shear behavior of liquid water between two solid walls and found that the types of solid surfaces played a critical role in the interfacial thermal transport. Ueki et al.8 investigated the instantaneous interfacial thermal resistance using CMD when the nanoscale water droplet cools down and freezes. Furthermore, Yu et al.9 performed CMD simulations to study the heat transport through the solid–liquid interface and revealed the direction of energy transport during the evaporation process. Frank et al.10 studied the influence of surface irregularities and imperfections on the interfacial thermal resistance using CMD. A mathematical optimization method of the grooved nanostructured surface design was also used to enhance heat transfer at the solid–liquid interface.11 Guo et al.12 investigated the interfacial heat transfer between parallel plates and a thin layer of liquid argon with the empirical Lennard–Jones (LJ) potential. Heat flux and temperature drop were calculated in the channel, and then the thermal resistance was evaluated. Though CMD can simulate a solid–liquid system consisting of a large number of atoms, its accuracy suffers from the empirical potential, especially under extreme conditions (high temperature and high pressure). By contrast, ab initio molecular dynamics (AIMD) provides a framework for on-the-fly construction of a potential energy surface (PES) using density functional theory (DFT) calculations and has become a powerful tool to investigate the dynamical properties of solid–liquid interfaces.13,14 However, the high computational cost limits the use of AIMD to the time scale of ∼10 ps and hundreds of atoms, thus limiting its application in solid–liquid interfaces.
Machine learning potentials (MLPs) combine the high efficiency of CMD with the accuracy of first-principles, and provide a paradigm for accurate simulation of large systems. MLPs have recently been applied to predict the thermal properties,15–18 optical properties,19 chemical reactions,20–22 and phase diagrams23,24 of crystalline solids or liquids, and demonstrated a greatly improved computational efficiency over AIMD. Zuo et al.25 performed a comprehensive evaluation of machine learning interatomic potentials (IAPs) and provided a benchmark for common MLPs. Xie et al.26 explored the accuracy/performance tradeoff of different MLPs and the deep learning potentials (DLP) exceled in computational efficiency due to its reduced manual input hyper-parameterization and Graphics Processing Unit (GPU) acceleration. Applications of DLPs to the solid–liquid interface include the proton transport at TiO2–water interfaces,27 the profiles and migration of the Pd–Si solid–liquid interface,28 and the solid–liquid phase transition of silicon.29 Recent calculations reported the structural and thermodynamic properties of the liquid–vapor interface using neural-network molecular dynamics.30,31 To the best of our knowledge, there have been no significant reports of research on the solid–liquid interfacial heat transfer with MLPs. MLPs have great potential for breaking the barrier of incompatible between computational accuracy and speed in the study of heat transfer at the solid–liquid interface. Hence, it is important to improve the applicability of MLPs to solid–liquid interfacial heat transfer, especially for the training process of MLPs and subsequent applications. In this work, we build a nano-channel model consisting of copper, liquid water and copper–water interface, develop a DLP trained on DFT calculations, and apply deep potential molecular dynamics (DPMD) to simulate the thermal transport across the copper–water interface. The DLP is trained by a large set of interface structures including copper and liquid water, and its accuracy is determined by comparing the predicted energy (or forces) with DFT. The size effect on thermal conductivity has been considered and validated using DLP. The DPMD simulations exhibit a reasonable prediction of the thermal conductivity, radial distribution functions (RDFs), vibrational densities of states (VDOS) and density distribution curves of water in the nano-channel. Moreover, the predicted interfacial thermal conductance across the copper–water interface is 2.505 × 10⁸ W m−2 K−1, the same order of magnitude as LJ potentials and experimental results.
2. Computational methodology
2.1. Data acquisition and training
The rationality, consistency, and completeness of the training structures are crucial to yield reliable and accurate DLPs. Prior to training DLPs, we first constructed a copper (010)–water interface structure consisting of 139 atoms (64 copper atoms and 25 water molecules), following previous literature reports.22,32 The deep potential generator (DP-GEN)33 active-learning package was employed to generate training datasets. Three main steps were followed including exploration, labeling, and training, and more details are given in ref. 33 and 34.
To initialize the workflow, we performed AIMD simulations to generate initial training datasets and trained four DLPs with different random seeds. Further details can be found in Section III of the ESI.†
Exploration.
This step aims to explore the configure space based on MD simulations with the initial DLPs. DPMD simulations were performed by running canonical ensemble (NVT) at various temperatures (280 K, 290 K, 300 K, 310 K, and 320 K). In addition, to generate more abundant configures, we selected a couple of different structures from AIMD trajectories as the initial structures.
To sample reasonable configures from DPMD trajectories, we introduced the model deviation ε, which is defined as the maximum standard deviation of the predictions for the atomic forces:
| |  | (1) |
where
i is the atomic index,
Fi is the atomic force and <
Fi> represents the average of four different DLPs. Similarly, an upper and lower bound of the trust levels,
εhi and
εlo are used; only configurations whose model deviations
ε fall between the bounds will be considered for DFT calculations in the labeling stage. Here we set
εlo = 0.12 eV Å
−1 and
εhi = 0.25 eV Å
−1.
Labeling.
In this stage, the configurations within the model deviations will be labeled for DFT calculations. The projected augmented wave (PAW) method35 and the generalized gradient approximation of Perdew–Burke–Ernzerhof (PBE)36 functional are used in the DFT calculations with the Vienna Ab Initio Simulation Package (VASP)37 software. The cutoff energy for the plane wave expansion is set to 500 eV, and the Brillouin zone is sampled at the Γ point. The SCF energy convergence threshold is chosen to be 10−6 Hartree/atom. Recent studies27,30 showed that the dispersion-corrected DFT accounts for a large proportion of computational accuracy, especially for water and metal–water systems. Hence, the PBE functional with a D3 dispersion correction38,39 was used.
Training.
The reference configurations in the Labeling step were added to the training data. A total of 9505 ab initio snapshots are generated for the DLP training.
We adopted the DeepMD-kit40 software to train data and fit potentials, implemented by the deep learning framework TensorFlow.41 The system energy is decomposed into the energy per atom
| |  | (2) |
where
Ei (atomic energy) is determined by the local chemical environments of the atom within the radius cutoff
Rc.
| |  | (3) |
where
NRc(
i) denotes the index set of the neighbors of atom
i within the radius cutoff
Rc, and
Ri represents the atomic coordinate. To guarantee the translational, rotational, and permutational symmetries of the PES, the DeepMD-kit employs the descriptors (
Dαij) to map atomic positions into chemical descriptor information.
| | 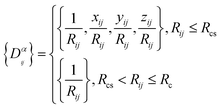 | (4) |
The superscript α can have values of 0, 1, 2, and 3. When α = 0, only radial information, is used, while using α = 0, …, 3 indicates full radial and angular information are used for model training. Further details are available in ref. 42 and 43 DeepMD-kit has implemented the descriptors of ‘se_e2_a’, ‘se_e2_r’, and ‘se_e3’. For ‘se_e2_a’, the notation means that the descriptor is constructed from all information (both angular and radial) of atomic configurations. The e2 stands for the embedding with two-atoms information. Only the radial information of atomic configurations is included in the descriptor ‘se_e2_r’. Similarly, both angular and radial information are integrated into the descriptor ‘se_e3’. The embedding takes angles between two neighboring atoms as input (denoted by e3). The detailed information can be found in ref. 40 and 43 The descriptor ‘se_e2_a’ was applied, and the size of the embedding neural network and fitting neural network was set to {25, 50, 100} and {240, 240, 240}, respectively. The smooth cutoff (Rcs) and radius cutoff (Rc) were chosen to be 0.5 Å and 6.0 Å, respectively. Besides, the Adam stochastic gradient descent method44 was used to optimize the model parameters while minimizing the loss function
| |  | (5) |
where Δ denotes the differences between the training data and DPMD prediction,
N is the number of atoms,
ε represents energy per atom,
Fi is the force on atom
i, and
ζ is the virial tensor, respectively. Note that no virial data were included in the training process, we set
pζ = 0. The starting prefactors were 0.02 and 1000 for the energy and force errors, respectively, which means that the training process was initially dominated by force-fitting. The learning rate decreased exponentially from the initial 1.0 × 10
−3 to 3.5 × 10
−8 with the decay rate and decay step equaling 0.95 and 5000, respectively.
2.2. DPMD simulation
DPMD simulations were completed by the LAMMPS45 software, which had been interfaced with the DeepMD-kit. To study the thermal transport across the copper–water interface, a nano-channel was constructed, as shown in Fig. 1. Two plates consisting of copper atoms were located at the bottom and top, respectively. The bottom plate consists of five layers of copper atoms arranged horizontally, and the outmost layer was fixed to prevent other atoms from moving. The middle two layers called “phantom atoms” were considered as heat sources connected to an external thermostat. The two innermost layers were in direct contact with water molecules. The top copper atoms were configured in the same way.
 |
| | Fig. 1 (a) Schematic diagram for liquid water embedded in the nano-channel composed of copper atoms, and (b) the simulation setup of the NEMD method and the thermostat is applied to the bottom and top plate, respectively. | |
After constructing the nano-channel, the geometry optimization was performed using the conjugate gradient (CG) algorithm. Then, the system was relaxed for 0.2 ns with a timestep of 0.5 fs under the NPT ensemble, and the relaxation temperature was set at 300 K via a Nosé–Hoover thermal bath. The system's energy, temperature, and pressure changes were monitored until reaching equilibrium. A dynamical simulation run in the microcanonical ensemble (NVE) was performed. To explore heat transport, a temperature difference of 40 K was applied between the bottom (hot) and top (cold) plates. The bottom plate was heated up to 320 K, and the temperature of the top plate remained at 280 K by the Langevin method.46 In particular, since the cutoff radius of each atom has been specified during the training process, there is no need to reset the cutoff radius here. Periodic boundary conditions were set in all directions and the visualization was realized using the OVITO47 software. To assess the accuracy of DLPs relative to empirical potentials, the thermal transport properties were also simulated with Lennard Jones (LJ) potentials. Two common water models, TIP4P48 and SPC,49 were used to perform CMD simulations.
3. Results and discussion
3.1. Validation of DLP model
To validate the trained DLP, we randomly chose 50 Cu-water interface data (not included in the training data) as testing sets to estimate the energy, forces, and root mean square error (RMSE). In Fig. 2, the predicted energy and force by DLP are excellently consistent with DFT. The RMSEs for the interface are quite low (1.7804 meV per atom for energy and 73.973 meV Å−1 for force) and the coefficient of determination is close to 1. The excellent agreement between DLP and DFT has confirmed its high accuracy and capability for further thermal transport property predictions.
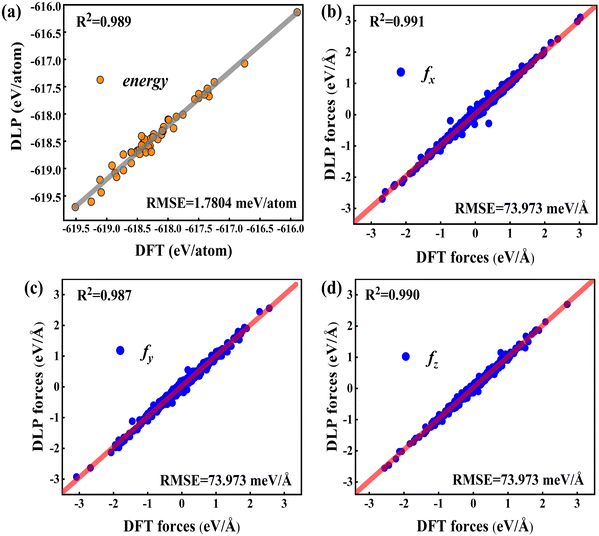 |
| | Fig. 2 (a) Comparison between the DFT energies per atom and the DLP prediction, and (b–d) comparison between the DFT forces and DLP prediction in different directions. The red line denotes the fitting curve, and the blue dots and black dots represent the force coordinates and energy coordinates, respectively. | |
The RDFs can reflect the structural properties of confined water in the nanochannel. To further evaluate the accuracy of DLP in describing the structural evolution process, we built a copper–water interface of 139 atoms and performed both DPMD and AIMD simulations at 300 K. Considering the computational cost, AIMD and DPMD run 9200 steps with a timestep of 0.5 fs. Due to the copper atoms being motionless during the heat transfer, we only considered the RDFs of water, and the average RDFs of the last 2000 configures are calculated and compared, as shown in Fig. 3. For oxygen–hydrogen RDFs, DPMD is highly consistent with AIMD in terms of peak intensity and trend. It should be noted that in Fig. 3(b) and (c), at r > 3.5 Å, the RDFs obtained from DPMD are slightly higher than AIMD results due to the limited statistics and small system size of AIMD. Aside from this region, DPMD simulations reproduce well the RDFs trend from AIMD calculations. Additional validation tests are reported in the ESI,† where we compare the RDFs of water resulting from the large system and small system. It can be concluded that DLP not only describes the dynamic characteristics of the system with the accuracy of DFT, but also generalizes the accuracy of DFT to the larger system. Moreover, we also compare the VDOS of water and copper as obtained from 4.6 ps of AIMD, CMD and DPMD simulations of the copper–water interface. The VDOS is calculated from the Fourier transform of the velocity autocorrelation as follows:
| |  | (6) |
where
v represents the atomic velocity,
ω is the phonon frequency and the angle brackets indicate the ensemble averaging. As shown in
Fig. 3(d), the VDOS of copper is maintained to the low-frequency region (<14 THz) and those three curves show the same change trend except for the differences in peak position and intensity. The VDOS values of water are broadly distributed in the range 0–50 THz. Surprisingly, the peak position at high frequency (50 GHz) predicted by DPMD is almost identical to the AIMD result, which is not found in the CMD result. Further analysis reveals that the high frequency peak is caused by the vibration of the hydrogen atoms, whose potential energy contribution is neglected during the CMD simulations. It is noted that DPMD cannot repeat the VDOS curve as precisely as it can reproduce RDF due to the complexity of the solid–liquid interface structure and potential energy surface, which is beyond the scope of this work.
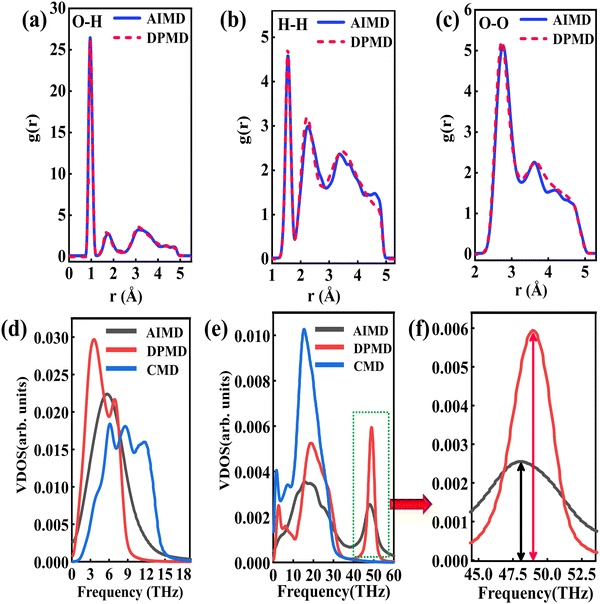 |
| | Fig. 3 (a) O–H radial distribution function comparison between the DPMD and the AIMD, (b) H–H radial distribution function comparison and (c) O–O radial distribution function comparison. (d) The vibrational density of states of the Cu surface. (e) The vibrational density of states of the water and (f) partial enlargement (43.5–53 THz) of high frequency peaks. | |
3.2. Size effect of NEMD simulation
The size effect has been a challenge in NEMD simulations according to previous studies.50,51 Research indicates that the cross-sectional area has less influence on the thermal transport properties, while the thermal transport properties are more sensitive to the channel height.52,53 To verify this, size factors affecting thermal conductivity have been analyzed using DLP. Five types of nano-channels were prepared with the cross-sectional areas of 10 Å (x) × 39 Å (z), 15 Å (x) × 39 Å (z), 20 Å (x) × 39 Å (z), 25 Å (x) × 39 Å (z) and 34 Å (x) × 39 Å (z) and the same channel height (46.5 Å). Next, we perform a non-equilibrium molecular dynamics (NEMD) simulation with the DLP to predict thermal conductivity of liquid water embedded in the nano-channel. The nano-channel is relaxed at 300 K, and the initial density of the liquid water is 1 g cm−3 corresponding to the normal conditions. The water temperature profiles and smoothed results (inserted figure) predicted with different potentials are shown in Fig. 4(a). It is observed that the water temperature for all the potentials consistently increases to the target temperature (300 K) due to the heating from the copper surface. Since the temperature of the heat source and heat sink are set to 320 K and 280 K, respectively, the average temperature of liquid water should be about 300 K after the system reaches thermal equilibrium. Our trained DLP successfully predicts the stabilized temperature of 300 K for the liquid water, the same as empirical potentials (SPC and TIP4P). Fig. 4(b) depicts the cumulative energy input and output through the heat source and heat sink, whose energy difference maintained at 0 eV suggests that the system has an excellent energy conversion. The energy input and output are fitted by linear curves and the slopes are averaged to obtain the heat flux. To obtain the temperature gradient, the liquid water is equally divided into 27 bins, and the average temperature of each bin is calculated. A clear temperature gradient for water is shown in Fig. 4(c). Once obtaining the heat flux at the solid–liquid interface and the temperature gradient, the thermal conductivity of liquid water can be evaluated following the classical Fourier's law.
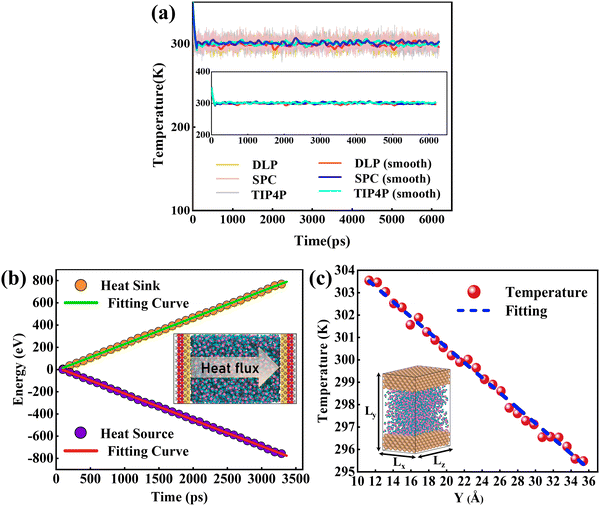 |
| | Fig. 4 (a) The temperature variation profiles of liquid water embedded in the nano-channel, (b) the cumulative energy added to the heat source and energy removed from the heat sink and heat flux across the interface is obtained by a linear fitting of the profiles, and (c) the temperature distributions of water in the nano-channel. Note that the heat flux is in units of eV ps−1 and the temperature gradient is in units of K Å−1. | |
In Fig. 5(a), the predicted thermal conductivity remains nearly unchanged as the cross-sectional area increases. We also investigate the influence of channel heights (25 Å, 31 Å, 39.5 Å, and 46.5 Å), as shown in Fig. 5(b), the thermal conductivity reduces as a function of the channel height. As the channel height increases, thermal conductivity approaches the value of bulk water, which is consistent with empirical potentials.52,53 Previous studies53,54 emphasized that the thermal conductivity of water confined in the nano-channel would be relatively larger compared with bulk water due to the interactions between the liquid and solid. Therefore, the length and width of the simulation box should be large enough to eliminate the size effect on the thermal conductivity. A cross-sectional area of 25 Å × 39 Å and a height of 46.5 Å are chosen in this study to balance computational cost and uncertainty in the results. 918 water molecules are randomly distributed in the middle of the nano-channel with an average density of 1 g cm−3.
 |
| | Fig. 5 (a) Thermal conductivity of water with different cross-sectional areas. (b) Thermal conductivity of water with a different channel height. | |
3.3. Density distribution of water
Thermal transport properties across the solid–liquid interface are strongly correlated with the liquid water distribution in the nano-channel. We calculate the density distribution curve of liquid water along the y-direction. The system box is divided evenly into 50 bins along the y-direction, and the number density in the bin is calculated. Water molecules aggregate and appear near the walls, which arises from the interaction between solid and liquid atoms. This interaction promotes the regular arrangement of water molecules near the wall similar to solid atoms, called the “solid-like” layer,55,56 as shown in the Fig. 6(a). This is more intuitively observed in Fig. 6(b), where the number density changes sharply near the wall, and then oscillates and decays to the average level. In the central region, water molecules distribute uniformly and continuously in a fluid state, corresponding to the relatively gentle position of the number density curve. Compared with LJ potentials, the density peak appears at 12 Å and 35 Å when using DLP simulations, and the density peak shifts to a certain extent as the intensity decreases. It can be concluded that the adsorption and aggregation of water molecules will also occur on the copper surface, showing hydrophilicity, but the aggregation state of water molecules is slightly different from LJ potentials. In order to characterize the aggregation state of water molecules, the density distribution profiles of liquid water molecules and the corresponding morphology of the solid–liquid interface at 7, 8 and 9 ns are studied, as Fig. 7 shows. Overall, the density distribution of different potentials remains almost constant after reaching the equilibrium state. DLP presents a weak density peak compared to the empirical potential, which corresponds to the results in Fig. 6. In addition, for the solid–liquid interface morphology, DLP exhibits a nonlinearly varying morphology compared to the flatter morphology of empirical potentials. The reason may lie in the form of the potential model and its scope of application. LJ potential describes the two-body interactions at most, and its functional form has been defined. In contrast, the deep neural network (DNN) can be used to approximate any high-dimensional function and has the advantage of characterizing many-body potentials. The DLP based on DNN training is different from the fixed functional form of empirical potentials, and is more like some mapping relationship. From another perspective, a well-designed DNN presents the essential physical image and structural information better than the fixed functional form.
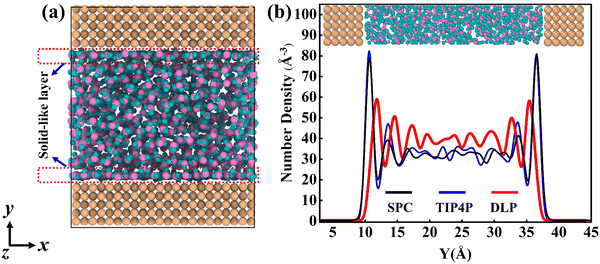 |
| | Fig. 6 (a) The thermal equilibrated structures of water layers near the solid wall obtained by dynamical simulations and (b) water density profiles along the y direction calculated from dynamical simulations with different potentials. | |
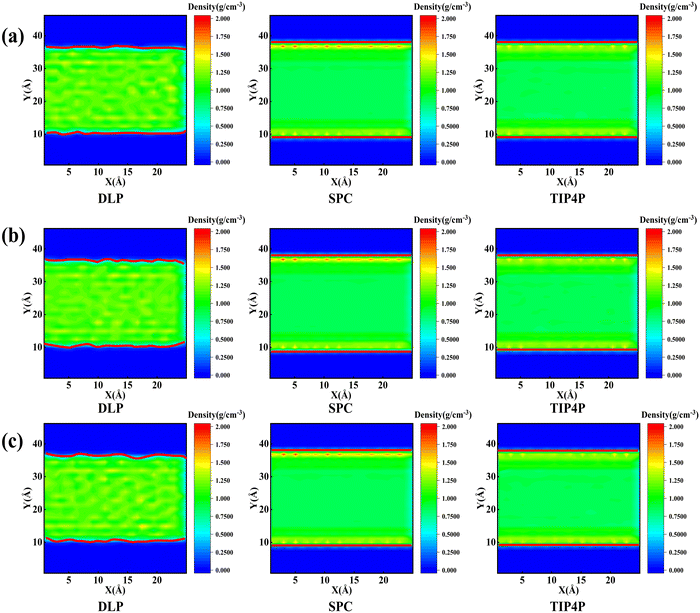 |
| | Fig. 7 Mass density distribution profile and morphology of the solid–liquid interface (which is highlighted in the red solid line) for DLP and empirical potentials at (a) 7 ns, (b) 8 ns and (c) 9 ns. | |
3.4. Thermal transport properties of solid–liquid interfaces
ITC is a significant parameter to evaluate thermal transport properties at solid–liquid interfaces. To verify the suitability of the DPMD simulation, we also perform NEMD simulations using DLP and empirical potentials, respectively, to calculate the ITC across the interface. Based on the temperature distribution and heat flux, the ITC across the solid–liquid interface can be evaluated as follows:| |  | (7) |
where J represents the heat flux, A is the cross-sectional area where the heat flux flows, and ΔT is the temperature drop across the solid–liquid interface. Heat flux has been calculated in the Size Effect of NEMD Simulation. To determine the temperature jumps, the linear least squares method is applied to extrapolate the linear temperature from the liquid region to the solid surfaces and vice versa. Fig. 8 shows a noticeable temperature jump across the solid–liquid interface and the fitting results of the linear temperature. The temperature drop near the heat source is about 17.03 K for the DLP calculation, while that of SPC and TIP4P is 9.95 K and 9.50 K, respectively. At the heat sink, the temperature drop decreases to 13.05 K for the DLP calculation, while that of SPC and TIP4P is 9.70 K and 9.50 K, respectively. The averaged heat flux for the DLP is 0.22528 eV ps−1 (DLP), while that of SPC and TIP4P is 0.25782 eV ps−1 and 0.25323 eV ps−1, respectively. In Table 1, it is observed that ITC predicted by DLP is 2.505 × 10⁸ W m−2 K−1 with a relatively small error (± 0.335 × 10⁸ W m−2 K−1), while empirical potentials predict a much higher ITC. TIP4P predicts the ITC as 4.38 × 10⁸ W m−2 K−1, and that of SPC is 4.26 × 10⁸ W m−2 K−1 and 4.37 × 10⁸ W m−2 K−1, respectively. In addition, ITC is not an intrinsic property and we herein investigate the effect of the thermal bath type, temperature and system size on the interfacial thermal conductance. The detailed results are summarized in Section IV of the ESI,† where the original results are used as a comparison. It concludes that DLP predicts ITC in the same order of magnitude as LJ potentials and experimental values,57 and the results of LJ potentials are much larger as a result of strong solid–liquid interaction. Note that the experimental value is the interfacial thermal conductance of other types of metals (Au) with water. We compute the VDOS to further quantify the solid–liquid interaction. Fig. 9 illustrates the VDOS of the water has an overlap with the copper surface, where the LJ potentials display a larger overlapping area compared to DLP, as shown in Fig. 9(b) and (c). Typically, a large overlap between the VDOS suggests strong interfacial coupling strength and, therefore, produces a reduction in the mobility causing the interfacial liquid to resemble the solid vibrational properties.58 The strong solid–liquid interaction drives water adsorption on the surface to produce a density peak, which normally promotes the formation of a “solid-like” layer. Compared to LJ potentials, DLP displays a smaller density peak, i.e., a weak “solid-like” layer, resulting in relatively low ITCs.
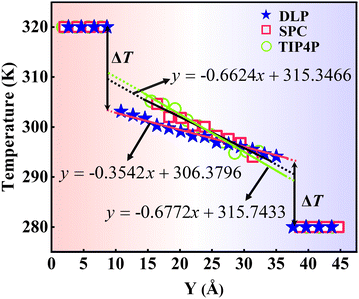 |
| | Fig. 8 The temperature distributions along the y direction calculated from dynamical simulations with DLP and empirical potentials. The x in the function expression represents the position in the y-direction, and y on behalf of temperature. | |
Table 1 ITC predicted using different potentials. ITC is in units of W m−2 K−1
|
|
DLP |
TIP4P |
SPC |
Experimental values57 |
| High-temperature interface |
2.17 × 10⁸ |
4.38 × 10⁸ |
4.26 × 10⁸ |
— |
| Low-temperature interface |
2.84 × 10⁸ |
4.38 × 10⁸ |
4.37 × 10⁸ |
— |
| Average value |
(2.505 ± 0.335) × 108 |
4.38 × 10⁸ |
(4.315 ± 0.055) × 108 |
(1.800 ± 0.300) × 108 |
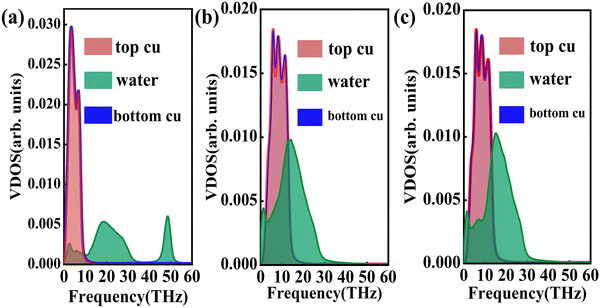 |
| | Fig. 9 The vibrational density of states of the Cu surface and water for (a) DLP, (b) LJ potential (SPC) and (c) LJ potential (TIP4P). | |
3.5. Evaluation of computational efficiency
Finally, we present a brief summary of the computational efficiency of DPMD simulation. According to the calculation parameters mentioned in the Computational Methodology, it should take the CPU time of ∼217 h to finish a 4.6 ps AIMD calculation (139 atoms) using one compute node (64 Intel Xeon-Platinum 8375c CPU cores). By comparison, it only takes 125 h to realize a 6200 ps DPMD simulation of 4294 atoms running with a NVIDIA RTX 3090 GPU. A little bit inappropriate is that computational consumption of DLP training is not considered, and different computing platforms are adopted for DPMD and AIMD respectively. More notably, large-scale molecular dynamics simulations with DFT accuracy are expected to be realized, and the computational efficiency could be maintained to a certain extent.
4. Conclusions
This work presents a DLP trained on DFT calculations combined with an active learning scheme to investigate the thermal transport process across solid–liquid interfaces. The diversity and integrity of the solid–liquid interface are extended by active learning methods to train a more accurate DLP. Due to the well-described interaction between water and copper, DPMD exhibits excellent performance in predicting the thermal conductivity, RDFs, VDOS and density distribution curves of water at solid–liquid interfaces. Moreover, the average interfacial thermal conductance across the copper–water interface predicted by DLP is estimated to be 2.505 × 10⁸ W m−2 K−1, the same order of magnitude as LJ potentials and experimental results. The VDOS further quantifies the solid–liquid interaction, demonstrating that the existence of solid–liquid interactions and strong coupling prompt heat transport at the interface. This work studies interfacial thermal transport under normal temperature conditions using DLP and obtains uniform results with experiments and empirical potentials. It is expected to develop more accurate DLPs to explore thermal transport in extreme environments, especially under high temperature and pressure conditions.
Data availability
Training data and input files for DPMD have been made available at https://doi.org/10.5281/zenodo.7070848.
Conflicts of interest
The authors have no conflicts of interest to disclose.
Acknowledgements
J.-Y. Y. is grateful for the support from Shandong University (Qilu Young Scholar 89963031). L. L. acknowledges the support from the National Natural Science Foundation of China (Grant no. 52076123).
References
- R. van Erp, R. Soleimanzadeh, L. Nela, G. Kampitsis and E. Matioli, Co-designing electronics with microfluidics for more sustainable cooling, Nature, 2020, 585, 211–216 CrossRef CAS PubMed
 .
.
- D. F. Hanks, Z. Lu, J. Sircar, I. Kinefuchi, K. R. Bagnall, T. R. Salamon, D. S. Antao, B. Barabadi and E. N. Wang, High Heat Flux Evaporation of Low Surface Tension Liquids from Nanoporous Membranes, ACS Appl. Mater. Interfaces, 2020, 12, 7232–7238 CrossRef CAS PubMed
 .
.
- S. Poudel, A. Zou and S. C. Maroo, Evaporation Dynamics in Buried Nanochannels with Micropores, Langmuir, 2020, 36, 7801–7807 CrossRef CAS PubMed
 .
.
- M. Nazari, A. Masoudi, P. Jafari, P. Irajizad, V. Kashyap and H. Ghasemi, Ultrahigh Evaporative Heat Fluxes in Nanoconfined Geometries, Langmuir, 2019, 35, 78–85 CrossRef CAS PubMed
 .
.
- Z. Zhou, X. Wang, H. Zhang, H. Huang, L. Sun, L. Ma, Y. Du, C. Pei, Q. Zhang, H. Li, L. Ma, L. Gu, Z. Liu, L. Cheng and C. Tan, Activating Layered Metal Oxide Nanomaterials via Structural Engineering as Biodegradable Nanoagents for Photothermal Cancer Therapy, Small, 2021, 17, 2007486 CrossRef CAS PubMed
 .
.
- Y. Mantri and J. V. Jokerst, Engineering Plasmonic Nanoparticles for Enhanced Photoacoustic Imaging, ACS Nano, 2020, 14, 9408–9422 CrossRef CAS PubMed
 .
.
- T. Ohara and D. Torii, Molecular dynamics study of thermal phenomena in an ultrathin liquid film sheared between solid surfaces: The influence of the crystal plane on energy and momentum transfer at solid–liquid interfaces, J. Chem. Phys., 2005, 122, 214717 CrossRef PubMed
 .
.
- Y. Ueki, Y. Tsutsumi and M. Shibahara, Molecular dynamics study of instantaneous interfacial thermal resistance of droplets on flat crystalline surface during cooling and ice formation, Int. J. Heat Mass Transfer, 2022, 194, 123004 CrossRef CAS
 .
.
- J.-J. Yu, R. Tang, Y.-R. Li, L. Zhang and C.-M. Wu, Molecular Dynamics Simulation of Heat Transport through Solid–Liquid Interface during Argon Droplet Evaporation on Heated Substrates, Langmuir, 2019, 35, 2164–2171 CrossRef CAS PubMed
 .
.
- M. Frank, M. Papanikolaou, D. Drikakis and K. Salonitis, Heat transfer across a fractal surface, J. Chem. Phys., 2019, 151, 134705 CrossRef PubMed
 .
.
- Q. Cao, Z. Cui and W. Shao, Optimization Method for Grooved Surface Structures Regarding the Evaporation Heat Transfer of Ultrathin Liquid Films at the Nanoscale, Langmuir, 2020, 36, 2802–2815 CrossRef CAS PubMed
 .
.
- Y. Guo, D. Surblys, Y. Kawagoe, H. Matsubara, X. Liu and T. Ohara, A molecular dynamics study on the effect of surfactant adsorption on heat transfer at a solid–liquid interface, Int. J. Heat Mass Transfer, 2019, 135, 115–123 CrossRef CAS
 .
.
- H. H. Heenen, J. A. Gauthier, H. H. Kristoffersen, T. Ludwig and K. Chan, Solvation at metal/water interfaces: An ab initio molecular dynamics benchmark of common computational approaches, J. Chem. Phys., 2020, 152, 144703 CrossRef CAS PubMed
 .
.
- J. S. Lowe and D. J. Siegel, Modeling the Interface between Lithium Metal and Its Native Oxide, ACS Appl. Mater. Interfaces, 2020, 12, 46015–46026 CrossRef CAS PubMed
 .
.
- Y.-B. Liu, J.-Y. Yang, G.-M. Xin, L.-H. Liu, G. Csányi and B.-Y. Cao, Machine learning interatomic potential developed for molecular simulations on thermal properties of β-Ga2O3, J. Chem. Phys., 2020, 153, 144501 CrossRef PubMed
 .
.
- S. Arabha and A. Rajabpour, Thermo-mechanical properties of nitrogenated holey graphene (C2N): A comparison of machine-learning-based and classical interatomic potentials, Int. J. Heat Mass Transfer, 2021, 178, 121589 CrossRef CAS
 .
.
- A. Rodriguez, S. Lam and M. Hu, Thermodynamic and Transport Properties of LiF and FLiBe Molten Salts with Deep Learning Potentials, ACS Appl. Mater. Interfaces, 2021, 13, 55367–55379 CrossRef CAS PubMed
 .
.
- Z. Liu, X. Yang, B. Zhang and W. Li, High Thermal Conductivity of Wurtzite Boron Arsenide Predicted by Including Four-Phonon Scattering with Machine Learning Potential, ACS Appl. Mater. Interfaces, 2021, 13, 53409–53415 CrossRef CAS PubMed
 .
.
- W. Chen and L.-S. Li, The study of the optical phonon frequency of 3C-SiC by molecular dynamics simulations with deep neural network potential, J. Appl. Phys., 2021, 129, 244104 CrossRef CAS
 .
.
- J. H. Lam, Y. Li, L. Zhu, R. Umarov, H. Jiang, A. Héliou, F. K. Sheong, T. Liu, Y. Long, Y. Li, L. Fang, R. B. Altman, W. Chen, X. Huang and X. Gao, A deep learning framework to predict binding preference of RNA constituents on protein surface, Nat. Commun., 2019, 10, 4941 CrossRef PubMed
 .
.
- J. Behler, Neural network potential-energy surfaces in chemistry: a tool for large-scale simulations, Phys. Chem. Chem. Phys., 2011, 13, 17930 RSC
 .
.
- S. K. Natarajan and J. Behler, Neural network molecular dynamics simulations of solid–liquid interfaces: water at low-index copper surfaces, Phys. Chem. Chem. Phys., 2016, 18, 28704–28725 RSC
 .
.
- L. Zhang, H. Wang, R. Car and W. E. Phase, Diagram of a Deep Potential Water Model, Phys. Rev. Lett., 2021, 126, 236001 CrossRef CAS PubMed
 .
.
- N. Ouyang, C. Wang and Y. Chen, Temperature- and pressure-dependent phonon transport properties of SnS across phase transition from machine-learning interatomic potential, Int. J. Heat Mass Transfer, 2022, 192, 122859 CrossRef CAS
 .
.
- Y. Zuo, C. Chen, X. Li, Z. Deng, Y. Chen, J. Behler, G. Csányi, A. V. Shapeev, A. P. Thompson, M. A. Wood and S. P. Ong, Performance and Cost Assessment of Machine Learning Interatomic Potentials, J. Phys. Chem. A, 2020, 124, 731–745 CrossRef CAS PubMed
 .
.
-
S. R. Xie, M. Rupp and R. G. Hennig, Ultra-fast interpretable machine-learning potentials, arXiv, 2021, preprint, arXiv.2110.00624 [cond-mat.mtrl-sci] DOI:10.48550/arXiv.2110.00624.
- M. F. Calegari Andrade, H.-Y. Ko, L. Zhang, R. Car and A. Selloni, Free energy of proton transfer at the water–TiO 2 interface from ab initio deep potential molecular dynamics, Chem. Sci., 2020, 11, 2335–2341 RSC
 .
.
- T. Wen, C.-Z. Wang, M. J. Kramer, Y. Sun, B. Ye, H. Wang, X. Liu, C. Zhang, F. Zhang, K.-M. Ho and N. Wang, Development of a deep machine learning interatomic potential for metalloid-containing Pd–Si compounds, Phys. Rev. B: Condens. Matter Mater. Phys., 2019, 100, 174101 CrossRef CAS
 .
.
- R. Li, E. Lee and T. Luo, A unified deep neural network potential capable of predicting thermal conductivity of silicon in different phases, Mater. Today Phys., 2020, 12, 100181 CrossRef
 .
.
- O. Wohlfahrt, C. Dellago and M. Sega,
Ab initio Structure and Thermodynamics of the RPBE-D3 Water/Vapor Interface by Neural-Network Molecular Dynamics, J. Chem. Phys., 2020, 153, 144710 CrossRef CAS PubMed
 .
.
- P. Pattnaik, S. Raghunathan, T. Kalluri, P. Bhimalapuram, C. V. Jawahar and U. D. Priyakumar, Machine Learning for Accurate Force Calculations in Molecular Dynamics Simulations, J. Phys. Chem. A, 2020, 124, 6954–6967 CrossRef CAS PubMed
 .
.
- H. Ghorbanfekr, J. Behler and F. M. Peeters, Insights into Water Permeation through hBN Nanocapillaries by Ab Initio Machine Learning Molecular Dynamics Simulations, J. Phys. Chem. Lett., 2020, 11, 7363–7370 CrossRef CAS PubMed
 .
.
- Y. Zhang, H. Wang, W. Chen, J. Zeng, L. Zhang, H. Wang and E. Weinan, DP-GEN: A concurrent learning platform for the generation of reliable deep learning based potential energy models, Comput. Phys. Commun., 2020, 253, 107206 CrossRef CAS
 .
.
- L. Zhang, D.-Y. Lin, H. Wang, R. Car and E. Weinan, Active learning of uniformly accurate interatomic potentials for materials simulation, Phys. Rev. Mater., 2019, 3, 023804 CrossRef CAS
 .
.
- P. E. Blöchl, Projector augmented-wave method, Phys. Rev. B: Condens. Matter Mater. Phys., 1994, 50, 17953–17979 CrossRef PubMed
 .
.
- Y. Zhang and W. Yang, Comment on “Generalized Gradient Approximation Made Simple”, Phys. Rev. Lett., 1998, 80, 890 CrossRef CAS
 .
.
- G. Kresse and J. Furthmüller, Efficient iterative schemes for ab initio total-energy calculations using a plane-wave basis set, Phys. Rev. B: Condens. Matter Mater. Phys., 1996, 54, 11169–11186 CrossRef CAS PubMed
 .
.
- L. Goerigk and S. Grimme, A thorough benchmark of density functional methods for general main group thermochemistry, kinetics, and noncovalent interactions, Phys. Chem. Chem. Phys., 2011, 13, 6670 RSC
 .
.
- S. Grimme, J. Antony, S. Ehrlich and H. Krieg, A consistent and accurate ab initio parametrization of density functional dispersion correction (DFT-D) for the 94 elements H-Pu, J. Chem. Phys., 2010, 132, 154104 CrossRef PubMed
 .
.
- H. Wang, L. Zhang, J. Han and E. Weinan, DeePMD-kit: A deep learning package for many-body potential energy representation and molecular dynamics, Comput. Phys. Commun., 2018, 228, 178–184 CrossRef CAS
 .
.
-
M. Abadi, A. Agarwal, P. Barham, E. Brevdo, Z. Chen, C. Citro, G. S. Corrado, A. Davis, J. Dean, M. Devin, S. Ghemawat, I. Goodfellow, A. Harp, G. Irving, M. Isard, Y. Jia, R. Jozefowicz, L. Kaiser, M. Kudlur, J. Levenberg, D. Mane, R. Monga, S. Moore, D. Murray, C. Olah, M. Schuster, J. Shlens, B. Steiner, I. Sutskever, K. Talwar, P. Tucker, V. Vanhoucke, V. Vasudevan, F. Viegas, O. Vinyals, P. Warden, M. Wattenberg, M. Wicke, Y. Yu and X. Zheng, TensorFlow: Large-Scale Machine Learning on Heterogeneous Distributed Systems, arXiv, 2016, preprint, arXiv.1603.04467 [cs.DC] DOI:10.48550/arXiv.1603.04467.
- L. Zhang, J. Han, H. Wang, R. Car and E. Weinan, Deep Potential Molecular Dynamics: A Scalable Model with the Accuracy of Quantum Mechanics, Phys. Rev. Lett., 2018, 120, 143001 CrossRef CAS PubMed
 .
.
-
L. Zhang, J. Han, H. Wang, W. Saidi, R. Car and E. Weinan, Advances in Neural Information Processing Systems, Curran Associates, Inc., 2018, vol. 31 Search PubMed
 .
.
-
D. P. Kingma and J. Ba, Adam: A Method for Stochastic Optimization, arXiv, 2017, preprint, arXiv.1412.6980 [cs.LG] DOI:10.48550/arXiv.1412.6980.
- S. Plimpton, Fast Parallel Algorithms for Short-Range Molecular Dynamics, J. Comput. Phys., 1995, 117, 1–19 CrossRef CAS
 .
.
- H. J. C. Berendsen, J. P. M. Postma, W. F. van Gunsteren, A. DiNola and J. R. Haak, Molecular dynamics with coupling to an external bath, J. Chem. Phys., 1984, 81, 3684–3690 CrossRef CAS
 .
.
- A. Stukowski, Visualization and analysis of atomistic simulation data with OVITO–the Open Visualization Tool, Modell. Simul. Mater. Sci. Eng., 2010, 18, 015012 CrossRef
 .
.
- J. L. F. Abascal and C. Vega, A general purpose model for the condensed phases of water: TIP4P/2005, J. Chem. Phys., 2005, 123, 234505 CrossRef CAS PubMed
 .
.
- P. Mark and L. Nilsson, Structure and Dynamics of the TIP3P, SPC, and SPC/E Water Models at 298 K, J. Phys. Chem. A, 2001, 105, 9954–9960 CrossRef CAS
 .
.
- H. Ghasemi, A. Rajabpour and A. H. Akbarzadeh, Tuning thermal conductivity of porous graphene by pore topology engineering: Comparison of non-equilibrium molecular dynamics and finite element study, Int. J. Heat Mass Transfer, 2018, 123, 261–271 CrossRef CAS
 .
.
- M. Vohra, A. Y. Nobakht, S. Shin and S. Mahadevan, Uncertainty quantification in non-equilibrium molecular dynamics simulations of thermal transport, Int. J. Heat Mass Transfer, 2018, 127, 297–307 CrossRef CAS
 .
.
- S. Alosious, S. K. Kannam, S. P. Sathian and B. D. Todd, Kapitza resistance at water–graphene interfaces, J. Chem. Phys., 2020, 152, 224703 CrossRef CAS PubMed
 .
.
- Z. Zhao, C. Sun and R. Zhou, Thermal conductivity of confined-water in graphene nanochannels, Int. J. Heat Mass Transfer, 2020, 152, 119502 CrossRef CAS
 .
.
- Q.-X. Liu, P.-X. Jiang and H. Xiang, Molecular dynamics simulation of thermal conductivity of an argon liquid layer confined in nanospace, Mol. Simul., 2010, 36, 1080–1085 CrossRef CAS
 .
.
- M. Torkzadeh and M. Moosavi, A combined molecular dynamics simulation and quantum mechanics study on the physisorption of biodegradable CBNAILs on h-BN nanosheets, J. Chem. Phys., 2018, 149, 074704 CrossRef PubMed
 .
.
- M. Rajasekaran and K. G. Ayappa, Influence of the extent of hydrophobicity on water organization and dynamics on 2D graphene oxide surfaces, Phys. Chem. Chem. Phys., 2022, 24, 14909–14923 RSC
 .
.
- Z. Ge, D. G. Cahill and P. V. Braun, Thermal Conductance of Hydrophilic and Hydrophobic Interfaces, Phys. Rev. Lett., 2006, 96, 186101 CrossRef PubMed
 .
.
- M. Masuduzzaman and B. Kim, Scale Effects in Nanoscale Heat Transfer for Fourier's Law in a Dissimilar Molecular Interface, ACS Omega, 2020, 5, 26527–26536 CrossRef CAS PubMed
 .
.
Footnote |
| † Electronic supplementary information (ESI) available: Detailed training sets, LJ potential parameters and ITC results. See DOI: https://doi.org/10.1039/d2cp05530a |
|
| This journal is © the Owner Societies 2023 |
Click here to see how this site uses Cookies. View our privacy policy here.  a,
Xiaoyu
Tan
b,
Zhiwei
Fu
bc,
Linhua
Liu
 *ab and
Jia-Yue
Yang
 *ab
*ab


.
.
.
.
.
.
.
.
.
.
.
.
.
.
.
.
.
.
.
.
.
.
.
.
.
.
.
.
.
.
.
.
.
.
.
.
.
.
.
.
.
.
.
.
.
.
.
.
.
.
.
.
.
.
.


