An optical sensing platform for the detection of anti-cancer drugs and their cytotoxicity screening using a highly selective phosphorene-based composite†
Nasrin
Sultana
 ab,
Chingtham
Thanil Singh
 ab,
Mojibur R.
Khan
ab and
Neelotpal
Sen Sarma
 *ab
*ab
aInstitute of Advanced Study in Science and Technology, Paschim Boragaon, Guwahati-35, Assam, India. E-mail: neelot@iasst.gov.in
bAcademy of Scientific and Innovative Research (AcSIR), Ghaziabad-201002, India
First published on 13th October 2023
Abstract
Monitoring therapeutic drugs and their elimination is crucial because they may cause severe side effects on the human body. Methotrexate (MTX) is a widely used anti-cancer drug, which is highly expensive, and the detection of unwanted overdoses of MTX using traditional procedures is time-consuming and involves complex instrumentation. In this work, we have developed a nanocomposite material using phosphorene, cystine, and gold (Ph–Cys–Au) that shows excellent optical properties. This nanocomposite can be used as an optical sensing platform for the detection of MTX in the range 0–260 μM. The synthesized sensing platform is very sensitive, selective, and cost-effective for the detection of MTX. Ph–Cys–Au can effectively detect MTX in aqueous media with a limit of detection (LOD) of about 0.0266 nM (for a linear range of 0–140 μM) and 0.0077 nM (for a linear range of 160–260 μM). The nanocomposite is equally selective for real samples, such as human blood serum (HBS) and artificial urine (AU) with a LOD of 0.0914 nM and 0.0734 nM, respectively. We have also determined the limit of quantification (LOQ); the LOQ values for the aqueous media were 0.0807 nM (for a linear range of 0–140 μM) and 0.0234 nM (for a linear range of 160–260 μM), whereas, the values for HBS and AU were around 0.2771 nM and 0.2226 nM, respectively. Moreover, the nanocomposite also provides a feasible platform for cytotoxicity screening in cancerous cells (Caco-2 cell lines) and non-cancerous cells (L-929 cell lines).
1. Introduction
Effective clinical care is essential to be provided to patients who suffer from severe diseases and therefore there is a need for therapeutic drug monitoring (TDM) analysis. TDM involves the measurement of medication levels in the blood of humans to avoid toxicity resulting from the underdosing or overdosing of drugs.1 It mainly focuses on drugs with a narrow therapeutic range. To improve efficiency and decrease adverse side effects, it is suggested to monitor the drug with a narrow therapeutic window and significant pharmacokinetic variance. Therefore, there is a need for reliable, easy, and spot detection methods to minimize the side effects of such drugs. The World Health Organization listed methotrexate (MTX, namely 2,4-diamino-N-10-methyl folic acid) as one of the most essential anti-cancer and anti-folate drugs. When administered into the human body, it interferes with folic acid metabolism and leads to the blockage of de novo nucleotide synthesis, protein production, and cell proliferation.2 For the treatment of various carcinomas, such as breast, gastric, head, and neck cancers; acute lymphoblastic leukaemia (ALL); osteosarcoma; and choriocarcinoma, body surface area-based doses higher than 500 mg m−2 of MTX (denoted as HD-MTX) are given intravenously.3 It takes 1–2 hours to be absorbed inside the body once administered. Since MTX is highly toxic, it can prevent the growth of healthy cells, which limits its clinical recommendations. The most frequent cancer in children is acute lymphoblastic leukaemia, representing 25% of the malignancies where HD-MTX is crucial for the treatment.1,4 However, systemic toxicity and acute nephrotoxicity are the two main side effects of HD-MTX therapy.5 The MTX value of more than 10 μM in blood plasma is very dangerous for a period of 10 hours. This increase in the MTX level in blood results in some severe diseases, such as poisoning effects to the lungs, ulcers of the stomach, and heart stroke.6Considering all these issues, the development of fast and sensitive detection methodologies is required. The low safety window of MTX makes it necessary to monitor its therapeutic levels in the human body. There are several analytical methods for detecting MTX, such as surface plasmon resonance, surface-enhanced Raman scattering, high-performance liquid chromatography, electrolysis, immunoassays, radioimmunoassay, enzyme-multiplied immunoassay, protein binding, enzyme inhibition, microbiological assays, and electrochemical assays.1,3,7–10 In general, the high-pressure liquid chromatography (HPLC) method has been used to measure MTX in blood samples. The main disadvantage of these techniques is they are very complex and costly. These difficulties limit their use in rapid on-the-spot detection due to the employment of sophisticated and expensive instruments, complex sample preparation, and long analysis time.11 Therefore, there is a need to develop methods that are cost-effective, sensitive, and capable of detecting MTX on the spot. Compared to the techniques outlined earlier, the fluorescence technique has achieved a lot of attention because of the rapid response, remarkable sensitivity, easy operation method, low toxicity, and the ability to detect non-destructively.12,13 There are reports based on the fluorescence sensing of MTX.14,15 Fluorescence methods can be considered as one of the efficient tools to understand different fields in a better way. The main capability of fluorescence-based sensors is that of ‘seeing is believing’. The well-known mechanisms for the fluorescence-based sensing phenomenon are aggregation-induced emission (AIE),16 Förster Resonance Energy Transfer (FRET),17 inner filter effect (IFE),18 ratiometric detection,19 and photo-induced electron transfer (PET).20 Among all the methods, FRET is potentially more powerful as it effectively responds to the analytes by changing their colour, brightness, lifetime, as well as anisotropy. This kind of analytical method can be carried out in real-time, is mostly free of different developing steps, including enzymatic amplification and washes, and is also suitable for intracellular sensing.21 However, there are many fluorescence-based reports where researchers have used different 2D materials such as graphene, organic polymers, metal–organic frameworks (MOFs), covalent organic frameworks (COFs), MoS2, WS2, TMDs, etc.22–24 All these materials involve hazardous chemicals, the synthetic procedures are time-consuming, and all have limited uses due to their production procedures. Therefore, a quick, sensitive, and affordable sensor system made of eco-friendly materials is required to overcome such difficulties.
Phosphorene (Ph) is considered one of the most versatile platforms among all the formerly evolved two-dimensional materials, due to its fascinating properties. It is a mono-elemental 2D material made up of phosphorus atoms obtained from the delamination of bulk black phosphorus (BP). BP has a layered structure with SP3 hybridization. The BP nanosheets are held together by van der Waals interactions, and the interlayer spacing is about 0.53 nm. It possesses many unique electrical, optical, and electro-chemical properties. It also shows high carrier mobility, mechanical strength, biocompatibility, and high tensile strength, which make it efficient for different applications ranging from biomedical to electronic device fabrication. One of the important features of Ph is its band gap tunability, which enables the fabrication of prototype devices that can be useful for different fields such as field effect transistors, batteries, solar cells, transistors, etc.25 It also shows significant molecular absorptivity26 and is known to have low cytotoxicity, which is suitable for fabricating sensors for healthcare applications.27–34
However, Ph is very sensitive to air. There are different strategies for stabilizing Ph by modification, such as molecular modification and ionic modification using different molecules and ions. Therefore, we aimed to develop a composite that stabilizes phosphorene and enhances its properties.35 In our earlier work, we have seen that functionalization, as well as the reduction of phosphorene, may lead to the enhancement of its physical and chemical properties and can thus be applied to diverse fields. In this work, for the first time, we have successfully synthesized a composite of phosphorene-cystine-gold (Ph–Cys–Au) using a simple one-step hydrothermal approach. The notable optical properties of the synthesized nanoparticles inspired us to develop some fluorescence-based sensors for the detection of MTX. The designed biosensor displays different advantages such as sensitivity, selectivity, and cost-effectiveness and can detect MTX in real samples such as human blood serum and artificial urine. We believe that the development of such an innovative sensor with high selectivity as well as sensitivity can have a significant impact on the research community for the detection of MTX.
Apart from optical properties, we have also analyzed the cytotoxicity of the synthesized material as well as the composite of the material and MTX. To check the cytotoxicity, we used Caco-2 (human colorectal adenocarcinoma) and L-929 (mouse fibroblast) cell lines. The methyl thiazolyl tetrazolium (MTT) assay has been used to assess the cytotoxicity.
2. Experimental section
2.1 Materials and methods
2.1.1.1 Synthesis of black phosphorous (BP). For the synthesis of mineralizer SnI4, tin powder (1.2 g, 99.995%, Chempur) and iodine (4.0 g, resublimed, 99.999%, Chempur) were mixed in 25 mL of toluene. The obtained solution was then refluxed for about 30 minutes until the violet colour of the iodine disappeared, which was followed by decantation. The resultant crystallized product was recrystallized with the help of toluene and was allowed to dry at room temperature.
Gold-stannane (AuSn) was prepared using gold and tin in a sealed, air-free silica ampoule. To melt down the starting material, an H2/O2 burner was used.
Next, 500 mg of Red P and 348 mg of AuSn were placed in a silica ampoule with an inner diameter of 10 mm and a length of 10 cm to synthesize BP, and after that, SnI4 was added into the same ampoule. The ampoule was then evacuated to a pressure below 10−3 mbar and sealed with a H2/O2 burner. The ampoule was then heated for 3 h at 673 K inside a muffle furnace, followed by maintaining the temperature at 873 K for 23 hours. It was then cooled to 773 K with a cooling rate of 40 K h−1 and maintained there until the completion of the reaction. The ampoule was then allowed to cool at room temperature within 4 h, which led to the formation of BP crystals.36
2.1.1.2 Synthesis of phosphorene and Ph–Cys–Au nanodots. The dispersion of 2D BP followed by sonication-assisted liquid-phase exfoliation in an ice bath led to the formation of phosphorene (Ph). In a round-bottom flask, 100 mL of deionized water was taken, which was then bubbled with nitrogen for 10 minutes to eliminate the dissolved oxygen. To this, 20 mg of BP crystals were added after grinding using a mortar and pestle and the flask was sealed immediately. The mixture was then sonicated for about 8 hours in an ice bath. The prepared solution contained homogeneous 2D few-layer BP (FLBP) nanosheets or phosphorene (Ph).37
Ph–Cys–Au nanodots were synthesized by adopting a previously reported hydrothermal procedure with a minor modification.38 Firstly, 20 mL of Ph (0.1 M) and 2 mL of cystine (0.1 M) were mixed in a beaker and stirred for about 30 minutes. After that, 1 mL of HAuCl4 solution and a few drops of NaBH4 were added and stirred for another 30 minutes using a magnetic stirrer. The obtained purple solution was poured into an autoclave and then placed in a hydrothermal reactor chamber and heated to 165 °C for 15 hours. The following scheme depicts the synthetic pathway of the nanocomposite (Scheme 1)
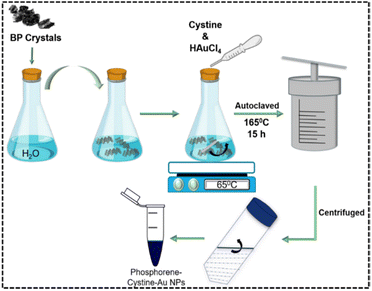 | ||
| Scheme 1 Schematic representation of the synthesis of phosphorene-cystine-Au NPs from bulk BP crystals. | ||
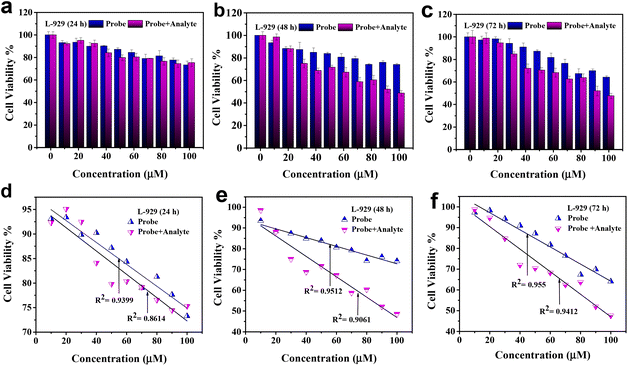
2.1.1.3 Assessment of cytotoxicity. For the cytotoxicity assay, Caco-2 and L-929 cells were seeded in 96-well plates at 1 × 10⁴ viable cells per mL and incubated overnight. The cells were then treated with a culture medium containing different concentrations of Ph–Cys–Au and Ph–Cys–Au+MTX (10, 20, 30, 40, 50, 60, 70, 80, 90, and 100 μM). The non-treated cells were taken as the control. The cells were then incubated for 24, 48, and 72 hours. After treatment, 100 μL of MTT (0.5 mg mL−1)-containing medium was added to each well. The plates were then incubated at 37 °C with 5% CO2 for 4 hours. The dark blue formazan crystals formed were then dissolved using DMSO for 10 minutes at room temperature to ensure complete solubilization. The absorbance of the solubilized formazan was measured at 570 nm using a microplate reader (Thermo Scientific Multiskan SkyHigh Microplate Spectrophotometer). This measurement reflects the metabolic activity and viability of the cells. Cell viability (%) was calculated using the following formula:
| Cell viability% = [A(sample)/A(Control)] × 100 |
The obtained data were represented as means ± SD (standard deviation) from at least three independent experiments.
2.2 Characterization techniques
The optical properties of the material were investigated using a Cary Eclipse spectrophotometer with a scan rate of about 240 nm s−1 and a halogen lamp source for excitation. For the analysis of fluorescence spectra, the excitation and emission spectra were obtained at a 5 nm slit with an applied voltage of 700 V. All the fluorescence measurements were carried out using quartz cells (4 × 1 × 1 cm) with vacuum Teflon stopcocks.
3. Results and discussion
3.1 Morphological and structural analysis of the synthesized Ph–Cys–Au NPs
The structural and morphological analysis of prepared Ph–Cys–Au was carried out with the help of different analytical techniques as discussed below.Fig. 1(a and b) shows the characteristic UV-Vis peaks of phosphorene and phosphorene, cystine, and gold nanoparticles. The absorbance spectra of the synthesized composite were in the range of 200–700 nm. A sharp absorption peak was observed at 213 nm, which might be related to the structure of phosphorene. Au NPs had a prominent peak at about 550 nm that is regarded as a characteristic absorbance peak.39 There was also a peak at 304 nm, which is a characteristic peak of cysteine. The spectrum of the Ph–Cys–Au NPs composite showed three prominent peaks for Ph, Cys, and Au NPs. The absorption peak in the visible region was weakened and presented a plateau. This confirmed that the composite is comprised of three components.40
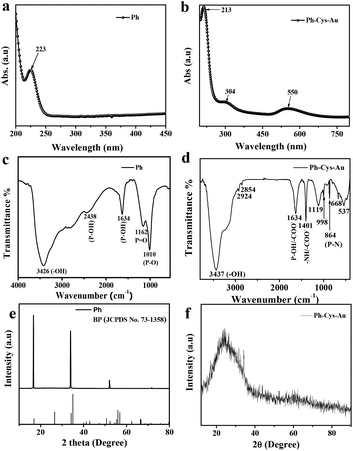 | ||
| Fig. 1 UV-Vis spectra of (a) Ph and (b) Ph–Cys–Au. FT-IR spectra of (c) Ph and (d) Ph–Cys–Au. XRD patterns of (e) Ph and (f) Ph–Cys–Au. | ||
In Fig. 1(c), the FTIR spectrum of phosphorene shows a prominent peak at 3426 cm−1, corresponding to –OH stretching vibrations. The material also exhibited P–O–H stretching and bending at 2438 cm−1 and 1634 cm−1, respectively. Apart from that, 1162 cm−1 and 1010 cm−1 peaks were observed for P![[double bond, length as m-dash]](https://www.rsc.org/images/entities/char_e001.gif) O and P–O, respectively.41 However, in the case of the Ph–Cys–Au composite (Fig. 1(d)), it exhibited characteristic peaks at 3437 cm−1, 2924 cm−1, and 2854 cm−1, corresponding to –OH stretching, asymmetric –CH stretching, and symmetric –CH stretching, respectively. They also exhibited different characteristic peaks, where 1634 cm−1 corresponds to –COO− stretching and P–O–H stretching, 1401 cm−1 corresponds to symmetric –COO− stretching and –NH in-plane stretching, 1119 cm−1, 998 cm−1, and 864 cm−1 correspond to P
O and P–O, respectively.41 However, in the case of the Ph–Cys–Au composite (Fig. 1(d)), it exhibited characteristic peaks at 3437 cm−1, 2924 cm−1, and 2854 cm−1, corresponding to –OH stretching, asymmetric –CH stretching, and symmetric –CH stretching, respectively. They also exhibited different characteristic peaks, where 1634 cm−1 corresponds to –COO− stretching and P–O–H stretching, 1401 cm−1 corresponds to symmetric –COO− stretching and –NH in-plane stretching, 1119 cm−1, 998 cm−1, and 864 cm−1 correspond to P![[double bond, length as m-dash]](https://www.rsc.org/images/entities/char_e001.gif) O, P–O, and P–N bonds, respectively.42,43 There were also peaks at 668 cm−1 and 536 cm−1, which correspond to C–S and S–S stretching, respectively.44
O, P–O, and P–N bonds, respectively.42,43 There were also peaks at 668 cm−1 and 536 cm−1, which correspond to C–S and S–S stretching, respectively.44
As shown in Fig. 1(e and f), the X-ray diffraction analysis was performed to study the structural morphologies of Ph crystals and Ph–Cys–Au composites. The liquid exfoliated Ph nanosheets (Fig. 1(e)) showed sharp peaks at 2θ = ∼16.830° for the (002) plane, ∼34.118° for the (004) plane, and ∼52.242° for the (006) crystal plane, which are in accordance with previous studies and match the standard pattern for BP (JCPDS No. 73-1358).28 The obtained d-spacings were 2.265, 2.62, and 1.749 Å, corresponding to (002), (004), and (006) crystallographic planes of Ph, respectively.45 After the hydrothermal treatment of exfoliated Ph with cystine and HAuCl4, the phosphorene sheets were reduced, and a 2θ value of about 24.84° was observed, which confirmed the composite formation of Ph–Cys–Au (Fig. 1(f)).46
As shown in Fig. 2, for the morphological analysis, we analyzed the transmission electron microscopic images of Ph and Ph–Cys–Au nanospheres. Fig. 2(a and b) confirms the formation of sheets on the scale of 200 nm and 500 nm as per earlier studies.47 Upon being treated with cystine and HAuCl4, the sheets broke down to form nanoparticles, which can be seen from the transmission electron microscopic images as shown in Fig. 2(c and d).
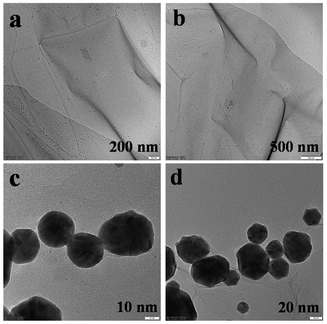 | ||
| Fig. 2 (a and b) Transmission electron microscopy images of Ph nanosheets (200 nm and 500 nm); (c and d) nanospheres of Ph–Cys–Au (10 nm and 20 nm). | ||
We also conducted the elemental mapping of the elements present in Ph–Cys–Au, i.e., P, Au, C, N, and S, using a field emission-scanning electron microscope (SIGMA VP FESEM, ZEISS) as shown in Fig. S1 in the ESI.†
Atomic force microscopy (AFM) was also conducted on exfoliated phosphorene in H2O as shown in Fig. S2 (ESI).† The AFM images were obtained at 1 μm × 1 μm and 2 μm × 2 μm scales for different shapes and sizes. We carried out the analysis by drop-casting on a glass slide. We also analysed the height profile and it was observed that in the case of the 2 μm × 2 μm scale, the average thickness was about 60.5 nm. However, in the case of the 1 μm × 1 μm scale, the average thickness was about 45 nm.
3.2 Sensing experiments
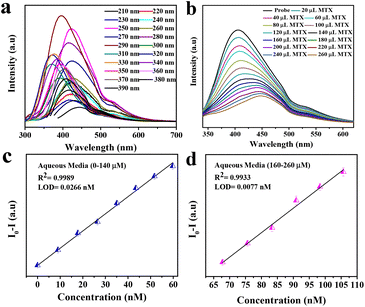
The synthesized material has a very high fluorescence intensity and it showed an eventual decrease in the fluorescence intensity when the desired analyte was present. These fluorescence-based sensors are very useful for visual detection and they are practically more applicable. The real sample analysis was also carried out in the case of human blood serum (HBS) and artificial urine (AU) to check the practical applicability in the linear range of 0 to 260 μL. We also calculated the change in concentration after adding different concentrations of MTX, and it was found to be in the range of 9–105.69 μM. Fig. 3(b) shows the quenching of the probe intensity with an increase in the concentration of MTX. We also plotted the calibration curve (Fig. 3c and d) to determine the LOD using the following equation:
| LOD = 3.3 × RSD/slope |
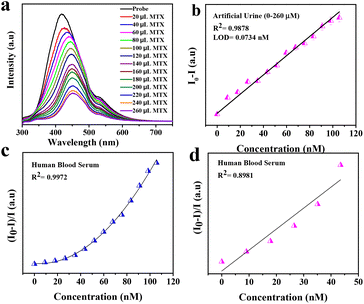
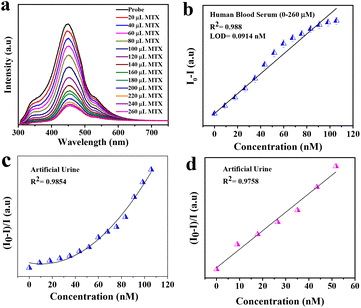
It was found that the LODs in the case of aqueous media were 0.0266 nM and 0.0077 nM for the linear range (0–260 μL). For real samples such as artificial urine (AU) and human blood serum (HBS), we carried out the same experimental procedures and found that the LODs were 0.0734 nM and 0.0.0914 nM, respectively. This implies that Ph–Cys–Au is not only suitable for the detection of MTX in aqueous media but also in real samples.
We also calculated the limit of quantification using the following equation:
| LOQ = 10 × RSD/slope |
Using the equation above, we obtained the LOQ values for aqueous media, as well as those of the real samples. The values obtained for aqueous media were 0.0807 nM (for a linear range 0–140 μL) and 0.0234 nM (for a linear range160–260 μL), whereas, for real samples HBS and AU, the values were about 0.2771 nM and 0.2226 nM, respectively.
Apart from the LOD and LOQ, we also calculated the quantum yield of the synthesized material, which was found to be about 26.17%. The quantum yield of the fluorophore was determined with the help of an existing procedure, where we took quinine sulphate as a reference.48 Firstly, quinine sulphate was dissolved in H2SO4 (0.1 M). H2SO4 has a refractive index of η = 1.33. The solvent used for the material synthesis was deionized water with a refractive index of η = 1.33. The fluorescence spectra were recorded with an excitation wavelength of about 290 nm. The obtained data were plotted, and the slopes for the reference and the fluorophore were determined. After that, by using the following equation, we calculated the quantum yield:
| I0/I = 1 + Ksv[Q] |
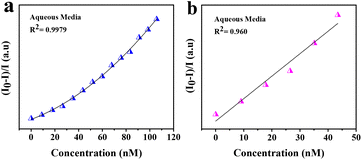 | ||
| Fig. 4 Stern–Volmer plots of turn-off sensing in the range 0–260 μL in aqueous media: (a) polynomial fit and (b) linear fit. | ||
To differentiate between dynamic and static quenching and to gain more insight into the mechanism, a TRPL study was carried out. Fig. S7† in the supplementary file shows the TRPL spectra of the probe in the presence and absence of an analyte, i.e., MTX. The PL lifetime of the material changed in the presence of the analyte, which suggests dynamic quenching via electron transfer between the excited state donor atom and the acceptor. The χ2 value for the probe was found to be 2.4 ns, whereas, in the presence of the analyte, this lifetime decreased to 1.9 ns, which favours dynamic quenching.
4. Mechanistic insight into the sensor
The mechanism associated with fluorescence-based sensing can be evaluated with the help of the Stern–Volmer plot and TRPL study. The general mechanisms that have been employed with fluorescence-based sensors are the IFE, PET, ACQ, and FRET. In this case, the main driving force responsible for quenching is the FRET that is taking place and this can be confirmed using different experimental evidence. In FRET, the light emitted by the fluorophore, i.e., the probe, is absorbed by the analyte, which causes fluorescence quenching. This can be confirmed by the overlap of the emission spectrum of the fluorophore with the absorption spectrum of the quencher, as shown in Fig. S8 (ESI).† In this case, Ph–Cys–Au acts as a donor, and MTX acts as an acceptor, as shown in the figure. We have also calculated the overlapping area between the emission spectrum of the probe and the UV-visible spectrum of the analyte, and it was found to be about 33.293, which confirms the energy transfer between the probe and the analyte. The presence of FRET was further confirmed by the TRPL spectra, as shown in Fig. S7 (ESI).† As discussed earlier, the lifetime of the acceptor decreases as compared to the donor atom. The FRET efficiency of the system can be determined using the following equation:| E = 1 − (τDA/τD) |
Using the above equation, we calculated the FRET efficiency, which was found to be about 0.2083 (20.83%). This FRET efficiency signifies the interaction between the fluorophore and the acceptor molecule as shown in Scheme 2.
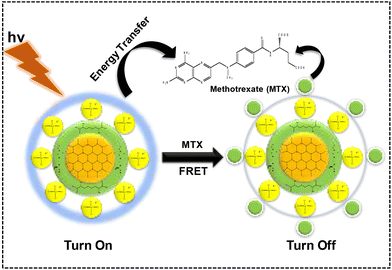 | ||
| Scheme 2 Schematic representation of the interaction of the probe with the analyte via the FRET mechanism. | ||
4.1 Interaction
There are several mechanisms associated with FRET, and one of them is the electrostatic interaction. For FRET to occur, the donor fluorophore, as well as the acceptor molecule, must be in close proximity, which will then lead to the electrostatic interaction. The measurement of zeta potential values in aqueous media in Fig. S9 (ESI†) showed the potential value of −27.2 eV and −25.3 eV for Ph and Ph–Cys–Au, respectively. After the interaction of Ph–Cys–Au with MTX, the potential value decreased to −18.3 eV. This prominent change in the zeta potential value corresponds to the accumulation of charge. Therefore, we can say that the interaction between the donor and the acceptor molecule is electrostatic.The fluorescence quenching can also be confirmed from the H-bonding which can be done by the analysis of FTIR spectra between the quencher and the probe as shown in Fig. S10 (ESI).†![[thin space (1/6-em)]](https://www.rsc.org/images/entities/char_2009.gif) 49 Due to the presence of electron-withdrawing groups in methotrexate (MTX), such as –COOH, –CONH–, and –NH2 groups, they can readily form H-bonding with the functional group present in the probe. All the peaks that were present in the fluorophore remain unchanged. Among all the peaks, some of them show a minor shifting while in interaction with the quencher, which suggests H-bonding. However, two of the peaks, i.e., 1401 cm−1 and 1119 cm−1, changed to 1385 cm−1 and 1094 cm−1, respectively. The 1385 cm−1 and 1094 cm−1 peaks correspond to the –NO and –CH groups, which means that there may be an interaction between the P–OH and –COO− groups present in the fluorophore and the –NH2 group present in the analyte. The peaks that were changed are listed in Table S1 (ESI).†
49 Due to the presence of electron-withdrawing groups in methotrexate (MTX), such as –COOH, –CONH–, and –NH2 groups, they can readily form H-bonding with the functional group present in the probe. All the peaks that were present in the fluorophore remain unchanged. Among all the peaks, some of them show a minor shifting while in interaction with the quencher, which suggests H-bonding. However, two of the peaks, i.e., 1401 cm−1 and 1119 cm−1, changed to 1385 cm−1 and 1094 cm−1, respectively. The 1385 cm−1 and 1094 cm−1 peaks correspond to the –NO and –CH groups, which means that there may be an interaction between the P–OH and –COO− groups present in the fluorophore and the –NH2 group present in the analyte. The peaks that were changed are listed in Table S1 (ESI).†
5. Interference study
One of the key characteristics of the ideal sensor is its sensitivity and selectivity towards the specific analyte of choice, even in the presence of other interfering molecules. We have investigated the PL intensity with several antibiotics, certain amino acids, and some ions that can interfere to establish the selectivity of the created system. In the case of antibiotics, we have taken amoxicillin trihydrate (AMOT), azaerythromycin (AZAE), cephalothin sodium salt (CF), cephalexin hydrate (CFL), chloramphenicol (CFP), cefuroxime sodium salt (CFR), colistin sulphate (CLS), cloxacillin sodium (CSX), ivermectin (IVM), nalidixic acid (NA), penicillin sodium salt (PNL), streptomycin sulfate (STM), ursodeoxycholic acid (UDCS), and vancomycin (VNC) to check their efficacy for the sensor as shown in Fig. S11(a) (ESI).† Apart from these antibiotics, we have also checked the efficacy with some commonly found interfering molecules in real samples, such as aspartic acid, alanine, glycine, glutamic acid, serine, proline, ascorbic acid, Na+, K+, NH4+, and Cl−. We observed that the developed sensor system is very selective towards MTX, irrespective of any other interfering agents such as antibiotics, amino acids, and ions. Fig. S11(b and c) in the ESI† displays bar diagrams with these results.6. Real sample analysis
Generally, an MTX value above 10 μM is very dangerous for a period of 10 hours.6 The practical applicability of the synthesized material has been investigated by PL quenching efficiency in real samples such as artificial urine (AU) and human blood serum (HBS), as shown in Fig. 5 and 6.50 Using the calibration curve methods, the simultaneous determination of LOD in AU and HBS was accomplished by spiking various amounts of analyte ranging from 0–260 μL. The trends observed in both cases can be correlated to the results obtained in the case of the aqueous media. In both cases, the fluorescence efficiency decreases effectively with an increase in the analyte volume, as observed in Fig. 5(b) and 6(b). From the calibration curve, we calculated the LOD values for both media and they were found to be about 0.0914 nM and 0.0734 nM for HBS and AU, respectively. Along with LOD, we also calculated the LOQ values, which were found to be about 0.2771 nM and 0.2226 nM for HBS and AU, respectively. Further, to check the mechanism, we plotted the Stern–Volmer curve and observed similar trends just like the aqueous media, as shown in Fig. 5(c & d) and 6(c & d) to confirm that, in this case, the FRET mechanism is also at work.To determine the relative standard deviation (RSD), we carried out three consecutive measurements. To assess the accuracy of this method, we determined the recovery rate of the spiked amount, which was found to be in the ranges of 95.24–107.85% and 91.47–123.39% in the case of AU and HBS, respectively. As shown in Table 1, the RSD from 0.188% to 1.5426% and 0.1922% to 0.8715% for AU and HBS, respectively, indicate the high sensitivity and reliability of the sensor for the detection of MTX in real samples. Therefore, it can be inferred from these measurements that the current system is not only applicable to an aqueous media but is also equally effective for real samples.
| Real samples | Sl No. | Spiked (μM) | Found (μM) | Recovery (μM) | RSD |
|---|---|---|---|---|---|
| Artificial urine | 1 | 20 | 20.76 | 103.8 | 0.010697 |
| 2 | 40 | 43.14 | 107.85 | 0.015426 | |
| 3 | 60 | 58.97 | 98.28 | 0.005309 | |
| 4 | 80 | 83.63 | 104.53 | 0.007002 | |
| 5 | 100 | 103.55 | 103.55 | 0.002583 | |
| 6 | 120 | 119.20 | 99.33 | 0.001122 | |
| 7 | 140 | 133.34 | 95.24 | 0.00221 | |
| 8 | 160 | 160.23 | 100.14 | 0.005273 | |
| 9 | 180 | 181.21 | 100.67 | 0.006312 | |
| 10 | 200 | 195.36 | 97.68 | 0.009779 | |
| 11 | 220 | 226.64 | 103.01 | 0.002315 | |
| 12 | 240 | 239.99 | 99.99 | 0.00576 | |
| 13 | 260 | 255.95 | 98.44 | 0.001388 | |
| Human blood serum | 1 | 20 | 22.04 | 100.18 | 0.008715 |
| 2 | 40 | 36.59 | 91.47 | 0.006302 | |
| 3 | 60 | 61.23 | 102.05 | 0.004274 | |
| 4 | 80 | 85.04 | 106.3 | 0.002385 | |
| 5 | 100 | 116.18 | 116.18 | 0.001954 | |
| 6 | 120 | 148.07 | 123.39 | 0.006043 | |
| 7 | 140 | 169.25 | 120.89 | 0.002919 | |
| 8 | 160 | 184.83 | 115.51 | 0.002302 | |
| 9 | 180 | 192.71 | 107.06 | 0.002097 | |
| 10 | 200 | 205.84 | 102.92 | 0.007148 | |
| 11 | 220 | 214.35 | 97.43 | 0.001922 | |
| 12 | 240 | 221.61 | 92.33 | 0.00481 | |
| 13 | 260 | 223.86 | 86.10 | 0.005827 |
7. Comparative study
In the literature, there are various techniques for MTX detection. However, our synthesized sensor has numerous advantages that make it a potential material of choice for the detection of MTX. The following are the primary benefits of our work:1. Cost-effective: Fluorescence-based measurements do not require any sophisticated instrument facility. The detection method is simple and does not involve complicated steps, ensuring practical applicability. Our sensor outperforms all the currently available existing sensors based on its effectiveness, sensitivity, and cost. In addition, in electrochemical analysis, strips used for the detection of bio-molecules are employed with some expensive electrochemical cells with imprinted electrodes; our approach is cost-effective as it does not involve the use of enzymes.
2. Appreciable detection limit: The synthesized Ph–Cys–Au composite is effective for the detection of MTX with a detection limit of about 0.0266 nM (0–140 μL) and 0.0077 nM (160–260 μL) in a linear range of 0–260 μL.
3. Efficacy toward real samples: This fluorescence-based measurement is also applicable for the analysis of real samples, such as HBS and AU. The corresponding detection limits for HBS and AU are 0.0914 nM and 0.0734 nM, respectively. Our biosensor was compared with other reported sensors for the detection of MTX and is listed in Table 2 below.
| Materials | Methods | Linear range | LOD | Ref. |
|---|---|---|---|---|
| S, N Co-doped carbon QDs | Optical | 1–300 μM L−1 | 0.33 μM L−1 | 51 |
| AgNPs | SPRS | 5–150 μM L−1 | 2.1 μM L−1 | 1 |
| Amine-functionalized silica carbon polymer dots (APTES-CPDs) | Fluorescent | 10–2.0 μg mL−1 and 2.0–50 μg mL−1 | 10 ng mL−1 and 2.0 μg mL−1 | 52 |
| Au-Capped NP | Electrochemical | 0.43–2 μM | 0.13 μM | 3 |
| 1.81–5 μM | 0.55 μM | |||
| Au NPs (core-shells satellite microspheres (CSSM)-modified capillaries) | Electrochemical | 0.1 nM–110 nM | — | 53 |
| Modified Ag substrate | SERS | 1 × 10–16–1 × 10⁻⁶ mol L−1 | 1 × 10–16 mol L−1 | 54 |
| Poly(L-cysteine)/g-C3N4 | Electrochemical | 7.5–780 μM | 0.11841 μA μM−1 and 6 nM | 55 |
| Ph–Cys–Au | Fluorescence | 0–260 μL | 0.0266 nM (0–140 μM) and 0.0077 nM (160–260 μM) | This work |
8. Cytotoxicity screening
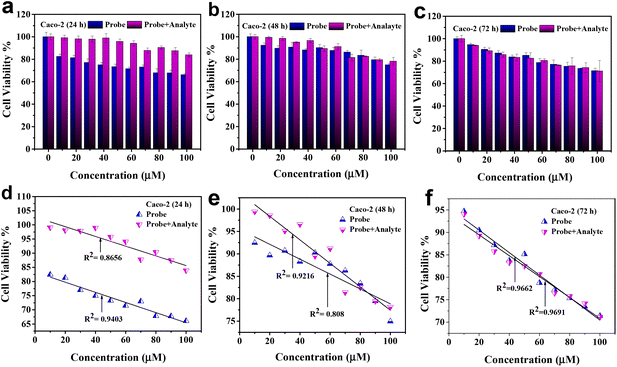
The cytotoxicity of Ph–Cys–Au and Ph–Cys–Au+MTX on Caco-2 and L-929 cell lines was investigated by treating the cells with increasing concentrations (10, 20, 30, 40, 50, 60, 70, 80, 90, and 100 μM) for different periods, i.e., 24, 48, and 72 hours, respectively, as shown in Fig. 7 and 8.In the case of the Caco-2 cell line, Ph–Cys–Au exhibited toxicity at a concentration above 80 μM after 24 hours of treatment <70% (Fig. 7(a)). However, no toxicity was observed toward the Caco-2 cell line for Ph–Cys–Au after 48 and 72 hours (Fig. 7(b and c)) of treatment. On the other hand, Ph–Cys–Au+MTX did not show any toxicity to the Caco-2 cell line, regardless of the concentration or treatment duration. Fig. 7(d, e and f) shows the calibration curves.
In contrast, the L-929 cell line exhibited different responses to Ph–Cys–Au and Ph–Cys–Au+MTX. Ph-Cys-Au showed toxicity, resulting in decreased cell viability, only at a concentration above 80 μM after 72 hours (Fig. 8(c)) of treatment. However, no toxicity was observed for Ph–Cys–Au at 24 h and 48 h of treatment in the L-929 cell line (Fig. 8(a and b)). On the other hand, Ph–Cys–Au+MTX showed toxicity to the L-929 cell line at lower concentrations and earlier time points. Specifically, Ph–Cys–Au+MTX displayed toxicity at a concentration as low as 40 μM after 48 h and 72 h of treatment in the L-929 cell line (Fig. 8(b and c)). Fig. 8(d, e and f) shows the calibration curves for the same.
These results indicate that the probe has a cytotoxic effect on the Caco-2 cell line at higher concentrations and shorter treatment durations, and it seems that Caco-2 neutralized its toxicity after 48 h and 72 h of treatment. However, the Probe + analyte did not exhibit cytotoxicity toward this cell line. In contrast, the probe showed cytotoxicity in the L-929 cell line only after prolonged treatment at higher concentrations. Probe + analyte, on the other hand, demonstrated toxicity in the L-929 cell line at lower concentrations and earlier time points. The observed cytotoxicity patterns suggest that the response to the probe and probe + analyte is dose- and cell-line-dependent. It is important to consider these differences in cytotoxicity when evaluating the potential use of Ph–Cys–Au and Ph–Cys–Au+MTX in therapeutic applications. Further investigations are necessary to elucidate the underlying mechanisms of the observed cytotoxic effects and to assess their selectivity and specificity in different cell types.56
9. Conclusion
Herein, we report a one-step synthesis of Ph–Cys–Au from precursors black phosphorus, cystine, and HAuCl4 using a simple hydrothermal process. Characterization was done using different analytical methods such as UV-visible spectroscopy, FTIR spectroscopy, PXRD, TEM, etc. We have introduced an effective FRET-based quenching approach to detect the anti-cancer drug methotrexate in aqueous media as well as in real samples such as human blood serum (HBS) and artificial urine (AU), making it suitable for practical applicability. This approach is cost-effective and selective as compared to other traditional methods. In aqueous media, the limits of detection of about 0.0266 nM (for a linear range of 0–140 μL) and 0.0077 nM (for a linear range of 160–260 μL) were achieved. The proposed sensing platform can effectively detect MTX in real samples. It showed a limit of detection of about 0.0734 nM and 0.0914 nM in the case of AU and HBS, respectively. Thus, we can conclude that our developed material can detect MTX in aqueous media, as well as real samples.The noted cytotoxicity patterns imply that the responses to Ph–Cys–Au and Ph–Cys–Au+MTX depend on the dose and the cell lines used. Thus, to assess the potential therapeutic applications of Ph–Cys–Au and Ph–Cys–Au+MTX, it is crucial to take these variations into account. It is necessary to conduct additional studies to determine the underlying factors of the reported cytotoxic effects as well as their selectivity and specificity.
We hope that this information regarding the developed material, as well as the detection process, will help the scientific community to understand the properties of the emerging material and their efficiency in the field of optical sensing applications. Apart from optical sensing, the cytotoxicity assessment can help to determine how the material behaves with cancerous as well as non-cancerous cell lines, including when they come in contact with anti-cancer drugs.
Author contributions
Nasrin Sultana: conceptualization, methodology, data curation, formal analysis, writing the original draft. Chingtham Thanil Singh: contributed to experiment analysis. Mojibur R. Khan: resources, review & editing of biological analysis. Neelotpal Sen Sarma: supervision, resources, review & editing, funding acquisition.Conflicts of interest
There is no conflict of interest.Acknowledgements
Nasrin Sultana would like to thank the Department of Science and Technology (DST) for providing the INSPIRE fellowship (IF190428). Chingtham Thanil Singh would like to thank CSIR India for the fellowship. Neelotpal Sen Sarma and Mojibur R Khan would like to thank DST India for all the support. We would like to thank Tom Nilges of the TUM Graduate School and the IRTG 2020 Alberta/Technical University of Munich International Graduate School (ATUMS) for the material BP. The authors would like to thank the Sophisticated Analytical Instrumentation Centre (SAIC), IASST, for the instrument facility.References
- Y. Göksel, K. Zor, T. Rindzevicius, B. E. Thorhauge Als-Nielsen, K. Schmiegelow and A. Boisen, Quantification of methotrexate in human serum using surface-enhanced Raman scattering—Toward therapeutic drug monitoring, ACS Sens., 2021, 6(7), 2664–2673 Search PubMed.
- S. C. Howard, J. McCormick, C. H. Pui, R. K. Buddington and R. D. Harvey, Preventing and managing toxicities of high-dose methotrexate, Oncologist, 2016, 21(12), 1471–1482 Search PubMed.
- Y. Goksel, E. Dumont, R. Slipets, S. T. Rajendran, S. Sarikaya, L. H. Thamdrup, K. Schmiegelow, T. Rindzevicius, K. Zor and A. Boisen, Methotrexate Detection in Serum at Clinically Relevant Levels with Electrochemically Assisted SERS on a Benchtop, Custom Built Raman Spectrometer, ACS Sens., 2022, 7(8), 2358–2369 Search PubMed.
- S. Jeha and C. H. Pui, in Clinical Manifestations and Treatment of Childhood Acute Lymphoblastic Leukemia, Elsevier Inc., 7th edn, 2018, DOI:10.1016/B978-0-323-35762-3.00065-2.
- B. D. Menz, S. L. Stocker, N. Verougstraete, D. Kocic, P. Galettis, C. P. Stove and S. E. Reuter, Barriers and opportunities for the clinical implementation of therapeutic drug monitoring in oncology, Br. J. Clin. Pharmacol., 2021, 87(2), 227–236 Search PubMed.
- I. N. Qureshi, A. Tahira, K. Aljadoa, A. M. Alsalme, A. A. Alothman, A. Nafady, A. Karsy and Z. H. Ibupoto, Polyaniline as a sacrificing template for the synthesis of controlled Co3O4 nanoparticles for the sensitive and selective detection of methotrexate (MTX), J. Mater. Sci.: Mater. Electron., 2021, 32(11), 15594–15604 Search PubMed.
- S. S. Zhao, N. Bukar, J. L. Toulouse, D. Pelechacz, R. Robitaille, J. N. Pelletier and J. F. Masson, Miniature multi-channel SPR instrument for methotrexate monitoring in clinical samples, Biosens. Bioelectron., 2015, 64, 664–670 Search PubMed.
- A. A. Khand, S. A. Lakho, A. Tahira, M. Ubaidullah, A. A. Alothman, K. Aljadoa, A. Nafady and Z. H. Ibupoto, Facile electrochemical determination of methotrexate (MTX) using glassy carbon electrode-modified with electronically disordered NiO nanostructures, Nanomaterials, 2021, 11(5), 1266 Search PubMed.
- N. Salandari-Jolge, A. A. Ensafi and B. Rezaei, A novel three-dimensional network of CuCr 2 O 4/CuO nanofibers for voltammetric determination of anticancer drug methotrexate, Anal. Bioanal. Chem., 2020, 412, 2443–2453 Search PubMed.
- Z. Song, Y. Wang, Y. Dong, K. Xu, H. Long, C. Deng, Y. Yin, S. A. Eremin, M. Meng and R. Xi, A validated chemiluminescence immunoassay for methotrexate (MTX) and its application in a pharmacokinetic study, Anal. Methods, 2016, 8(1), 162–170 Search PubMed.
- V. Kumar, B. Maiti, M. K. Chini, P. De and S. Satapathi, Multimodal fluorescent polymer sensor for highly sensitive detection of nitroaromatics, Sci. Rep., 2019, 9(1), 1–10 Search PubMed.
- R. G. Ewing, M. J. Waltman, D. A. Atkinson, J. W. Grate and P. J. Hotchkiss, The vapor pressures of explosives, Trends Anal. Chem., 2013, 42, 35–48 Search PubMed.
- Y. Kim, K. Giribabu, J. G. Kim, J. B. Lee, W. G. Hong, Y. S. Huh and H. J. Kim, Electrochemical sensors based on Au-ZnS hybrid nanorods with Au-mediated efficient electron relay, ACS Sustainable Chem. Eng., 2018, 7(4), 4094–4102 Search PubMed.
- J. He, J. Wang, M. Zhang and G. Shi, Selection of a structure-switching aptamer for the specific methotrexate detection, ACS Sens., 2021, 6(6), 2436–2441 Search PubMed.
- A. Inoue, Y. Ohmuro-Matsuyama, T. Kitaguchi and H. Ueda, Creation of a nanobody-based fluorescent immunosensor mini Q-body for rapid signal-on detection of small hapten methotrexate, ACS Sens., 2020, 5(11), 3457–3464 Search PubMed.
- B. Gogoi and N. Sen Sarma, Curcumin–cysteine and curcumin–tryptophan conjugate as fluorescence turn on sensors for picric acid in aqueous media, ACS Appl. Mater. Interfaces, 2015, 7(21), 11195–11202 Search PubMed.
- S. S. Nagarkar, B. Joarder, A. K. Chaudhari, S. Mukherjee and S. K. Ghosh, Highly selective detection of nitro explosives by a luminescent metal–organic framework, Angew. Chem., 2013, 125(10), 2953–2957 Search PubMed.
- Y. Wang, L. Xiong, F. Geng, F. Zhang and M. Xu, Design of a dual-signaling sensing system for fluorescent ratiometric detection of Al3+ ion based on the inner-filter effect, Analyst, 2011, 136(22), 4809–4814 Search PubMed.
- B. Liu, C. Tong, L. Feng, C. Wang, Y. He and C. Lü, Water–soluble polymer functionalized CdTe/ZnS quantum dots: A facile ratiometric fluorescent probe for sensitive and selective detection of nitroaromatic explosives, Chem. – Eur. J., 2014, 20(8), 2132–2137 Search PubMed.
- B. Gole, S. Shanmugaraju, A. K. Bar and P. S. Mukherjee, Supramolecular polymer for explosives sensing: role of H-bonding in enhancement of sensitivity in the solid state, Chem. Commun., 2011, 47(36), 10046–10048 Search PubMed.
- W. R. Algar, A. Szwarczewski and M. Massey, Are We There Yet? Intracellular Sensing with Luminescent Nanoparticles and FRET, Anal. Chem., 2023, 95(2), 551–559 Search PubMed.
- E. Asadian, S. Shahrokhian, A. I. Zad and F. Ghorbani-Bidkorbeh, Glassy carbon electrode modified with 3D graphene–carbon nanotube network for sensitive electrochemical determination of methotrexate, Sens. Actuators, B, 2017, 239, 617–627 Search PubMed.
- H. Ghadimi, B. Nasiri-Tabrizi, P. M. Nia, W. J. Basirun, R. M. Tehrani and F. Lorestani, Nanocomposites of nitrogen-doped graphene decorated with a palladium silver bimetallic alloy for use as a biosensor for methotrexate detection, RSC Adv., 2015, 5(120), 99555–99565 Search PubMed.
- W. Zhai, Y. Chen, Y. Liu, T. Sakthivel, Y. Ma, Y. Qin, Y. Qu and Z. Dai, Enlarging the Ni–O Bond Polarizability in a Phosphorene-Hosted Metal–Organic Framework for Boosted Water Oxidation Electrocatalysis, ACS Nano, 2023, 17(17), 17254–17264 Search PubMed.
- C. D. Zhang, J. C. Lian, W. Yi, Y. H. Jiang, L. W. Liu, H. Hu, W. D. Xiao, S. X. Du, L. L. Sun and H. J. Gao, Surface structures of black phosphorus investigated with scanning tunneling microscopy, J. Phys. Chem. C, 2015, 113(43), 18823–18826 Search PubMed.
- A. Goswami and M. B. Gawande, Phosphorene: Current status, challenges and opportunities, Front. Chem. Sci. Eng., 2019, 13, 296–309 Search PubMed.
- A. Avsar, I. J. Vera-Marun, J. Y. Tan, K. Watanabe, T. Taniguchi, A. H. Castro Neto and B. Ozyilmaz, Air-stable transport in graphene-contacted, fully encapsulated ultrathin black phosphorus-based field-effect transistors, ACS Nano, 2015, 9(4), 4138–4145 Search PubMed.
- S. K. Tuteja and S. Neethirajan, Exploration of two-dimensional bio-functionalized phosphorene nanosheets (black phosphorous) for label free haptoglobin electro-immunosensing applications, Nanotechnology, 2018, 29(13), 135101 Search PubMed.
- Y. Chen, R. Ren, H. Pu, J. Chang, S. Mao and J. Chen, Field-effect transistor biosensors with two-dimensional black phosphorus nanosheets, Biosens. Bioelectron., 2017, 89, 505–510 Search PubMed.
- R. Gusmao, Z. Sofer and M. Pumera, Black phosphorus rediscovered: from bulk material to monolayers, Angew. Chem., Int. Ed., 2017, 56(28), 8052–8072 Search PubMed.
- S. Y. Cho, Y. Lee, H. J. Koh, H. Jung, J. S. Kim, H. W. Yoo, J. Kim and H. T. Jung, Superior chemical sensing performance of black phosphorus: comparison with MoS2 and graphene, Adv. Mater., 2016, 28(32), 7020–7028 Search PubMed.
- N. M. Latiff, W. Z. Teo, Z. Sofer, A. C. Fisher and M. Pumera, The cytotoxicity of layered black phosphorusm, Chem. – Eur. J., 2015, 21(40), 13991–13995 Search PubMed.
- H. U. Lee, S. Y. Park, S. C. Lee, S. Choi, S. Seo, H. Kim, J. Won, K. Choi, K. S. Kang, H. G. Park, H. S. Kim, H. R. An, K. H. Jeong, Y. C. Lee and J. Lee, Black phosphorus (BP) nanodots for potential biomedical applications, Small, 2016, 12(2), 214–219 Search PubMed.
- X. Jiang, H. Jin, Y. Sun, Z. Sun and R. Gui, Assembly of black phosphorus quantum dots-doped MOF and silver nanoclusters as a versatile enzyme-catalyzed biosensor for solution, flexible substrate and latent fingerprint visual detection of baicalin, Biosens. Bioelectron., 2020, 152, 112012 Search PubMed.
- Y. Zeng and Z. Guo, Synthesis and stabilization of black phosphorus and phosphorene: Recent progress and perspectives, iScience, 2021, 24(10) DOI:10.1016/j.isci.2021.103116.
- T. Nilges, M. Kersting and T. Pfeifer, A fast low-pressure transport route to large black phosphorus single crystals, J. Solid State Chem., 2018, 181(8), 1707–1711 Search PubMed.
- S. Pan, J. He, C. Wang and Y. Zuo, Exfoliation of two-dimensional phosphorene sheets with enhanced photocatalytic activity under simulated sunlight, Mater. Lett., 2018, 212, 311–314 Search PubMed.
- M. Kandasamy, M. Selvaraj, C. Kumarappan and S. Murugesan, Plasmonic Ag nanoparticles anchored ethylenediamine modified TiO2 nanowires@ graphene oxide composites for dye-sensitized solar cellm, J. Alloys Compd., 2022, 902, 163743 Search PubMed.
- K. Esumi, S. Sarashina and T. Yoshimura, Synthesis of gold nanoparticles from an organometallic compound in supercritical carbon dioxide, Langmuir, 2004, 20(13), 5189–5191 Search PubMed.
- L. Zhu, L. Xu, B. Huang, N. Jia, L. Tan and S. Yao, Simultaneous determination of Cd(II) and Pb(II) using square wave anodic stripping voltammetry at a gold nanoparticle-graphene-cysteine composite modified bismuth film electrode, Electrochim. Acta, 2014, 115, 471–477 Search PubMed.
- N. Sultana, A. Degg, K. J. Goswami, B. Gogoi, T. Nilges and N. Sen Sarma, Reduced Phosphorene Quantum Dot Incorporated Flexible Bio-Electronic Device for the Detection of Uric Acid in Real Media, ACS Appl. Electron. Mater., 2023, 5(3), 1502–1513 Search PubMed.
- S. Ge, L. Zhang, P. Wang and Y. Fang, Intense, stable and excitation wavelength-independent photoluminescence emission in the blue-violet region from phosphorene quantum dots, Sci. Rep., 2016, 6(1), 27307 Search PubMed.
- S. Qiu and S. Qiu, Air stable polyphosphazene functionalized few-layer black phosphorene for flame retardancy of epoxy resins, Springer, 2021, pp. 33–57, DOI:10.1007/978-981-16-3552-6_2.
- L. Zhu, L. Xu, B. Huang, N. Jia, L. Tan and S. Yao, Simultaneous determination of Cd(II) and Pb(II) using square wave anodic stripping voltammetry at a gold nanoparticle-graphene-cysteine composite modified bismuth film electrode, Electrochim. Acta, 2014, 115, 471–477 Search PubMed.
- P. Vishnoi, M. Mazumder, M. Barua, S. K. Pati and C. N. R. Rao, Phosphorene quantum dots, Chem. Phys. Lett., 2018, 699, 223–228 Search PubMed.
- S. A. Soomro, I. H. Gul, H. Naseer, S. Marwat and M. Mujahid, Improved performance of CuFe2O4/rGO nanohybrid as an anode material for lithium-ion batteries prepared via facile one-step method, Curr. Nanosci., 2019, 15(4), 420–429 Search PubMed.
- B. Tian, B. Tian, B. Smith, M. C. Scott, Q. Lei, R. Hua, Y. Tian and Y. Liu, Facile bottom-up synthesis of partially oxidized black phosphorus nanosheets as metal-free photocatalyst for hydrogen evolution, Proc. Natl. Acad. Sci., 2018, 115(17), 4345–4350 Search PubMed.
- M. R. Pacquiao, M. D. G. de Luna, N. Thongsai, S. Kladsomboon and P. Paoprasert, Highly fluorescent carbon dots from enokitake mushroom as multi-faceted optical nanomaterials for Cr6+ and VOC detection and imaging applications, Appl. Surf. Sci., 2018, 453, 192–203 Search PubMed.
- P. Dutta, D. Saikia, N. C. Adhikary and N. S. Sarma, Macromolecular systems with MSA-Capped CdTe and CdTe/ZnS Core/Shell quantum dots as superselective and ultrasensitive optical sensors for picric acid explosive, ACS Appl. Mater. Interfaces, 2015, 7(44), 24778–24790 Search PubMed.
- Z. Chen, S. Qian, X. Chen, W. Gao and Y. Lin, Protein-templated gold nanoclusters as fluorescence probes for the detection of methotrexate, Analyst, 2012, 137(18), 4356–4361 Search PubMed.
- X. Wei, X. Si, M. Han and C. Bai, One-Step Preparation of S, N Co-Doped Carbon Quantum Dots for the Highly Sensitive and Simple Detection of Methotrexate, Molecules, 2022, 27(7), 2118 Search PubMed.
- Z. Golsanamlou, H. Kholafazad-Kordasht, J. Soleymani and A. Jouyban, Quantification of methotrexate in plasma samples using highly fluorescent nanoparticles, J. Pharm. Biomed. Anal., 2022, 214, 114716 Search PubMed.
- M. Chen, J. Tang, W. Luo, Z. Zhang, Y. Zhu, R. Wang, H. Yang and X. Chen, Core-shell-satellite microspheres-modified glass capillary for micro sampling and ultrasensitive SERS spectroscopic detection of methotrexate in serum, Sens. Actuators, B, 2018, 275, 267–276 Search PubMed.
- X. Jiang, J. Zhang, L. Xu, W. Wang, J. Du, M. Qu, X. Han, L. Yang and B. Zhao, Ultrasensitive SERS detection of antitumor drug methotrexate based on modified Ag substrate, Spectrochim. Acta, Part A, 2020, 240, 118589 Search PubMed.
- Y. Wang, S. Li, Y. Gao, B. Du, S. Vafaei, M. Li, H. Wu, X. Tong and Y. Chen, Synthesis of poly (L-cysteine)/g-C3N4 modified glassy carbon electrodes for electrochemical detection of methotrexate as a medicine for treatment of breast cancer in pharmaceutical fluid samples, Chemosphere, 2023, 331, 138769 Search PubMed.
- M. Biedulska, P. Jakóbczyk, M. Sosnowska, B. Dec, A. Muchlińska, A. J. Zaczek, D. Nidzworski and R. Bogdanowicz, Cytocompatibility of stabilized black phosphorus nanosheets tailored by directly conjugated polymeric micelles for human breast cancer therapy, Sci. Rep., 2021, 11(1), 9304 Search PubMed.
Footnote |
| † Electronic supplementary information (ESI) available. See DOI: https://doi.org/10.1039/d3nr03948j |
| This journal is © The Royal Society of Chemistry 2023 |

