Studies on a niobia-supported VPO catalyst for glycerol dehydration†
N.
Pethan Rajan
 a,
Srinivasa Rao
Ginjupalli
 ab,
Sailaja
Gadamsetti
 ac,
Putrakumar
Balla
 *ad and
V. R.
Chary Komandur
 *a
*a
aCatalysis Division, CSIR-Indian Institute of Chemical Technology, Hyderabad, 500007, India. E-mail: putrakumar@cnu.ac.kr; charykvr@gmail.com
bDepartment of Applied Science and Pharmacy, University of Technology and Applied Science, Muscat-74, Sultanate of Oman
cDepartment of Chemistry, SRR & CVR Government Degree College (A), Vijayawada, 520004, India
dDepartment of Chemical Engineering and Applied Chemistry, Chungnam National University, Daejeon, 34134, Republic of Korea
First published on 10th July 2024
Abstract
Niobia supported VPO catalysts were synthesized using the deposition–precipitation method with VPO loadings increasing from 5 to 50 weight percent. The catalysts are characterized by various adsorption studies like BET surface area, TPR, TPD and spectroscopic studies like XRD, UV-DRS, FT-IR, and X-ray photoelectron spectroscopy. The dehydration of glycerol in the vapour phase was assessed in terms of its catalytic characteristics. The XRD analysis result of pure VPO validates the development of the vanadyl pyrophosphate phase. Despite higher VPO loadings, the supported VPO (VPO/Nb) study results indicate that the VPO species is widely distributed over the support. The results of the FTIR investigation indicate that with increasing VPO loadings, the phase of vanadyl pyrophosphate develops on niobia. According to the UV-DRS investigation, there may be some vanadium orthophosphate phase formation in addition to vanadyl pyrophosphate phase formation. XPS analysis findings confirmed the formation of V4+ species (VPP phase) over the support, and the binding energy values of V4+ were found to be unaltered with the successive addition of VPO loadings. The TPR experiments revealed that the reducible temperature of bare VPO is significantly greater than that of the niobia-assisted VPO catalyst. The ammonia TPD analysis findings show that the supported VPO has a higher total acidity value than either pure VPO or niobia. The catalytic performance of the samples was found to have relied on the total acidity of the catalyst.
1. Introduction
Glycerol has recently garnered attention as a byproduct of biodiesel manufacturing. The derived triglycerides can be trans-esterified by methanol, producing biodiesel (methyl ester) and glycerine as byproducts from a stoichiometric perspective.1,2 The increased output of biodiesel has caused a drop in the cost of raw glycerol.3 This yields glycerol as a desirable molecule that produces refined and unrefined compounds.4 Catalytic transformation of glycerol into acrolein via a two-fold dehydration process might be useful for utilising glycerol resources.5 However, such an approach would give a more economically viable and green substitute for the conventional catalytic petrochemical process in industry, which involves oxidizing propylene on a Bi/Mo binary oxide catalyst.6 Acrolein is a valuable chemical intermediate and raw ingredient for many processes like acrylic acid esters, ultra-absorbent polymers, detergents, fiber treatment, and other high-value derivatives.7 The prior research has investigated that zeolites,7 metal oxides,8 metal phosphates,9 heteropoly acids on various substrates,10 and WO3–ZrO211 have been used to dehydrate glycerol. VPO is widely recognized as a catalyst for producing maleic anhydride from selective oxidation of n-butane12 in the industry. The VPO catalyst possesses 5+ vanadium oxidation states (in α, β, γ, δ-VOPO4), as well as 4+ (in (VO)2P2O7). Vanadyl pyrophosphate is well crystalline and widely acknowledged as the main phase in industrial VPO catalysts for the synthesis of maleic anhydride through n-butane oxidation. The VPO catalyst's efficiency depends on the precursor reagents, phosphorous-to-vanadium ratio, solvent composition, and activation conditions. VOHPO4·0.5H2O is thermally treated to make vanadyl pyrophosphate. Recently developed commercial precursor formulations employ organic compounds as solvents.13 Kamiya et al.14 found Brønsted and Lewis acidic sites in vanadyl pyrophosphate. Hence, the VPO catalyst could be used as a solid acid–base catalyst for various chemical transformations. Wang et al.15 investigated a vanadium phosphorus oxide catalyst (hereafter VPO), one of the numerous metal phosphate catalysts utilized in this process, and they discovered that adding molecular oxygen to the glycerol feed significantly lowers secondary product generation while maintaining the conversion of glycerol and yield of acrolein. This group examined how varying the calcination temperatures affect the Lewis acidity of the pure VPO catalyst.16 However, the pure vanadyl pyrophosphate phase is less selective towards the acrolein in the dehydration of glycerol. This could be due to inappropriate acidic sites of the (VO)2P2O7 catalyst, which strongly adsorbs reactants, products, and other reaction intermediates, leading to various side reactions and coke formation over the active sites.15The supportation of the active component on an oxide interface is a well-studied strategy for improving the catalytic efficacy of vanadium phosphorous oxide catalysts. There are some research groups that reported the supported catalytic system of metal oxides and heteropoly acids for vapour phase glycerol dehydration reaction.7–10 Our group also studied the VPO catalyst supported on zirconium phosphate and found that the supported VPO catalyst gave better activity due to a higher amount of moderate acidic sites and suitable redox sites.17 In general, using a supported catalyst during glycerol dehydration improves active phase dispersion, pore size distribution, and catalytic acidity.
The earliest supports used for VPO were traditional oxides, including SiO2,18 TiO2,19 and Al2O3,20 as well as novel materials such as SiC.21 Alternative supports for the VPO catalyst include MCM-41, silica, fumed silica,22 SBA-15,23 Al-MCM-41,24 and zirconia modified with phosphoric acid.25 The study of niobium-based materials has recently received more attention as a solid acid catalyst in a number of catalytic transformations, such as hydrolysis, esterification, hydration, and dehydration.26–28 It could be used to support and promote different metal oxides due to its unique acidic properties and large surface area.29 As far as we know from the literature, the VPO supported by niobia has not yet been examined. As a result, we are interested in studying the influence of niobia supports on VPO catalysts, as well as the interaction between VPO and niobia, and the acidic character of the catalyst.
In the current examination, we deliver a thorough study on the characterization of the VPO catalyst supported on niobia by BET Surface area, XRD, FTIR, UV-DRS, temperature programmed desorption of NH3, temperature programmed reduction (TPR), and X-ray photoelectron spectroscopy analysis. The catalytic characteristics of glycerol dehydration were assessed using a series of niobia-supported VPO catalysts. The goal of this study is to investigate the catalytic functions of VPO supported on niobia. Also, the study examined the surface structure properties of vanadium phosphorous oxide entities in relation to active component loading and catalytic capabilities in the glycerol dehydration reaction.
2. Experimental section
2.1. Catalyst preparation
Niobia was made by calcining hydrated niobium pentoxide hydrate HY-340 AD/1227 from CBMM, Brazil, at 550 °C for 5 h.Vanadium pentoxide was initially refluxed at 140 °C for 5 hours with benzyl alcohol and isobutyl alcohol (1![[thin space (1/6-em)]](https://www.rsc.org/images/entities/char_2009.gif) :
:![[thin space (1/6-em)]](https://www.rsc.org/images/entities/char_2009.gif) 1 volume), following which the needed amount of calcined niobia support was added to the refluxing mixture. To achieve 1.2 P/V atomic ratio, 85% phosphoric acid was injected dropwise after one hour. After 6 more hours of refluxing, the suspension was filtered and washed with isobutanol and acetone before drying in air at 120 °C for 24 hours. The precursor to supported vanadyl pyrophosphate was obtained. Finally, the catalysts were calcined for 4 hours under nitrogen flow at 550 °C.
1 volume), following which the needed amount of calcined niobia support was added to the refluxing mixture. To achieve 1.2 P/V atomic ratio, 85% phosphoric acid was injected dropwise after one hour. After 6 more hours of refluxing, the suspension was filtered and washed with isobutanol and acetone before drying in air at 120 °C for 24 hours. The precursor to supported vanadyl pyrophosphate was obtained. Finally, the catalysts were calcined for 4 hours under nitrogen flow at 550 °C.
2.2. Catalyst characterisation
The Rigaku miniflex diffractometer was used to acquire XRD patterns using CuKα (Kα = 0.15406 nm) (filter – graphite) radiation. The IR (Model: GC-FT-IR Nicolet 670) spectrometer took catalytic FT-IR spectra using the KBr disc technique at ambient temperature. The pre-treated catalyst's specific surface area and pore size distribution were determined using N2 adsorption isotherms at −196 °C using the multipoint BET technique with 0.0162 nm2 cross-sectional area using an Autosorb 1 (Quantachrome equipment).The UV-vis diffused reflectance spectra were acquired using a GBC Cintra 10e spectrometer with an integrated sphere reflectance auxiliary. Data was converted using the Kubelka–Munk equation f(R) = (1 − R)2/2r after recording spectra at room temperature. An AutoChem 2910 (Micromeritics, USA) was used for temperature programmed reduction investigations. The TPR experiment used 100 mg oven-dried material in a U-shaped quartz tube. Quartz wool plugs held the catalyst. The catalyst sample was prepared with 50 mL min−1 helium gas at 200 °C for 1 h before TPR measurements. After pre-treatment, the sample was cooled to ambient temperature, and a TPR analysis was performed at 5% H2–Ar (50 mL min−1) from ambient to 850 °C at 10 °C min−1. GRAMS/32 calculates H2 consumption and Tmax. An AutoChem 2910 was also used for TPD studies. TPD experiments typically used 100 mg of oven-dried material in a U-shaped quartz sample tube. Quartz wool plugs held the catalyst. The sample was prepared for 1 h with high-purity helium (50 mL min−1) at 200 °C before TPD experiments. After pretreatment, the sample was saturated with high-purity anhydrous ammonia (50 mL min−1) with 10% NH3–He at 80 °C for 1 h and flushed with He flow at 120 °C for 1 h to remove physiosorbed ammonia. TPD analysis was done from ambient to 600 °C at 10 °C min−1. GRAMS/32 calculates the NH3 desorbed. Catalyst XPS spectra were obtained using a Kratos-Axis 165 spectrometer with Mg Kα radiation (1253.6 eV) at 75 W. The C 1s line at 284.6 eV was employed as an internal reference for binding energy adjustment. The background pressure during data gathering was below 10−10 bar.
Gas phase glycerol dehydration was performed in a vertical fixed bed quartz reactor (40 cm length, 9 mm i.d.) with 0.2 g catalyst at atmospheric pressure. Pre-treatment of the catalysts at 300 °C for 1 h in dry N2 (30 mL min−1) preceded the reaction. A 0.5 mL h−1 glycerol micro pump fed the reactor a 20 wt% glycerol aqueous solution. The reaction products were condensed in an ice–water trap and collected hourly for analysis on a Shimadzu GC-2014 gas chromatograph with a flame ionization detector and a DB-wax 123–7033 (Agilent) capillary column (0.32 mm i.d., 30 m long).
3. Results and discussion
3.1. XRD analysis
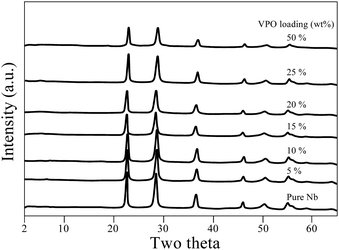
XRD patterns of calcined and uncalcined unsupported VPO are presented in Fig. S1 (ESI†). The main XRD reflections occur at 15.7° corresponding to the single crystalline monophasic phase of vanadyl hydrogen phosphate hemihydrate. This precursor sample was calcined in a nitrogen atmosphere, and it underwent a topotactic transformation and yielded the primary reflection peaks at 2θ = 23.3°, 28.7°, 30.3°, and 43.6°, consistent with existing literature for the vanadyl pyrophosphate phase.30,31 As the sample was calcined in an N2(g) environment, the resultant vanadyl pyrophosphate sample was less crystalline than the precursor sample.Fig. 1 depicts XRD patterns for pure niobia and supported VPO catalysts with VPO loadings varying from 5–50 wt%. The pure Nb2O5 sample calcined at 550 °C displays X-ray diffraction peaks of 2θ at 22.5°, 28.4°, 36.6°, 46° and 55.3° and this implies the development of the hexagonal phase (TT phase) of Nb2O5, in agreement with Ko and Weissman's research.32 In the scenario of a supported VPO catalyst, the patterns of XRD indicate peaks due to the niobia support alone. There are no peaks related to VPO species even for the catalysts with high VPO (50%) loading, signifying that that the VPO species is widely distributed and well dispersed over the niobia support. However, the possibility that the weakly crystalline main X-ray diffraction peaks of vanadyl pyrophosphate might be hidden by strong, well-crystalline XRD peaks of the niobia support could not be ruled out since both major peaks appeared in a similar region.
3.2. FTIR spectroscopy
FT-IR spectroscopy is one of the promising techniques for the elucidation of structures of the VPO catalyst. The calcined pure VPO catalyst exhibits IR bands at 1240 cm−1, 1140 cm−1, and 1096 cm−1, which correspond to symmetric (νs PO3) and asymmetric (νas PO3) stretching vibrations of phosphate groups. An IR band at 968 cm−1 indicates the vanadyl pyrophosphate phase, driven by V4+![[double bond, length as m-dash]](https://www.rsc.org/images/entities/char_e001.gif) O species. The IR band at 633 cm−1 is due to O–P–O group bending modes, whereas the one at 744 cm−1 is from P–O–P group symmetric stretching vibrations.33
O species. The IR band at 633 cm−1 is due to O–P–O group bending modes, whereas the one at 744 cm−1 is from P–O–P group symmetric stretching vibrations.33
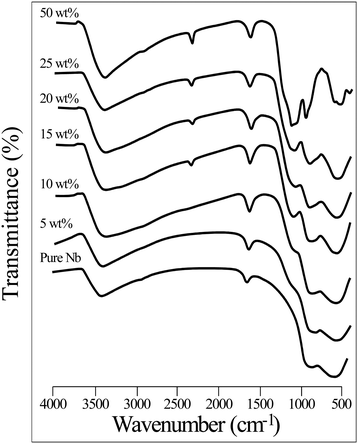
Fig. 2 shows the FTIR spectra of the pure niobia support and different VPO catalyst wt% loadings. All IR spectra show that surface OH groups cause the bands at 3400–2400 cm−1, whereas the bending adsorbed mode of the hydroxyl group causes the band at 1630 cm−1. The FT-IR spectra of the pure niobia support show two wide and large IR bands at 560 and 880 cm−1 and have been ascribed to a severely deformed octahedral NbO6 with an Nb![[double bond, length as m-dash]](https://www.rsc.org/images/entities/char_e001.gif) O bond and the Nb–O bond of the slightly deformed NbO6 octahedron, respectively.34 By raising the VPO loading on the niobia support, a new peak appears at 1090 cm−1, attributed to the asymmetric stretching frequency of the PO3 group in the vanadyl pyrophosphate phase. At higher VPO loadings (50 wt%) of the sample there is the formation of another peak at 1140 cm−1 and 970 cm−1 attributed to the symmetric (νs PO3) stretching frequency of PO3 group and of V4+
O bond and the Nb–O bond of the slightly deformed NbO6 octahedron, respectively.34 By raising the VPO loading on the niobia support, a new peak appears at 1090 cm−1, attributed to the asymmetric stretching frequency of the PO3 group in the vanadyl pyrophosphate phase. At higher VPO loadings (50 wt%) of the sample there is the formation of another peak at 1140 cm−1 and 970 cm−1 attributed to the symmetric (νs PO3) stretching frequency of PO3 group and of V4+![[double bond, length as m-dash]](https://www.rsc.org/images/entities/char_e001.gif) O species, respectively. This finding validates the creation of a vanadyl pyrophosphate phase on the niobia support.33 The FTIR spectra did not exhibit the stretching frequency of V4+
O species, respectively. This finding validates the creation of a vanadyl pyrophosphate phase on the niobia support.33 The FTIR spectra did not exhibit the stretching frequency of V4+![[double bond, length as m-dash]](https://www.rsc.org/images/entities/char_e001.gif) O species at 970 cm−1 at lower loadings of the supported VPO catalyst, possibly because the strongest bands of the pure support overwhelm the identified peaks. Hence, the FT-IR spectra confirm the formation of the VPP phase for the lower loaded niobia supported VPO catalyst (5 wt%).
O species at 970 cm−1 at lower loadings of the supported VPO catalyst, possibly because the strongest bands of the pure support overwhelm the identified peaks. Hence, the FT-IR spectra confirm the formation of the VPP phase for the lower loaded niobia supported VPO catalyst (5 wt%).
3.3. Nitrogen adsorption–desorption analysis
Table 1 shows results from N2 adsorption desorption studies to understand the catalyst's textural properties. Table 1 reveals that the VPO loading significantly affected the niobia support surface area. As shown in Table 1, the pure niobia support has 48 m2 g−1 surface area, which decreases with VPO content. A decrease in surface area with greater VPO loading may be due to crystalline vanadium phosphorous oxide blocking support holes. The pure VPO catalyst has 16 m2 g−1 surface area. Since VPO particles are equally distributed in the niobia support's pores, the sample's pore volume and breadth decrease.| S. no. | VPO loadings (Wt%) | Surface area (m2 g−1) | Pore volume (cc g−1) | Pore diameter (Å) |
|---|---|---|---|---|
| 1. | Pure Nb | 48 | 0.1065 | 93.51 |
| 2. | 5 | 46 | 0.1013 | 87.92 |
| 3. | 10 | 42 | 0.0889 | 73.99 |
| 4. | 15 | 39 | 0.0634 | 77.95 |
| 5. | 20 | 38 | 0.0571 | 77.03 |
| 6. | 25 | 36 | 0.0519 | 70.41 |
| 7. | 50 | 29 | 0.0434 | 60.93 |
| 8. | 100 | 16 | 0.0196 | 47.34 |
3.4. UV DRS analysis
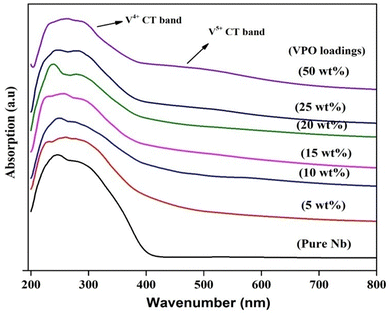
UV vis-DRS tests were conducted to determine the vanadium oxidation state of VPO and the supported VPO. According to the literature, the charge transfer absorption band for V5+ is approximately 500 nm, whereas that of V4+ is around 220 nm.35 UV-DRS spectra of pure VPO (uncalcined and calcined) are shown in Fig. S2 (ESI†). The O2− to V4+ charge transfer transition causes a wide charge transfer transition band from 200 to 350 nm in uncalcined VPO, as well as an additional transition band at 600 nm caused by V4+'s d–d transition. The calcined (in N2) sample has no V4+ d–d transition band but has a steady charge transfer band. Overall, the charge shift transition band is much brighter than vanadium ions' d–d transition and these findings match Martin et al.36Fig. 3 shows the UV-DRS profile of the niobia support and VPO supported on niobia. The UV-DRS spectra of the pure niobia support show prominent bands indicating ligand-to-metal charge transfer transitions from O2− to Nb5+ in the 200–400 nm range.37 The charge transfer (CT) transition from O2− to V4+ takes place in the 200–400 nm area with multiplicity. Due to the intensive charge transfer transition band of the support (LMCT from O2− to Nb5+), the required information about O2− to V4+ is not obtained from the spectrum for the lower VPO loading samples. However, introducing the VPO species over the niobia changes the shape of the absorption bands of the niobia support. Increasing the VPO loading on niobia results in a higher intensity of V4+'s charge transfer transition band. Fig. 3 demonstrates that, like pure VPO, the charge transfer band of V5+ becomes evident at higher loadings of the VPO catalyst with assistance. This finding shows the presence of a vanadyl pyrophosphate phase on the niobia support, as well as a small quantity of vanadium orthophosphate. However, the XRD measurements of the pure VPO catalyst demonstrate that the calcined sample contains solely the vanadyl pyrophosphate phase. The UV-DRS study indicates that a small quantity of vanadium orthophosphate phases may exist in the amorphous form.
3.5. Temperature programmed reduction (TPR)
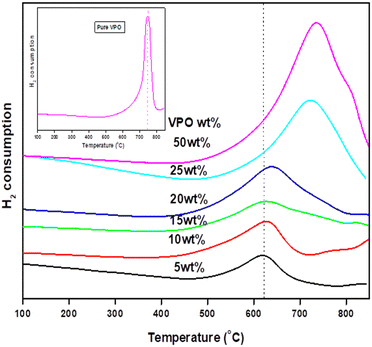
The ease and strength of reduction of pure VPO and niobia-assisted VPO catalysts were investigated using TPR with 5% H2/Ar. Fig. 4 depicts the TPR patterns of pure VPO catalysts and different wt% VPO loadings on the niobia support. VPO dispersion on the niobia support drastically changes the VPO catalyst's vanadium reduction nature. The TPR profiles of the pure VPO catalyst reveal just one significant reduction peak at 750 °C, suggesting that it contains only one kind of reducible vanadium [Fig. 4 inset], which reduces V4+ to V3+.18 Similarly, with varying wt% VPO supported on a niobia catalyst, just one peak occurred in the TPR profiles at roughly 650 °C owing to V4+ reduction to V3+. Table 2 shows the volume and temperature of hydrogen intake for the different loaded catalysts. As the VPO loadings increase, so does VPO's hydrogen consumption. It is noteworthy to observe that the supported VPO catalyst has a much lower reduction temperature than the pure VPO catalyst, indicating a substantial VPO-niobia support interaction. The results demonstrate that aided VPO catalysts are more readily reducible than pure ones. Since the niobia support was not reduced in the temperature range examined, the observed reducibility should be connected to the supported VPO species. Smaller VPO loadings make catalyst reduction easier. The reduction temperature rose as the VPO loadings increased. This indicates that the reducibility decreases as the VPO loadings increase. Because the VPO species are extensively dispersed throughout the niobia support at lower loadings, their reducibility is much improved. The VPO's oxygen atoms interact with niobium species, which boosts the stability of vanadium atoms and the catalyst's reducibility. At larger loadings, there is a significant change in the reduction temperature of the supported VPO catalyst (>20 wt%) due to the formation of bulk form VPO catalyst, which limits its reducibility.| S. no. | VPO loadings (wt%) | Temp (°C) | Total acidity (mmol g−1) | Temp (°C) | Amount of hydrogen consumption (μmol g−1) |
|---|---|---|---|---|---|
| 1 | 0 | 276 | 2.772 | — | — |
| 2 | 5 | 262 | 3.021 | 620 | 667 |
| 3 | 10 | 280 | 2.825 | 626 | 908 |
| 4 | 15 | 291 | 2.683 | 628 | 952 |
| 5 | 20 | 295 | 2.588 | 635 | 1767 |
| 6 | 25 | 307 | 2.623 | 724 | 2629 |
| 7 | 50 | 326 | 1.511 | 733 | 3991 |
| 8 | 100 | 276 | 0.631 | 750 | 4516 |
3.6. Temperature programmed desorption of ammonia (TPD)
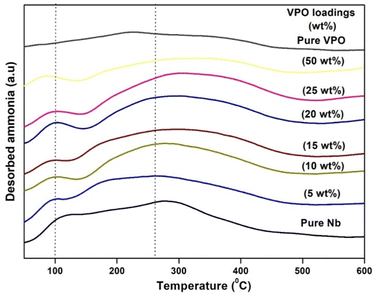
The surface acidity of all produced materials was tested using ammonia TPD. Since it is simple and reliable. This method is often used to measure catalyst acidity and acid site strength. Fig. 5 shows the ammonia TPD profiles of pure VPO, pure niobia support, and different VPO/Nb catalyst weight % loadings. The acidic properties of several wt% VPO loadings on the niobia support are shown in this picture. Tanabe et al.38 found that the NH3 desorption temperature influences the TPD profile solid acid site intensity: mild (120–300 °C), moderate (300–450 °C), and strong (above 450 °C). All ammonia TPD profiles have a single broad peak in the mild to moderate acidic region. Fig. 5 demonstrates that the weak moderate acidic region peak strength improves at lower loadings but declines at higher loadings as the VPO loadings increase. The moderate acidic sites' NH3 desorption peak changed from 262 to 326 °C as the VPO loading increased over the niobia support. This shows that added VPO species over the niobia support generate somewhat stronger acidic sites at higher loadings. Table 2 shows that ammonia uptake and peak temperature increase with weak moderate acidic sites, but decrease with greater VPO loadings. Supported VPO is more acidic than the pure VPO catalyst or niobia support. The supported VPO catalyst 5 wt% VPO/Nb has the greatest TPD total acidity.3.7. XPS analysis
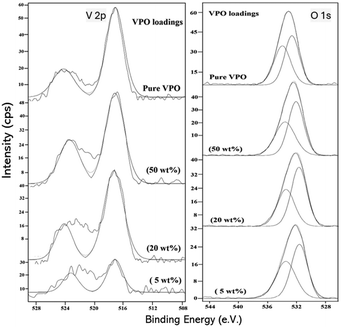
To learn more about the oxidation state of vanadium and the relative amount of surface components on the VPO catalyst, an XPS study was performed, and the findings are presented in Fig. 6. Fig. 6 depicts the V 2p, P 2p, and O 1s regions for 5, 20, and 50 wt% VPO assisted by niobia and pure VPO catalyst. The average binding energy for the V 2p3/2 peak ascribed to V4+ and V5+ phases is 516.8 and 518.0 eV.39 In the pure VPO catalyst, the wide V 2p signal centred at the binding energy value of 517.3 eV suggests the presence of V4+ oxidation states, consistent with previously reported data40 (Table 3). Like the pure VPO catalyst, the supported VPO catalyst has a V 2p peak at 517.1–517.3 eV. When the VPO loading increases on the niobia support, no significant shift in the position of the V 2p peak was observed, indicating that the oxidation state of vanadium does not change throughout the VPO loadings. From the above results, it has been found that the pure and supported VPO catalyst consists of V4+ phase. P 2p has the same binding energy (134.4–134.6 eV) as the vanadyl pyrophosphate that has been described.40,41| S. no. | VPO loadings (wt%) | Binding energies (eV) | Surface composition (at%) | |||||
|---|---|---|---|---|---|---|---|---|
| V 2p3/2 | P 2p | O 1s | Nb | P/V | Nb/V | Nb/P | ||
| 1. | 5% | 517.3 | 134.4 | 532.2 | 207.9 | 2.5 | 2.5 | 1.1 |
| 2. | 20% | 517.1 | 134.6 | 532.2 | 208.1 | 2.4 | 1.5 | 0.7 |
| 3. | 50% | 517.2 | 134.6 | 532.5 | 207.8 | 2.2 | 0.6 | 0.3 |
| 4. | Pure VPO | 517.3 | 134.5 | 533.1 | — | 1.9 | — | — |
This corresponds to a formal effective oxidation state of +5, as seen in Fig. 6. The binding energy values of 532.2–533.1 eV for pure VPO and varied wt% of VPO supported on niobia samples correlate to the O 1s peak, indicating the presence of oxygen species as O2− in oxides. However, the O 1s binding energy of the pure VPO catalyst is greater than that of the supported VPO catalyst. This is most likely due to the addition of niobia support oxygen to the catalyst. Deconstructing the O 1s peak gave two peaks with 531.7 and 533.1 eV binding energies. The vanadium phosphate sample has lattice oxygen ions in the first peak and surface hydroxide ions and carbonates in the second. The binding energy of Nb ranged from 207.8 to 208 eV. Furthermore, Table 3 shows the surface compositional ratios of pure VPO and different supported VPO catalysts as measured by XPS. VPO has a predicted stoichiometric P/V ratio of 1.2 in all produced samples.
The XPS analysis findings show that the true P/V ratios of all our specimens were between 1.9 and 2.5. This finding verifies that phosphorus was present in higher concentrations on the catalyst surface across all samples. However, phosphorous enrichment on the surface of a VPO catalyst is a typical event that aids in the stabilization of decreased vanadium species.18 However, assisted VPO catalysts exhibit greater surface P/V ratios than pure VPO catalysts. The Nb/V and Nb/P ratios decrease with increasing VPO wt% in the samples as predicted.
4. Catalytic activity results
4.1. Effect of VPO loadings
Table 4 shows the catalytic findings from glycerol dehydration at various wt% VPO loadings on niobia by diffusing nitrogen. Pure niobia support converted almost 74% glycerol with 30% selectivity for acrolein. This catalyst produced mostly acetaldehyde, acetol, and a little acetic acid. The acrolein selectivity rises to 56% over the niobia-supported VPO catalyst and then decreases with VPO loading. The highest percentage of glycerol conversion was achieved using a 5 wt% VPO/Nb assisted catalyst. In the first hour, pure VPO converts 90% to glycerol and 47% to acrolein. Acetol, acetaldehyde, acetic acid, allyl alcohol, and several undefined traces were the most common byproducts. However, the conversion and selectivity given in Table 4 for various catalysts are only valid for short periods of time on stream since the deactivation process becomes more prevalent as the reaction duration increases. Most catalyst deactivation is caused by coke formation. (The catalyst becomes gray to black).| S. no. | VPO loadings (wt%) | Conversion (mol%) | Selectivity (mol%) | |||||
|---|---|---|---|---|---|---|---|---|
| Acrolein | Hydroxy acetone | Acetaldehyde | Acetic acid | Allyl alcohol | Others | |||
Reaction conditions: catalyst weight: 0.2 g, glycerol flow (20% wt/wt): 0.5 mL h−1, reaction temperature: 300 °C, gas flow: 16 mL min−1 N2 flow, reactant feed composition gly![[thin space (1/6-em)]](https://www.rsc.org/images/entities/char_2009.gif) : :![[thin space (1/6-em)]](https://www.rsc.org/images/entities/char_2009.gif) H2O H2O![[thin space (1/6-em)]](https://www.rsc.org/images/entities/char_2009.gif) : :![[thin space (1/6-em)]](https://www.rsc.org/images/entities/char_2009.gif) N2 was 1.37 N2 was 1.37![[thin space (1/6-em)]](https://www.rsc.org/images/entities/char_2009.gif) : :![[thin space (1/6-em)]](https://www.rsc.org/images/entities/char_2009.gif) 50.0 50.0![[thin space (1/6-em)]](https://www.rsc.org/images/entities/char_2009.gif) : :![[thin space (1/6-em)]](https://www.rsc.org/images/entities/char_2009.gif) 42.83. In parenthesis, the reaction conditions are the same except that reactant feed composition gly 42.83. In parenthesis, the reaction conditions are the same except that reactant feed composition gly![[thin space (1/6-em)]](https://www.rsc.org/images/entities/char_2009.gif) : :![[thin space (1/6-em)]](https://www.rsc.org/images/entities/char_2009.gif) H2O H2O![[thin space (1/6-em)]](https://www.rsc.org/images/entities/char_2009.gif) : :![[thin space (1/6-em)]](https://www.rsc.org/images/entities/char_2009.gif) N2 N2![[thin space (1/6-em)]](https://www.rsc.org/images/entities/char_2009.gif) : :![[thin space (1/6-em)]](https://www.rsc.org/images/entities/char_2009.gif) air was 1.37 air was 1.37![[thin space (1/6-em)]](https://www.rsc.org/images/entities/char_2009.gif) : :![[thin space (1/6-em)]](https://www.rsc.org/images/entities/char_2009.gif) 50.0 50.0![[thin space (1/6-em)]](https://www.rsc.org/images/entities/char_2009.gif) : :![[thin space (1/6-em)]](https://www.rsc.org/images/entities/char_2009.gif) 32.12 32.12![[thin space (1/6-em)]](https://www.rsc.org/images/entities/char_2009.gif) : :![[thin space (1/6-em)]](https://www.rsc.org/images/entities/char_2009.gif) 10.7 in molar ratio. 10.7 in molar ratio. |
||||||||
| 1 | Pure Nb | 74 (74) | 30 (30) | 23 (23) | 6 (6) | 3 (3) | 4 (4) | 34 (34) |
| 2. | 5 | 98 (100) | 56 (70) | 6 (—) | 5 (10) | 6 (14) | 12 (—) | 15 (06) |
| 3. | 10 | 96 (100) | 54 (69) | 8 (—) | 8 (9) | 5 (14) | 13 (—) | 12 (08) |
| 4. | 15 | 95 (100) | 52 (68) | 13 (—) | 4 (9) | 6 (13) | 19 (—) | 06 (10) |
| 5. | 20 | 94 (100) | 52 (68) | 9 (—) | 4 (11) | 3 (12) | 21 (—) | 11 (09) |
| 6. | 25 | 95 (100) | 51 (64) | 10 (—) | 5 (8) | 4 (10) | 13 (—) | 17 (18) |
| 7. | 50 | 91 (100) | 46 (59) | 4 (—) | 7 (5) | 7 (7) | 8 (—) | 28 (29) |
| 8. | Pure VPO | 90 (90) | 47 (50) | 2 (—) | 8 (4) | 13 (18) | — (—) | 30 (28) |
F. Wang et al.15 examined the glycerol dehydration process employing a pure VPO catalyst, transporting molecular oxygen via nitrogen gas to retain glycerol conversion and acrolein synthesis while drastically reducing secondary product creation. As a result, we evaluated the dehydration of glycerol on niobia at various wt% VPO loadings using air and nitrogen, and our findings are presented in Table 4. Co-injecting air with nitrogen prevented catalyst degradation and decreased the production of hydroxy acetone and allyl alcohol, resulting in increased acrolein selectivity. Interestingly, the addition of air to the nitrogen gas flow has no impact on the catalytic performance of the pure support. Switching the gas flow to the VPO/Nb catalyst improves glycerol conversion and increases acrolein selectivity. The maximum acrolein selectivity (70%) reaches lower loadings (5 wt%) of the VPO supported on niobia and it steadily lowers as the loadings increase. Moreover, there is no change in the conversion of glycerol for the supported VPO catalyst. Table 4 consistently shows that the conversion of glycerol is 100%. Furthermore, the supported VPO catalyst exhibited higher acrolein selectivity compared to pure niobia and pure VPO, attributed to the decrease in the creation of other by-products. Interestingly no substantial change in glycerol conversion or acrolein selectivity over the lower VPO loadings of the catalyst ranging from 5–20 wt% was observed (Table 4).
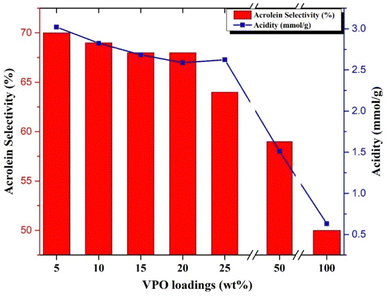
At higher VPO loadings (25 & 50 wt%), the glycerol conversion and acrolein selectivity decreases considerably. The acidity of the samples is correlated with the selectivity of acrolein formation during the reaction with different samples and the results are presented in Fig. 7. From Fig. 7, it can be observed that a greater number of acidic sites is required for obtaining a high acrolein selectivity. The supported VPO catalyst with VPO loadings ranging from 5–20 wt% showed higher acrolein selectivity and a higher number of acidic sites. For the 25 wt% VPO/Nb sample, despite having higher acidic sites, the lower acrolein selectivity observed might be due to lower redox properties, i.e. higher reduction temperature, as evidenced by TPR analysis. Guliants et al.42 also studied the Nb-promoted VPO catalysts for the oxidation of n-butane to maleic anhydride. They reported that the catalytic activity improved more than the pure VPO mostly because of the enhancement of acidity, i.e., Nb species and P–OH groups. The pure niobia support shows lower activity in the glycerol dehydration reaction despite its high acidity in the ammonia TPD profile. This might be owing to higher levels of Lewis acidic acids, which are not favourable to producing acrolein.43 Moreover, the niobia-supported VPO catalyst having surface enrichment of phosphorous than pure VPO catalyst, as evidenced by the P/V ratio of XPS analysis, might be producing higher acrolein.
4.2. Product distribution results
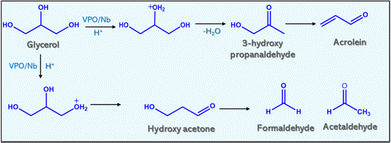
Table 4 shows the product distribution of glycerol dehydration for constant reaction conditions except gas flow. Table 4 reveals that air and nitrogen improve glycerol conversion and acrolein selectivity. Conversion of glycerol over pure niobia and VPO, and varied weight % loadings of VPO on niobia produced acrolein, acetol, allylalcohol, acetic acid, and acetaldehyde (Fig. 8). Other products included acrylic acid, acetone, and other unidentifiable chemicals. When air was injected into the reaction media, the product distribution shifted. The introduction of air to the nitrogen flow reduces the creation of allyl alcohol and hydroxyl acetone over the reaction while increasing the formation of acetaldehyde and acetic acid.The hydrogenation of acrolein in the reaction medium yields allyl alcohol. The primary source of hydrogen is the decomposition of glycerol into coke. The dehydration of glycerol's terminal hydroxyl group yields hydroxyacetone. The air containing oxygen inhibits acrolein hydrogenation and promotes central hydroxy group dehydration. However, the major side products in the reaction are acetaldehyde, acetic acid and a lower quantity of acrylic acid, indicating that these catalysts (supported VPO) promote the oxidation of acrolein. Volta et al.44,45 studied the oxidation ability of the Nb-promoted VPO to yield maleic anhydride from n-butane. They proposed that the incorporation of Nb into the VPO framework enhanced the redox effect of V5+/V4+. Because of that, the observed yield of maleic anhydride was increased for the Nb-promoted VPO catalyst compared to the unpromoted catalyst. The reaction schemes are also proposed based on the product distributions.
4.3. Effect of temperature
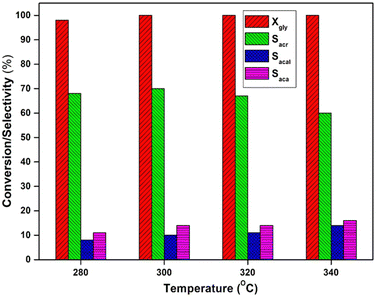
The influence of temperature (280–340 °C) on glycerol dehydration was investigated using a 5 wt% VPO/Nb catalyst, and the findings are presented in Fig. 9. The glycerol conversion at 280 °C is 98% and peaks at higher temperatures. At lower reaction temperature, the acrolein selectivity decreased considerably because of the formation of a small amount of hydroxyacetone. When the temperature was increased, the selectivity to hydroxyacetone decreased, while the acetaldehyde and acetic acid selectivity increased.This data indicates that at maximum temperatures (340 °C), this catalyst favours carbon–carbon link breaking and oxidation over dehydration. Acetaldehyde is the primary side product formed by c–c breakage of glycerol, and oxidation of acetaldehyde produces acetic acid. The oxidation of acrolein produces a minor quantity of acrylic acid. As a result, higher temperatures only enhance acrolein oxidation by the VPO supported catalysts due to increased vanadium reducibility in the catalyst.
4.4. Time on stream
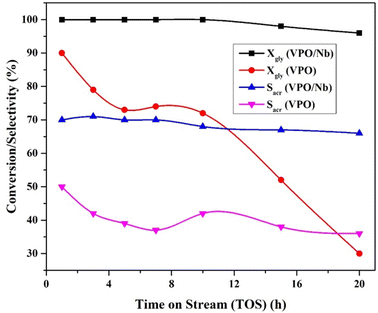
Fig. 10 shows air and nitrogen assisted catalytic transformation of glycerol over pure VPO and 5 wt% VPO/Nb over time. By passing air and nitrogen, the pure VPO catalyst had 90% conversion and 50% selectivity in the first hour, 30% conversion at 20 hours, and roughly 36% acrolein selectivity at the same reaction time. Under similar reaction conditions, 5 wt% VPO supported on niobia converted over 100% and selected 70% acrolein, then 96% and 62% up to 20 hours.This is due to the high interaction between niobia and the VPO catalyst; the reducibility character of the vanadium metal (redox centre) increases. This redox centre (vanadium metal), efficiently removes the organic deposits from the surface of the active sites, leading to a lowering of the deactivation phenomena. W. Suprun et al.46 found the same for transition metal oxide and phosphate alumina catalysts dehydrating glycerol. Hence, the reducibility character plays a vital part in catalytic activity.
Feng Wang et al. studied the dehydration of glycerol over different vanadium phosphate phases by passing molecular oxygen and found that the pure vanadyl pyrophosphate phase yielded 41% acrolein selectivity with 100% glycerol conversion.15 The same group studied the different calcination temperatures of VPO and found that the pure VPO calcined at 600 °C gave acrolein selectivity of 39% with 100% glycerol conversion.16 Our group studied the same reaction over the pure VPO catalyst with different P/V ratios and calcined in an air atmosphere. As a result, the catalyst that contains mixed phases (vanadyl pyrophosphate and vanadyl orthophosphate phases) yields maximum glycerol conversion with 66% acrolein selectivity.47 Xinzhen Feng et al. studied the same conversion using pure VPO catalyst synthesised using PEG6000, yielding maximum conversion of glycerol with 70% acrolein selectivity. However, the author used difficult calcination conditions of butane:air:nitrogen mixture, which leads to a mixture of vanadyl pyrophosphate and vanadyl orthophosphate phases.48 Giovanna Ruoppolo et al. reported the same conversion over a different supported vanadium orthophosphate catalyst (VOP) and found that VOP/Al gave 100% conversion with 40% acrolein selectivity.49 Our group also studied the zirconium phosphate supported VPO catalyst on glycerol dehydration reaction and achieved the maximum conversion with 65% acrolein selectivity.25 Hence, the present work yielded a comparatively better acrolein selectivity than the results in the literature.
The physical parameters of the spent catalysts were analysed using surface area analysis and CHNS analysis to investigate the impact of gaseous feed flow on catalyst deactivation. The results are shown in Table S1 and S2 (ESI†), respectively.
The results show a considerable reduction in the BET surface area and pore volume of the spent catalyst when exposed to solely N2 flow. This is mostly caused by the presence of carbonaceous compounds blocking the pores of the catalyst. When the sample was exposed to air and nitrogen flow, there was no significant decrease in surface area and pore size. This indicates that the catalyst eliminated the carbonaceous species generated due to the presence of redox centres.
The quantity of coke accumulated on the catalyst after 12 hours of reaction was determined using a CHNS analyzer, as shown in Table S2 (ESI†). A lower coke deposition was found for the 5 wt% VPO/Nb catalyst under air mixed nitrogen flow than pure N2 flow. This conclusion aligns well with the findings from the surface area analysis. However, the significantly reduced H/C ratio for the 5 wt% VPO/Nb catalyst according to solely nitrogen flow suggests that the produced deposits of carbon are densely condensed, unsaturated, and polynuclear aromatic carbons.
5. Conclusion
In summary, the deposition–precipitation process was employed to construct niobia-supported VPO catalysts for acid catalyzed glycerol dehydration reactions, which were then investigated. It was discovered that the supported VPO catalysts had higher catalytic activity than the pure VPO catalysts. Compared to other catalysts tested for glycerol to acrolein dehydration, 5 wt% VPO/Nb had the highest activity for glycerol conversion (100%) and acrolein selectivity (70%), as well as the longest lifespan. This is mainly because of the higher acidic properties and increase of redox ability of the supported VPO catalysts due to the strong interaction between the VPO catalyst and niobia support. These catalysts are studied using several spectroscopic and adsorption approaches. The characterisation findings revealed that the VPO species are evenly distributed over the niobia support and exist mostly in the form of vanadyl pyrophosphate phase, with a small quantity of vanadium orthophosphate phase. The used catalyst containing 5% VPO/Nb was analysed using elemental and surface area analysis after exposure to various gaseous flows. These results show that a higher amount of carbon species development occurs in the catalyst's active areas under nitrogen flow, which is the reason for the fast deactivation of the catalyst.Data availability
The data that support the findings of this study are available within the paper and its ESI,† and all data are also available from the corresponding authors upon request.Conflicts of interest
There are no conflicts to declare.Acknowledgements
The author is grateful to the Council of Scientific and Industrial Research (CSIR), New Delhi, for granting him a Senior Research Fellowship.References
- J. A. Okolie, E. I. Epelle, M. E. Tabat, U. Orivri, A. Nosakhare Amenaghawon, P. U. Okoye and B. Gunes, Process Saf. Environ. Prot., 2022, 159, 323–344 CrossRef CAS.
- M. A. Bashir, S. Wu, J. Zhu, A. Krosuri, M. U. Khan and R. Junior Ndeddy Aka, Fuel Process. Technol., 2022, 227, 107120 CrossRef CAS.
- V. Y. Mena-Cervantes, R. Hernández-Altamirano and A. Tiscareño-Ferrer, Environ. Sci. Pollut. Res., 2020, 27, 28500–28509 CrossRef CAS PubMed.
- J. Kazimierowicz, M. Dębowski, M. Zieliński, S. Kasiński and C. Sanchez, J. Energies, 2024, 17(2), 338 CrossRef CAS.
- N. Yadav, G. Yadav and Md Ahmaruzzaman, Ind. Crops Prod., 2024, 210, 117999 CrossRef CAS.
- T. P. Snyder and C. G. Hill Jr, Catal. Rev.: Sci. Eng., 1989, 31(1–2), 43–95 CrossRef CAS.
- T. Ma, M. Yin, C. Su, N. Guo, X. Huang, Z. Han, Y. Wang, G. Chen and Z. Yun, J. Ind. Eng. Chem., 2023, 117, 85–102 CrossRef CAS.
- F. Fernandes Barbosa and T. Pinheiro Braga, ChemCatChem, 2023, 15(2), e202200950 CrossRef CAS.
- S. R. Ginjupalli, P. K. Balla, N. P. Rajan and R. K. Pothu, et al. , Biomass Convers. Biorefin., 2023, 13, 12749–12761 CrossRef CAS.
- S. Mahendran, S. Hayami and P. Selvam, Catalysis in Confined Frameworks: Synthesis, Characterization, and Applications, 2024, pp. 433–449 Search PubMed.
- S. Rao Ginjupalli, S. Mugawar, P. Rajan, P. Kumar Balla and V. R. Chary Komandur, Appl. Surf. Sci., 2014, 309, 153–159 CrossRef CAS.
- X. Zhang and Z. Zhao, Mater. Lett., 2024, 357, 135679 CrossRef CAS.
- G. Centi, F. Trifiro, J. R. Ebner and V. M. Franchetti, Chem. Rev., 1988, 88, 55 CrossRef CAS.
- Y. Kamiya, J. Jpn. Pet. Inst., 2003, 46, 62 CrossRef.
- F. Wang, J. L. Dubois and W. Ueda, J. Catal., 2009, 268, 260 CrossRef CAS.
- F. Wang, J. L. Dubois and W. Ueda, Appl. Catal., A, 2010, 376, 25 CrossRef CAS.
- N. P. Rajan, G. S. Rao, V. Pavankumar and K. V. Chary, Catal. Sci. Technol., 2014, 4(1), 81–92 RSC.
- R. A. Overbeek, A. R. C. J. Pekelharing, A. J. van Dillen and J. W. Geus, Appl. Catal., A, 1996, 135, 231 CrossRef CAS.
- J. Liu, P. Wang, P. Xu, Z. Xu, X. Feng, W. Ji, H. Arandiyan and C.-T. Au, ACS Sustainable Chem. Eng., 2020, 8(49), 18034–18043 CrossRef CAS.
- Y. Gu, H. Liu, M. Yang, Z. Ma, L. Zhao, W. Xing, P. Wu, X. Liu, S. Mintova, P. Bai and Z. Yan, Appl. Catal., B, 2020, 274, 119089 CrossRef CAS.
- G. Tuci, Y. Liu, A. Rossin, X. Guo, C. Pham, G. Giambastiani and C. Pham-Huu, Chem. Rev., 2021, 121(17), 10559–10665 CrossRef CAS.
- X.-K. Li, W.-J. Ji, J. Zhao, Z. Zhang and C.-T. Au, Appl. Catal., A, 2006, 306, 8–16 CrossRef CAS.
- N. P. Rajan, S. Ginjupalli, B. Ponnala, S. K. Hussain, S. Kim and P. Balla, New J. Chem., 2023, 47(15), 7253–7262 RSC.
- W. Nie, Z. Wang, W. Ji, Y. Chen and C. T. Au, Appl. Catal., A, 2003, 244(2), 265–272 CrossRef CAS.
- R.-M. Feng, X.-J. Yang, W.-J. Ji, Y. Chen and C.-T. Au, J. Catal., 2007, 246, 166–176 CrossRef CAS.
- L. Oliveira, M. Pereira, A. Pacheli Heitman, J. Filho, C. Oliveira and M. Ziolek, Molecules, 2023, 28(4), 1527 CrossRef CAS PubMed.
- S. Kang, R. Miao, J. Guo and J. Fu, Catal. Today, 2021, 374, 61–76 CrossRef CAS.
- G. S. Rao, N. P. Rajan, V. Pavankumar and K. V. Chary, J. Chem. Technol. Biotechnol., 2014, 89, 1890–1897 CrossRef CAS.
- K. A. Resende, F. B. Noronha and C. E. Hori, Renewable Energy, 2020, 149, 198–207 CrossRef CAS.
- G. J. Hutchings, J. Mater. Chem., 2009, 19, 1222 RSC.
- G. Koyano, T. Okuhara and M. Misono, J. Am. Chem. Soc., 1998, 120, 767 CrossRef CAS.
- E. I. Ko and J. G. Weissman, Catal. Today, 1990, 8, 27 CrossRef CAS.
- V. N. Kalevaru, N. Madaan and A. Martin, Appl. Catal., A, 2011, 391, 52–62 CrossRef CAS.
- M. Paulisa, M. MartõÂna, D. B. Soria1, A. DõÂazb, J. A. Odriozolab and M. Montesa, Appl. Catal., A, 1999, 180, 411–420 CrossRef.
- F. Cavani, S. Ligi, T. Monti, F. Pierelli, F. Trifiro, S. Albonetti and G. Mazzoni, Catal. Today, 2000, 61, 203 CrossRef CAS.
- A. Martin, C. Janke and V. N. Kalevaru, Appl. Catal., A, 2010, 376, 13 CrossRef CAS.
- M. Ziyada, M. Rouimia and J. L. Portefaixb, Appl. Catal., A, 1999, 183, 93 CrossRef.
- K. Tanabe, M. Misono, Y. Ono and H. Hattori, New solid acids and bases, Stud. Surf. Sci. Catal., 1989, 51, 5 CrossRef.
- G. J. Hutchings and R. Higgins, J. Catal., 1996, 162, 153 CrossRef CAS.
- X. Wang, L. Xu, X. Chen, W. Ji, Q. Yan and Y. Chen, J. Mol. Catal. A: Chem., 2003, 206, 261 CrossRef CAS.
- S. Irusta, A. Boix, B. Pierini, C. Caspani and J. Petunchi, J. Catal., 1999, 187, 298 CrossRef CAS.
- V. V. Guliants, J. B. Benziger, S. Sundaresan, I. E. Wachs and A. M. Hirt, Catal. Lett., 1999, 62(2–4), 87 CrossRef CAS.
- M. H. C. de la Cruz, M. A. Abdel Rehim, A. S. Rocha, J. F. C. da Silva and E. R. Lachter, Catal. Commun., 2007, 8, 1650–1654 CrossRef CAS.
- P. G. Pries de Oliveira, J. G. Eon, M. Chavant, A. S. Riche, V. Martin, S. Caldarelli and J. C. Volta, Catal. Today, 2000, 57(3–4), 177 CrossRef CAS.
- A. M. Duarte-Farias, W. A. Gonzalez, P. G. Oliveira, J.-G. Eon, J.-M. Herrmann, M. Aouine, S. Loridant and J. C. Volta, J. Catal., 2002, 208, 238 CrossRef.
- W. Suprun, M. Lutecki, R. Glaser and H. Papp, J. Mol. Catal. A: Chem., 2011, 91, 342–343 Search PubMed.
- N. Pethan Rajan, G. Srinivasa Rao, B. Putrakumar and V. R. C. Komandur, RSC Adv., 2014, 4, 53419 RSC.
- X. Feng, Y. Yao, Q. Su, L. Zhao, W. Jianga, W. Ji and C.-T. Au, Appl. Catal., B, 2015, 164, 31–39 CrossRef CAS.
- G. Ruoppolo, G. Landi and A. Di Benedetto, Catalysts, 2020, 10, 673 CrossRef CAS.
Footnote |
| † Electronic supplementary information (ESI) available. See DOI: https://doi.org/10.1039/d4nj02063d |
| This journal is © The Royal Society of Chemistry and the Centre National de la Recherche Scientifique 2024 |

