 Open Access Article
Creative Commons Attribution 3.0 Unported Licence
Construction of organic–inorganic hybrid composites derived from C3N5 incorporated with CeO2 for enhanced photocatalytic hydrogen evolution†
Ashil Augustin a,
Manova Santhosh Yesupatham
 a,
M. D. Dhileepana,
Sanguk Son
 b,
Ezhakudiyan Ravindrana,
Bernaurdshaw Neppoliana,
Hyoung-il Kim
 *b and
Karthikeyan Sekar
 *a
*a
aDepartment of Chemistry, Faculty of Engineering and Technology, SRM Institute of Science and Technology, Kattankulathur, 603203, India. E-mail: karthiks13@srmist.edu.in
bDepartment of Civil & Environmental Engineering, Yonsei University, Seoul 03722, Republic of Korea. E-mail: hi.kim@yonsei.ac.kr
First published on 3rd September 2024
Abstract
Energy scarcity and environmental issues can be effectively addressed via photocatalytic hydrogen production. The effective combination of semiconductor materials can prevent exciton recombination, making it a highly effective method for enhancing photocatalytic activity. This study details the synthesis of a conjugated polymer encapsulated with a metal oxide photocatalyst using a simple ex situ method. The encapsulation of the polymer with CeO2 nanoparticles resulted in exceptional performance in H2 production, exhibiting improved visible light absorption and a significant increase in charge transfer efficiency. This is attributed to the high charge transfer and reduced recombination in the composite. Moreover, photogenerated holes led to a substantial decline in the recombination rate of excitons and concomitant enhancement in the rate of photocatalytic H2 production. Markedly, the observed hydrogen evolution for 10 wt% of CeO2 doped C3N5 composites is 1256 μmol g−1 h−1, whereas for C3N5, it is 125 μmol g−1 h−1. Electrochemical analysis showed that the optimized composites exhibit a low electron–hole recombination rate, and UV-vis spectroscopic analysis showed improved visible light absorption resulting in excellent photocatalytic activity. Notably, the proposed system offers a novel strategy for hydrogen evolution via photocatalysis using CeO2/C3N5 composites. Consequently, this research offers a new perspective on the design of organo–inorganic heterostructures and introduces a novel pathway to explore their catalytic capabilities.
Introduction
Fossil fuels, including crude oil, natural gas, and coal, play an essential role in satisfying the world's energy needs.1,2 It is anticipated that global energy consumption will increase by nearly 55% and CO2 emissions by 20% by 2024–2050.3,4 Global warming and fuel shortages that have resulted from the significant increase in the emission of greenhouse gases and the accelerated depletion of fossil fuels have compelled humanity to identify alternative renewable and pure energy sources.5 It is anticipated that the consumption of renewable energy will increase and reach approximately 247 exajoules by 2050. In contrast, the total consumption of renewable energy was 96 exajoules in 2024.6 Photocatalytic water splitting using semiconductors has been recognized as a sustainable and prospective green technology that has garnered significant attention owing to its ability to effectively convert sustainable solar energy into environmentally friendly hydrogen. A sustainable method for producing green hydrogen fuel is through photocatalytic water splitting, which utilizes pure solar energy.7–9 Owing to its environmentally friendly and sustainable nature, photocatalysis has garnered significant interest among many other potential technologies. It is based on the photosynthesis process occurring in plants to transform low-density solar energy into high-density energy fuels.10–12 To achieve this, research communities are working extremely hard to investigate effective, reliable, affordable, and visible-light sensitive materials. Innovation based on photocatalysis is useful as a viable, sustainable, cost-effective, reliable and steady solution to the world's power issues.13–15 Solar energy can be converted into sustainable hydrogen energy via photocatalytic water splitting using semiconductors irradiated by visible light, which is a safe and environmentally friendly process. Goodeve and Kitchener (1938) discovered that TiO2 could enhance dye removal efficiency under both vacuum and air conditions, and TiO2 remained stable after the completion of the reaction; this marked the beginning of semiconductor-based photocatalysts.16,17 Fujishima and Honda (1972) noticed photoelectrical water splitting on TiO2 films when solar light was being irradiated and the door to semiconductor-based photocatalyst innovation was opened as soon as the world became aware of this amazing accomplishment.18 However, the activity of the majority of photocatalysts is still constrained by the absence of active sites, severe recombination of photogenerated excitons, and diminished light-harvesting efficiency.19,20 Therefore, it is imperative to investigate novel photocatalysts with a broad spectral response that are extremely active to achieve sustainable hydrogen production. The modifiable band diagram, low toxicity, good thermal stability, and chemical stability of graphite carbon nitride (g-C3N5) have all been the subject of extensive research. In addition to that, the visible light absorption can be expanded and a rapid electron movement can be facilitated by the narrow band gap of g-C3N5.21–26 CeO2 is a type of rare earth metal oxide that is non-toxic and low-cost having a cubic crystalline n-type material with a 2.5 eV band gap. In the CeO2 unit cell, every Ce(IV) is linked in the octahedral interstitial with eight adjacent O2−, and each O2− is linked with four adjacent Ce(IV), forming a tetrahedral structure; here, Ce3+ and Ce4+ are capable of coexisting indefinitely and converting to each other effortlessly.27–29 The efficacy of photocatalysts will be improved, resulting in the multivalence property of CeO2, which enables the generation of robust interactions with other catalyst components for photocatalytic hydrogen production. Zou et al. have developed a CeO2 hybridised g-C3N4 composite, which produced a hydrogen yield of 860 μmol g−1 h−1.30 Sha et al. have discussed about the charge separation in CeO2/MnO2 nanoflakes with an efficiency of 540 μmol g−1 h−1 of hydrogen.31 Liu et al. have modified C3N5 with nickel oxide for improving the activity, which shows a yield of 357 μmol g−1 h−1 of hydrogen production.32 Still, there are no pertinent reports regarding the formation of a heterojunction between C3N5 and CeO2 for photocatalytic hydrogen evolution. The heterostructures obtained by the chemical binding of C3N5 and CeO2 composites effectively segregate and constrain the charge carrier recombination. As anticipated, the well-designed CeO2/C3N5 heterojunction, substantially improves the photocatalytic hydrogen evolution, without the need of additional co-catalysts.Materials
All chemicals and reagents 3-amino-1,2,4-triazole (C2H4N4) (≥98%), cerium(III) nitrate hexahydrate (Ce(NO3)3·6H2O) (≥98%), methanol (CH3OH) (≥98%), ethanol (CH3CH2OH) (≥99.5%), triethanolamine (C6H15NO3) (≥98%), lactic acid (C3H6O3) (≥98%), ascorbic acid (C6H8O6) (≥99%), sodium sulfide (Na2S) (≥98%), and sodium sulfite (Na2SO3) (≥98%) were obtained from Sigma Aldrich, TCI, and SRL India.Synthesis of C3N5
C3N5 was synthesized using a thermal polymerization method in a muffle furnace, as described in the literature by Wu et al. In a typical synthesis, 2 g of 3-amino-1,2,4-triazole was placed in a porcelain crucible and was gradually calcined at 550 °C with a heating rate of 2 °C min−1 for a period of 3 h. Bulk C3N5 is a dark-yellowish product that was collected and crushed into a powder after naturally cooling to room temperature33 (Scheme 1a).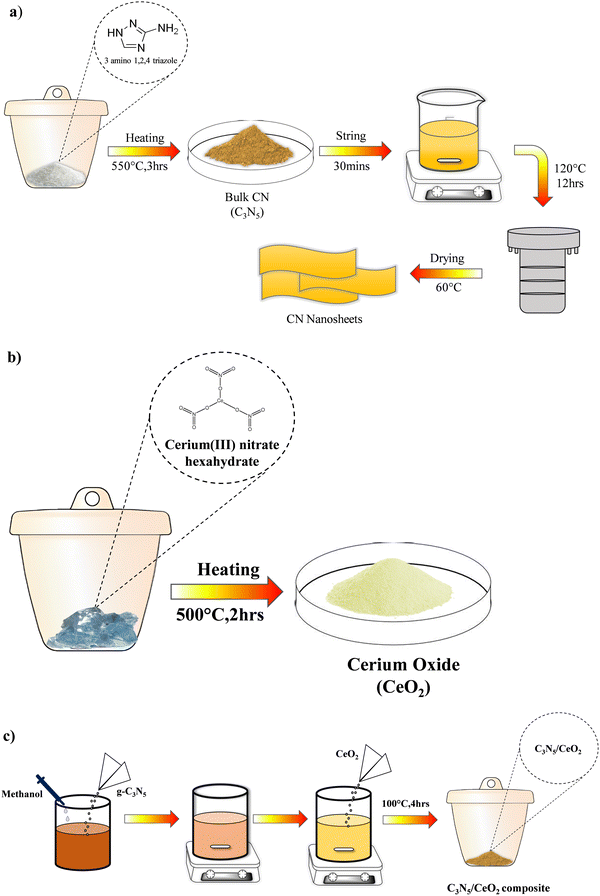 | ||
| Scheme 1 (a). Schematic representation of the synthesis of C3N5. (b) Schematic representation of the synthesis of CeO2. (c) Schematic representation of the synthesis of the C3N5/CeO2 composite. | ||
Synthesis of CeO2
CeO2 was synthesized by a thermal polymerization method in a muffle furnace, as described in the literature by Song et al. Briefly, 2.0 g cerium(III) nitrate hexahydrate (Ce(NO3)3·6H2O) was calcined at 500 °C for 2 h in the muffle furnace with a heating rate of 2 °C min−1. CeO2 is a light-yellowish product that was collected and crushed into a powder after naturally cooling to room temperature34 (Scheme 1b).Synthesis of C3N5/CeO2 composite
The C3N5/CeO2 heterostructures were synthesized as follows: 100 mg of C3N5 was mixed in 25 mL of methanol under an ultrasonic setting for 30 min, and then a sufficient amount of CeO2 was immersed into the suspensions. The mixture was vigorously stirred at room temperature, followed by half an hour of ultrasonic treatment to remove the organic solvent. The resultant dark yellowish powder was then calcined for 4 h at 100 °C with a 2 °C min−1 heating rate. The composite catalysts were designated as 5 wt% C3N5/CeO2, 10 wt% C3N5/CeO2, 15 wt% C3N5/CeO2, and 20 wt% C3N5/CeO2 by various weight percentages of the polymer content (5, 10, 15, 20 wt%) in the composite (Scheme 1c). The term “C3N5/CeO2” refers to 10 wt% C3N5/CeO2 in the subsequent text.Characterisation
The phase purity and crystallinity of the prepared photocatalysts were assessed through X-ray diffraction utilizing a PANalytical X’Pert particle diffractometer with Cu Kα radiation (λ = 1.5406 A). Shimadzu IRTracer-100 was used to carry out the Fourier-transform infrared spectroscopy (FT-IR). The morphology of the nanocomposites was examined utilizing high-resolution transmission electron microscopy (HRTEM, JEOL Japan, JEM-2100 Plus) and field emission scanning electron microscopy (FE-SEM) (FEI Quanta FEG 200). UV-vis diffuse reflectance (UV-DRS) data were acquired through the utilization of a Shimadzu UV-3600i Plus UV-vis spectrophotometer. The photoluminescence (PL) spectra were analysed using a fluorescence spectrophotometer (Horiba, Fluorolog-QM).Photoelectrochemical measurements
The CHI 760E electrochemical workstation was employed to acquire the Mott–Schottky, impedance and transient photocurrent responses. Ag/AgCl and a platinum wire serve as the reference and counter electrode, respectively. As an electrolyte, a 0.5 M Na2SO4 aqueous solution is utilized. The slurry was prepared through the deposition of 2.5 g of the catalyst dispersed in a mixture of deionized water and anhydrous ethanol (1![[thin space (1/6-em)]](https://www.rsc.org/images/entities/char_2009.gif) :
:![[thin space (1/6-em)]](https://www.rsc.org/images/entities/char_2009.gif) 1) and coated on the working electrode (glassy carbon electrode) for electrochemical studies.
1) and coated on the working electrode (glassy carbon electrode) for electrochemical studies.
Photocatalytic studies
The photocatalytic hydrogen generation reaction was performed in direct sunlight. The reaction was carried out in a Kjeldhal flask containing 5 mg of the catalyst dispersed in 50 ml of 5% sacrificial agent. The dissolved gases were eliminated from the reaction solution by purging with nitrogen gas for 15 minutes. The reaction setup was kept under sunlight, and an offline gas chromatograph (Shimadzu GC-2014 equipped with a Molecular Sieve [5 Å column]) analysed hydrogen generation with a TCD detector after the reaction setup was kept in sunlight for a period of 3 hours. The mean solar light intensity was ascertained to be 80![[thin space (1/6-em)]](https://www.rsc.org/images/entities/char_2009.gif) 000 lux using a lux meter. While the pH of the reaction mixture was adjusted using solutions of NaOH and H2SO4, various sacrificial agents were employed when necessary.
000 lux using a lux meter. While the pH of the reaction mixture was adjusted using solutions of NaOH and H2SO4, various sacrificial agents were employed when necessary.
Results and discussion
Fig. 1 shows the crystal structures of CeO2, C3N5, and the 10 wt% CeO2/C3N5 nanocomposite revealed by the XRD patterns (Fig. 1a). The CeO2 peaks in the XRD pattern can be found at 28.6°, 33.1°, 47.5°, 56.4°, and 59.1°, 69.2°,76.6° and 79.2°, which correspond to the (111), (200), (220), (311), (222), (400), (331) and (420) planes, respectively, of the fluorite crystal structure (JCPDS 34-0394) (Fig. 1b). The large peak (002) in the C3N5 XRD pattern, which is centered at 27.5 degrees, reveals the material's amorphous nature (JCPDS 87-1526). The XRD pattern of the CeO2/C3N5 nanocomposites reveals peaks that correlate to the synthesis of both CeO2 and C3N5. Rietveld analysis of CeO2 is obtained to understand the atomic percentage of the elements (Fig. S1, ESI†) composition. In the nanocomposite, the peak intensities of CeO2 increased and the C3N5 peak intensity decreased, indicating some degree of crystallographic disorder brought on by the addition of C3N5. The stretching vibration of the surface free amino group and the hydroxyl group of water is represented by the wide peak of pure C3N5 at 3000–3600 cm−1 in (Fig. S2, ESI†). The typical stretching vibration of C–N and C–N heterocycles is responsible for the peaks at 1235 cm−1, 1316 cm−1, 1411 cm−1, 1571 cm−1, and 1637 cm−1. The characteristic stretching vibration of the s-triazine ring unit is represented by the peak at 805 cm−1. The characteristic peaks of C3N5 and CeO2 remained unaltered in the composite, as evidenced by the presence of all characteristic vibration peaks in the corresponding CeO2/C3N5 composites.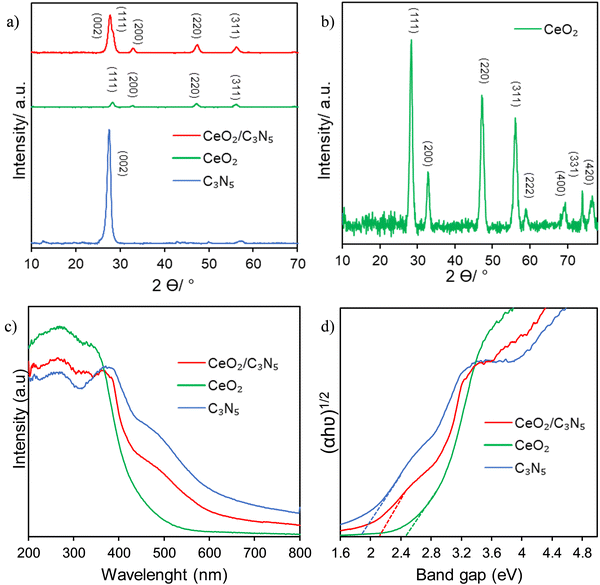 | ||
| Fig. 1 (a) XRD patterns of C3N5, CeO2 and CeO2/C3N5 composites. (b) XRD patterns of CeO2. (c) UV-vis absorbance spectra and (d) optical band gap using relative Tauc plots. | ||
The UV-Vis diffuse reflectance spectra of the modified samples are illustrated in Fig. 1(c). The CeO2 shows an absorption below 500 nm. Nevertheless, the photo response of exposed CeO2 is expanded to the visible region when it is combined with C3N5. The band gap positions of CeO2 and g-C3N5 are calculated as 2.5 eV and 1.9 eV, respectively, using the Tauc plot, as illustrated in Fig. 1(d). This may be attributed to the fact that C3N5 effectively functions in absorbing significant quantities of visible light particles. This confirms the efficacy of C3N5 for visible light harvesting.
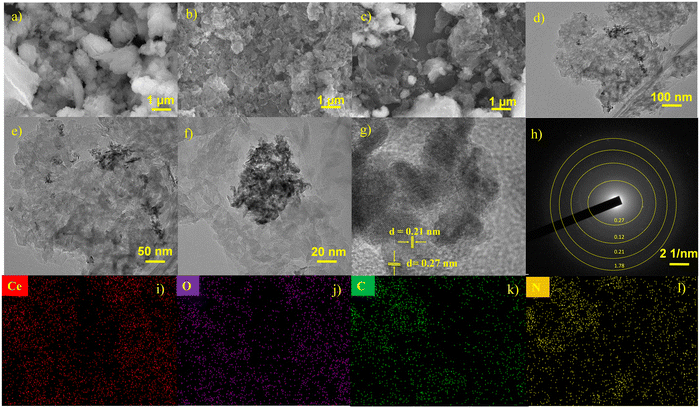
The morphologies of CeO2, C3N5 and CeO2/C3N5 have been closely observed using SEM analysis. The SEM images show the presence of both CeO2 incorporated into C3N5. The impact of CeO2 on the morphological structure of C3N5 is clearly visible in the composite (Fig. 2(a–c)). The TEM images reveal the composite formation between CeO2 and C3N5 in Fig. 2(e–g). As demonstrated, the micromorphology of g-C3N5 sheets is clearly observed, and the presence of CeO2 particles is confirmed. The influence of CeO2 decoration on the structure of C3N5 is clearly visible in the TEM images. Fig. 2(e) shows clear (111) and (220) crystal planes with lattice fringes with a spacing of 0.21 nm and 0.27 nm, respectively. The crystallite size of CeO2 and C3N5 is calculated as 7.13 nm and 8.55 nm (Table S2, ESI†). The acquired images confirmed the existence of crystallized CeO2 nanoparticles encircled by an exceedingly thin layer of C3N5, which reflects the composite's extremely low concentration. (Fig. S3, ESI†). The images show that the CeO2 nanoparticles were evenly distributed on the host photocatalyst, which shows that the CeO2 nanoparticles were evenly distributed on the host photocatalyst, which is a sign of a good deposition process.
By employing X-ray photoelectron spectroscopy (XPS), the electronic chemical states and surface elemental composition of CeO2, C3N5 and CeO2/C3N5 were ascertained (Fig. 3). The CeO2, C3N5 and CeO2/C3N5 composite, as indicated by the XPS survey spectra presented in Fig. S4 (ESI†), comprise the elements Ce, O, C and N. The C 1s spectra of C3N5 depict the binding energies at 284.9 eV, 287.6 eV and 288.3 eV, corresponding to C–C/C![[double bond, length as m-dash]](https://www.rsc.org/images/entities/char_e001.gif) C, N
C, N![[double bond, length as m-dash]](https://www.rsc.org/images/entities/char_e001.gif) C and C–NH bonds, respectively. In the high resolution of N 1s spectra, two main peaks at 402.3 eV and 404.1 eV are attributed to CN
C and C–NH bonds, respectively. In the high resolution of N 1s spectra, two main peaks at 402.3 eV and 404.1 eV are attributed to CN![[double bond, length as m-dash]](https://www.rsc.org/images/entities/char_e001.gif) C and C–N
C and C–N![[double bond, length as m-dash]](https://www.rsc.org/images/entities/char_e001.gif) N–C groups, respectively. In addition, the peak at 406.9 eV is generated by N–H bonds. In the O 1s spectra, the peak labelled at 528.8 eV is attributed to the lattice oxygen in CeO2. Apart from this, a broad peak is deconvoluted at 532.3 eV and 538 eV, which is attributed to oxide defects and adsorbed oxygen, respectively. The high-resolution Ce 3d spectrum of CeO2 is deconvoluted. Ce4+ is the dominant state, and its characteristic spectrum is represented by the peak with high intensity at 914.2 eV. Furthermore, the Ce 3d5/2 spin–orbit is represented by the peaks at 879.8 eV, 884.7 eV and 887.1 eV. The Ce 3d3/2 spin–orbit is shown by the peaks at 903.7 eV, 900.4 eV, 899.3 eV, and 895.4 eV (Fig. S5, ESI†). The sample surface is not completely oxidized, as evidenced by the presence of Ce3+/Ce4+ oxidation states on the surface of CeO2/C3N5 composites (Table S2, ESI†).
N–C groups, respectively. In addition, the peak at 406.9 eV is generated by N–H bonds. In the O 1s spectra, the peak labelled at 528.8 eV is attributed to the lattice oxygen in CeO2. Apart from this, a broad peak is deconvoluted at 532.3 eV and 538 eV, which is attributed to oxide defects and adsorbed oxygen, respectively. The high-resolution Ce 3d spectrum of CeO2 is deconvoluted. Ce4+ is the dominant state, and its characteristic spectrum is represented by the peak with high intensity at 914.2 eV. Furthermore, the Ce 3d5/2 spin–orbit is represented by the peaks at 879.8 eV, 884.7 eV and 887.1 eV. The Ce 3d3/2 spin–orbit is shown by the peaks at 903.7 eV, 900.4 eV, 899.3 eV, and 895.4 eV (Fig. S5, ESI†). The sample surface is not completely oxidized, as evidenced by the presence of Ce3+/Ce4+ oxidation states on the surface of CeO2/C3N5 composites (Table S2, ESI†).
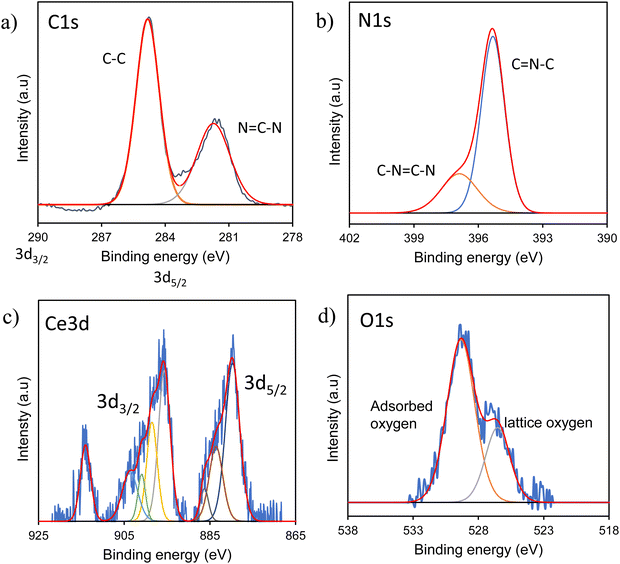 | ||
| Fig. 3 High-resolution XPS spectra of CeO2/C3N5 composites: (a) C 1s, (b) N 1s, (c) Ce 3d, and (d) O 1s. | ||
The CeO2/C3N5 composite is more mobile and has a greater resistance to charge recombination, as indicated by the reduced arc radius of the electrochemical impedance spectroscopy (EIS) Nyquist plot in comparison to that of CeO2 and C3N5 (Fig. 4a). Mott–Schottky analyses were performed on CeO2 and g-C3N5 to clarify the flat band potential of the pristine materials. Possibly, the positive slope represented an n-type semiconductor (Fig. 4c and d). In contrast to the redox potential of H+/H2, the flat band positions of C3N5 and CeO2 concerning the Ag/AgCl electrode were −1.42 eV and −1.08 eV, respectively, both of which were more negative (eqn (S1), ESI†). The conduction band potential (CB) and flat band in n-type semiconductors are well established. Additionally, as demonstrated by the transient photocurrents in Fig. 4(b), CeO2/C3N5 demonstrates a significantly higher photocurrent density than the pristine materials when subjected to intermittent light irradiation. The improved charge transfer and separation efficacy of the CeO2/C3N5 nanocomposite is illustrated by its increased photocurrent response, which is accompanied by a decreased rate of photogenerated charge carrier recombination. The PL intensity of the composite is lower than that of individual counterparts, which implies that it has a higher charge carrier separation efficiency (Fig. S6, ESI†). In summary, the photoelectrochemical data indicated that the photoelectron transport efficacy of the catalyst can be enhanced through the formation of a CeO2/C3N5 nanocomposite.
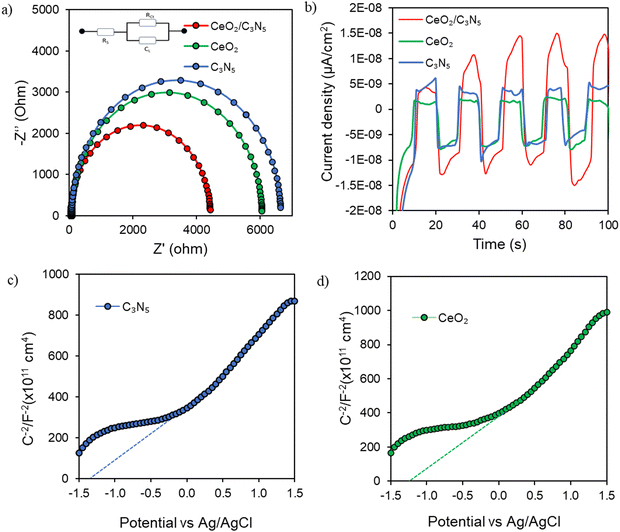 | ||
| Fig. 4 (a) Impedance spectra plots, (b) photocurrent response, and (c) and (d) Mott–Schottky analysis of the samples. | ||
Photocatalytic activity
In the presence of a hole scavenger in deionized water, the photocatalytic efficiency was evaluated in response to direct sunlight (Fig. 5). | ||
| Fig. 5 (a) Photocatalytic H2 evolution rates of the CeO2/C3N5 composite. (b) Photocatalytic H2 evolution rate with different scavengers. (c) Stability study. | ||
The optimization of the CeO2-C3N5 composite, exhibiting notable photocatalytic activity, has been carried out using pristine CeO2, C3N5, 5 wt% CeO2/C3N5, 10 wt% CeO2/C3N5, 15 wt% CeO2/C3N5, and 20 wt% CeO2/C3N5 composites. The 10 wt% CeO2/C3N5 composite produced an efficiency of 1256 μmol g−1 h−1 (Fig. 5a). This value is considerably greater than that of the pristine material (125 μmol g−1 h−1) and other composites. With increasing CeO2, the rate of H2 evolution initially increases and then decreases. Under visible-light irradiation, the H2 evolution rate of the 10 wt% CeO2/C3N5 heterojunction can reach its maximum value with the loading amount of CeO2. The values obtained are comparatively higher than those of the published articles in the field of photocatalytic hydrogen production, which is discussed in Table S1 (ESI†). The photocatalytic hydrogen evolution is carried out using different scavengers, including methanol, TEOA, glycerol and lactic acid, producing yields of 1290, 510, 1032, and 227 μmol g−1 h−1, respectively (Fig. 5b). In order to demonstrate the stability of the catalyst, the CeO2/C3N5 sample was subjected to four consecutive cycles (Fig. 5c), and the outcomes show that the sample exhibits high stability and hydrogen production. XRD characterization studies confirm the structural integrity of the catalyst after repeated use (Fig. S8, ESI†).
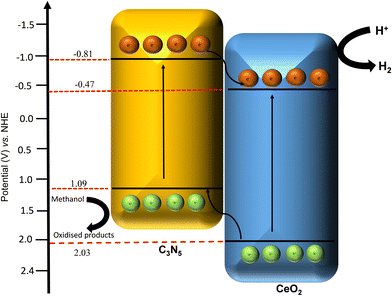
Finally, the electronic charge transfer, advantages of C3N5 integrating with CeO2 and formation of type II heterojunctions were understood based on the aforementioned results and prior experimental investigations. A potential mechanism for the 10 wt% CeO2/C3N5 composite is suggested in (Fig. 6) based on the observed results. e− is excited from the valence band (VB) to the conduction band (CB) of C3N5 and CeO2 by high-energy photons under light irradiation. Using the Mott Schottky analysis, the flat band positions of C3N5 and CeO2 with respect to the Ag/AgCl electrode were −1.42 eV and −1.08 eV, respectively, in contrast to the redox potential of H+/H2. The relationship between the flat band and the conduction band potential (CB) in n-type semiconductors is well-established. The conduction band edges were −0.81 eV and −0.47 eV, as calculated from the Tauc plot analysis (eqn (S2), ESI†). Therefore, a type II heterojunction mechanism was suggested for the CeO2/C3N5 composite in response to the band levels of C3N5 and CeO2. The conduction band accumulates excited electrons (e−) in response to photon irradiation, while the valence band of C3N5 and CeO2 accumulates holes (h+). Due to variations in energy levels, the accumulated electrons migrate from the CB of C3N5 to the CB of CeO2. At the same time, the holes from the valence band of CeO2 are transferred to the valence band of C3N5. At the CB of CeO2, the reduction of H+ to hydrogen occurs concurrently, while the oxidation of the hole scavenger occurs at the VB of C3N5. Consequently, the synergistic effect of C3N5 and CeO2 can effectively separate photoelectron-hole pairs, enticing a greater number of carriers to participate in the photodegradation process, thereby improving the photocatalytic activity.
Conclusion
In summary, the CeO2 dopedC3N5 composite is the product of a straightforward synthesis method, which led to the successful development of CeO2-incorporated C3N5. The primary goal of this research is to investigate the impact of organic–inorganic hybrid photocatalysts by optimizing the catalyst to enhance the reaction performance. According to the results of the morphological investigation, the composition and morphological transformation of the synthesized samples are significantly affected by CeO2 dispersed on C3N5. Moreover, the optical band gap decreased, leading to an increased absorption of the visible spectrum. In addition, photoelectrochemical methods have consistently exhibited an effective ability to prevent the recombination of photogenerated electron–hole pairs. Notably, the photocatalytic hydrogen evolution for the10 wt% CeO2 doped C3N5 catalyst is 1256 μmol g−1 h−1, which is 10 times greater than that of C3N5 alone (125 μmol g−1 h−1). Due to the efficient transfer of photogenerated holes, the recombination rate of excitons has been significantly reduced with the simultaneous enhancement of the rate of photocatalytic H2 production. This study offers a unique perspective that aids in creating innovative photocatalysts for efficient solar energy conversion into fuel.Data availability
The data supporting this article have been included within the manuscript and as part of the ESI.†Conflicts of interest
The authors declare no conflict of interest.Acknowledgements
The authors appreciate the support from the SRM Institute of Science and Technology, India. S. K. would like to thank the Royal Society-Newton International Fellowship Alumni follow-on funding support AL\211016 and AL\221024. S. K. is also grateful to the SERB Start-up Research Grant (SRG/2023/000658). We acknowledge SRMIST for the fellowship and SRM-SCIF and Nanotechnology Research Centre (NRC) for the research facilities.References
- S. Chu and A. J. Majumdar, Nature, 2012, 488, 294–303 CrossRef CAS PubMed.
- T. Hisatomi and K. J. Domen, Nat. Catal., 2019, 2, 387–399 CrossRef CAS.
- L. Wang, S. Duan, P. Jin, H. She, J. Huang, Z. Lei, T. Zhang and Q. J. Wang, Appl. Catal., B, 2018, 239, 599–608 CrossRef CAS.
- A. Naldoni, M. Altomare, G. Zoppellaro, N. Liu, S. Kment, R. Zboril and P. J. Schmuki, ACS Catal., 2018, 9, 345–364 CrossRef PubMed.
- X. Yin, X. Zhao and W. J. Zhang, Energy, 2018, 158, 1204–1212 CrossRef.
- M. I. Alhamid, Y. Daud, A. Surachman, A. Sugiyono, H. Aditya, T. J. R. Mahlia and S. E. Reviews, Renewable Sustainable Energy Rev., 2016, 53, 733–740 CrossRef.
- C. Xia, H. Wang, J. K. Kim and J. J. Wang, Adv. Funct. Mater., 2021, 31, 2008247 CrossRef CAS.
- W. Zhou, W. Li, J.-Q. Wang, Y. Qu, Y. Yang, Y. Xie, K. Zhang, L. Wang, H. Fu and C. S. Zhao, J. Am. Chem. Soc., 2014, 136, 9280–9283 CrossRef CAS PubMed.
- D. Ma, D. Sun, Y. Zou, S. Mao, Y. Lv, Y. Wang, J. Li and J.-W. Shi, J. Colloid Interface Sci., 2019, 549, 179–188 CrossRef CAS PubMed.
- A. Augustin, C. Chuaicham, M. Shanmugam, B. Vellaichamy, S. Rajendran, T. K. Hoang, K. Sasaki and K. J. Sekar, Nanoscale Adv., 2022, 4, 2561–2582 RSC.
- L. Yu, G. Zhang, C. Liu, H. Lan, H. Liu and J. J. A. C. Qu, ACS Catal., 2018, 8, 1090–1096 CrossRef CAS.
- Y. Zhang, D. Ma, J. Li, C. Zhi, Y. Zhang, L. Liang, S. Mao and J.-W. J. C. C. R. Shi, Coord. Chem. Rev., 2024, 517, 215995 CrossRef CAS.
- M. Shanmugam, C. Chuaicham, A. Augustin, K. Sasaki, P. J. Sagayaraj and C. Sekar, New J. Chem., 2022, 46, 15776–15794 RSC.
- M. S. Yesupatham, A. Augustin, N. Agamendran, B. H. Honnappa, M. Shanmugam, P. J. Sagayaraj, T. Ganesan, N. C. S. Selvam and K. J. Sekar, Sustainable Energy Fuels, 2023, 7, 4727–4757 RSC.
- D. Ma, J. Chen, J. Li, X. Ji and J.-W. Shi, J. Mater. Chem. A, 2024, 12, 12293–12324 RSC.
- C. Goodeve and J. J. Kitchener, Trans. Faraday Soc., 1938, 34, 570–579 RSC.
- Y. Zou, S. Li, D. Zheng, J. Feng, S. Wang, Y. Hou and G. J. Zhang, Sci. China Chem., 2024, 1–9 Search PubMed.
- A. Fujishima and K. J. n Honda, Nature, 1972, 238, 37–38 CrossRef CAS PubMed.
- C. Hu, Y.-H. Lin, M. Yoshida and S. J. Ashimura, ACS Appl. Mater., 2021, 13, 24907–24915 CrossRef CAS PubMed.
- D. Ma, Z. Zhang, Y. Zou, J. Chen and J.-W. J. Shi, Coord. Chem. Rev., 2024, 500, 215489 CrossRef CAS.
- B. Debnath, S. Singh, S. M. Hossain, S. Krishnamurthy, V. Polshettiwar and S. J. L. Ogale, Langmuir, 2022, 38, 3139–3148 CrossRef CAS PubMed.
- H. Wang, M. Li, Q. Lu, Y. Cen, Y. Zhang and S. J. Yao, ACS sustainable Chem., 2018, 7, 625–631 CrossRef.
- P. Kumar, E. Vahidzadeh, U. K. Thakur, P. Kar, K. M. Alam, A. Goswami, N. Mahdi, K. Cui, G. M. Bernard and V. K. Michaelis, J. Am. Chem. Soc., 2019, 141, 5415–5436 CrossRef CAS PubMed.
- Q. Wang, S. Li, D. Zheng, S. Wang, Y. Hou and G. J. Zhang, ACS Appl. Energy Mater., 2024, 7, 6090–6095 CrossRef CAS.
- Q. Wang, G. Zhang, W. Xing, Z. Pan, D. Zheng, S. Wang, Y. Hou and X. J. Wang, Angew. Chem., 2023, 135, e202307930 CrossRef.
- B. K. Raja, M. Govindaraj, M. K. Muthukumaran and S. J. Ramar, New J. Chem., 2024, 48, 15324–15337 RSC.
- D. Gao, Y. Zhang, Z. Zhou, F. Cai, X. Zhao, W. Huang, Y. Li, J. Zhu, P. Liu and F. J. Yang, J. Am. Chem. Soc., 2017, 139, 5652–5655 CrossRef CAS PubMed.
- Y. Wang, Z. Chen, P. Han, Y. Du, Z. Gu, X. Xu and G. J. A. C. Zheng, ACS Catal., 2018, 8, 7113–7119 CrossRef CAS.
- J. Tian, Y. Sang, Z. Zhao, W. Zhou, D. Wang, X. Kang, H. Liu, J. Wang, S. Chen and H. J. Cai, Small, 2013, 9, 3864–3872 CrossRef CAS PubMed.
- W. Zou, Y. Shao, Y. Pu, Y. Luo, J. Sun, K. Ma, C. Tang, F. Gao and L. J. Dong, Appl. Catal., B, 2017, 218, 51–59 CrossRef CAS.
- M. A. Sha, G. Mohanan, L. Elias, T. Bhagya and S. J. Shibli, Mater. Chem. Phys., 2023, 294, 127019 CrossRef CAS.
- M.-Y. Liu, J.-Y. Wang, D. Lian, L. Xian and L. J. Zhang, J. Fuel Chem., 2022, 50, 243–249 CrossRef CAS.
- B. Wu, T. Sun, N. Liu, L. Lu, R. Zhang, W. Shi and P. J. Cheng, ACS Appl. Mater. Interfaces, 2022, 14, 26742–26751 CrossRef CAS PubMed.
- J. Song, F. Wu, Y. Lu, X. Zhang and Z. J. Li, ACS Appl. Nano Mater., 2021, 4, 4800–4809 CrossRef CAS.
Footnote |
| † Electronic supplementary information (ESI) available: Fig. S1. Rietveld analysis of the CeO2 photocatalyst and composition of the CeO2 photocatalyst. Fig. S2. FTIR spectra of C3N5, CeO2 and C3N5/CeO2 composites. Fig. S3. (a) SEM image (b) and (c) respective energy-dispersive spectroscopy ratio of the CeO2/C3N5 composite (Ce, O, C, and N elements). Fig. S4. Survey XPS spectra of CeO2, C3N5 and C3N5/CeO2 composites. Fig. S5. High resolution XPS spectra of CeO2 and C3N5 pristine materials: (a) C 1s, (b) N 1s, (c) Ce 3d, and (d) O 1s. Fig. S6. Photoluminescence spectra of the samples. Fig. S7. Mott–Schottky analysis of the samples: (a) CeO2 and (b) C3N5. Fig. S8. XRD analysis of the C3N5/CeO2 composite after and before the reaction study. Table S1. Physiochemical properties of the pristine catalyst used for photocatalytic application. Table S2. Elemental composition of C3N5, CeO2 and C3N5/CeO2 composites. Table S3. Activity comparison of some representative photocatalysts for photocatalytic hydrogen production. See DOI: https://doi.org/10.1039/d4ya00476k |
| This journal is © The Royal Society of Chemistry 2024 |

