
Application of a simple copper(II) complex compound as an epinephrine selective voltammetric sensor in the presence of uric acid under aqueous conditions†
Daria
Nowicka
*a,
Karol
Garbaczewski
a,
Teresa
Łuczak
a,
Giuseppe
Forte
 b,
Giuseppe
Consiglio
c,
Maciej
Kubicki
a,
Violetta
Patroniak
a and
Adam
Gorczyński
*a
b,
Giuseppe
Consiglio
c,
Maciej
Kubicki
a,
Violetta
Patroniak
a and
Adam
Gorczyński
*a
aFaculty of Chemistry, Adam Mickiewicz, University in Poznań, Uniwersytetu Poznańskiego 8, 61-614 Poznań, Poland. E-mail: d.nowicka@amu.edu.pl; adam.gorczynski@amu.edu.pl
bDepartment of Drug Science and Health, University of Catania, Via S. Sofia 64, 95125, Italy
cDepartment of Chemical Science, University of Catania, Via S. Sofia 64, 95125, Italy
First published on 21st November 2024
Abstract
Developing sensors with high sensitivity and selectivity for detecting neurotransmitters under near-physiological conditions is a major challenge and is crucial for preventing diseases of the nervous, cardiovascular, and endocrine systems. Most existing systems that meet these requirements involve either complicated synthesis processes, require sulfur groups, or are not functional under aqueous conditions. Herein, we report that the self-organisation of a simple imine ligand L with copper(II) tetrafluoroborate leads to the formation of a [CuL2](BF4)2 complex (CuL2) with a 2![[thin space (1/6-em)]](https://www.rsc.org/images/entities/char_2009.gif) :1 ligand-to-metal ratio, as confirmed by high-resolution electrospray ionization mass spectrometry (HR ESI-MS), Fourier-transform infrared (FT-IR) spectroscopy and single-crystal X-ray analysis. Surprisingly, modifying a gold surface with a self-assembled monolayer of the CuL2 complex created a stable sensor for selective detection of epinephrine (EP) using differential pulse voltammetry (DPV) in phosphate buffer solution (PBS) at pH 7.0. A linear correlation between the current response and the concentration of EP was observed with a detection limit of 0.03 μM, high reproducibility and good stability in the range of 0.0001 to 0.875 mM. These results show that the new sensor (Cu/Au) can serve as a reliable analytical tool to selectively detect EP alone and in a mixture with coexisting uric acid (UA) in tested samples.
:1 ligand-to-metal ratio, as confirmed by high-resolution electrospray ionization mass spectrometry (HR ESI-MS), Fourier-transform infrared (FT-IR) spectroscopy and single-crystal X-ray analysis. Surprisingly, modifying a gold surface with a self-assembled monolayer of the CuL2 complex created a stable sensor for selective detection of epinephrine (EP) using differential pulse voltammetry (DPV) in phosphate buffer solution (PBS) at pH 7.0. A linear correlation between the current response and the concentration of EP was observed with a detection limit of 0.03 μM, high reproducibility and good stability in the range of 0.0001 to 0.875 mM. These results show that the new sensor (Cu/Au) can serve as a reliable analytical tool to selectively detect EP alone and in a mixture with coexisting uric acid (UA) in tested samples.
1. Introduction
Epinephrine (EP), otherwise known as adrenaline, is classified as an important catecholamine neurotransmitter necessary for the proper functioning of the central nervous, cardiovascular and endocrine systems of mammals.1,2 Abnormal levels of EP in living organisms result in health problems. Thus, too high levels of EP may be associated with stress or hypothyroidism, while too low levels may indicate Parkinson's disease. Furthermore, epinephrine is commonly used in medicine as a drug to treat allergic reactions, glaucoma, asthma, sepsis, heartbeat stimulation or myocardial infarction.3–7To avoid the problems associated with abnormal EP concentrations, the development of a rapid, efficient and selective method for the quantification of this neurotransmitter in living organisms is needed. Numerous studies have led to advances in analytical procedures for EP sensing using spectroscopic,8 chromatographic9 and fluorescence10 methods. Unfortunately, their use is associated with high costs, prolonged analysis times and, most importantly, a lack of selectivity. A review of the literature shows that, as EP is readily oxidized, the most cost-effective methods for its quantification are electrochemical methods. EP determinations performed by the latter methods feature high selectivity, sensitivity, accuracy, precision and relatively low instrumentation costs.11 Unfortunately, EP occurs in the natural environment along with some small biomolecules, such as uric acid (UA), which oxidize at bare electrodes in almost the same potential range.12 Therefore, separation of the oxidation potentials of these compounds is necessary for accurate neurotransmitter determination.
Among miscellaneous attempts to overcome the above-mentioned problem, much attention has been paid to the application of altered electrodes to develop suitable EP sensors. Hence, in EP electrooxidation, a variety of chemically and/or electrochemically modified electrode templates was prepared and examined. Many modification attempts were devoted to electrodes made of various carbon materials, e.g. a carbon paste electrode (CPE) that was altered with carbon nanofibers13 or graphene quantum dot chitosan14 and used for EP detection. Subsequently, application of a glassy carbon electrode (GCE) coated with a biopolymer,15 catechol,16 polyrutin,17 Au nanoparticles18–20 or nanocomposites prepared from various nanoparticles and functionalized multiwalled carbon nanotubes21 for EP sensing was reported. In the literature there are also papers demonstrating modification of a screen printing electrode (SPE), including with dysprosium tungstate nanoparticles22 and Cu(II) nanocomplexes,23 for EP detection. In addition, there are also examples of selective EP sensing in the presence of UA, which were carried out on CPE coated with iron(II) phthalocyanine6 or graphene oxide (GO),24 and on SPE altered with a nanocomposite film combined with electrochemically reduced GO and NiO nanoparticles,25 among others. Concomitantly, the literature supports the possibility of selective EP determination using Au electrodes decorated with a self-assembled monolayer (SAM). Effective protection of the electrode surface from toxic reaction products is the major advantage of this type of modification.4,5,18,26–28 An Au electrode modified with SAM layers consisting of a Schiff base with thiol moieties27 or metallo-octacarboxyphthalocyanine complexes and cysteamine18 was used as a sensor for EP determination. The same interference was described on a gold electrode coated with 2-(2,3-dihydroxyphenyl)-1,3-dithiane SAM29 or AgNPs–penicillamine30 and on an Au nanoporous electrode.31 Moreover, the detection of EP in the presence of UA on the Au electrode modified with SAM layers formed by an iron(III) complex [Fe2(H3L)2(CH3OH)2(μ-OCH3)2](ClO4)4 based on a Schiff base4 has been reported by us.
The limited examples of gold electrode modification with SAMs of complex compounds prompted us to develop a Schiff base system that could serve as an inexpensive, environmentally friendly and stable epinephrine sensor with low detection and quantitation limits. By using well-defined small molecules, we aimed to address the reproducibility challenges typically associated with nanoparticle-based or hybrid systems. Herein, we synthesized a new copper(II) complex [CuL2](BF4)2 based on the N,N,N-donor imine ligand L, referred to here as CuL2. Due to its –NH groups, this complex readily forms SAMs on a bare gold surface through chemisorption. The resulting voltammetric sensor (Cu/Au) demonstrated effective EP detection both independently and in the presence of interfering UA under aqueous PBS conditions.
2. Experimental section
2.1. Materials and apparatus
Adrenaline (epinephrine) WZF 0.1% (300 mcg per 0.3 ml and 1 pre-filled syringe, 1 ml) for injections was bought from a local pharmacy. The remaining chemical substances and all solvents for synthesis, characterization and electrochemical measurements were bought from commercial sources (Sigma-Aldrich, Fluka, POCh-Gliwice) and used as delivered without any additional purification.Fourier-transform infrared (FT-IR) spectra were collected using a FT-IR IFS 66/s Bruker spectrometer and attenuated total reflection infrared spectra (ATR-IR) were recorded using a Nicolet iS 50 spectrometer, both in the range from 400 to 4000 cm−1. Electrospray ionization mass spectrometry (ESI-MS) was obtained utilizing a High-Resolution Bruker QTOF Impact HD spectrometer by dissolution of a powder sample of complex in a methanolic solution. Microanalyses were performed using a PerkinElmer 2400 CHN microanalyser. Thermogravimetry (TG) analysis was conducted on a Netzsch TG 209 Libra analyzer under a nitrogen atmosphere in the temperature range of 24–1000 °C. UV-vis absorption spectra with a concentration of 2.0 × 10⁻⁵ M in appropriate solution (MeOH or aqueous PBS with pH = 7.4) were recorded in the range of 250`600 nm using cuvettes of 1 cm path length by a JASCO V-770 spectrophotometer (JASCO, Japan). Scanning electron microscopy (SEM) analyses were performed using a Quanta 250 FEG, FEI scanning electron microscope with energy dispersive X-ray analysis (EDAX). The electrochemical measurements were performed with a potentiostat/galvanostat analyzer (AUTOLAB PGSTAT 302N, Eco Chemie, B.V., Utrecht, The Netherlands) at room temperature in a three-electrode system with a (unmodified or modified) gold electrode (99.999%, Polish State Mint) as a working electrode with a geometric area of 0.33 cm2, a saturated calomel electrode (SCE) as a reference electrode and a platinum wire as an auxiliary electrode. A pH meter (Model-ULAB 2002) was used to record pH measurements.
2.2. Synthesis of ligand L
Ligand L was obtained using a two-step synthesis process according to a synthesis report published earlier.32 The first step was a nucleophilic substitution reaction between two components: 2-bromopyridine and methylhydrazine in an excess, and the second step was the condensation between the product synthesized in the first step: primary amine 2-(1-methylhydrazinyl)pyridine and 4-imidazolecarboxaldehyde (Fig. S1†).2.3. Synthesis of copper(II) complex [CuL2](BF4)2
Complex [CuL2](BF4)2 was synthesized by adding Cu(BF4)2·xH2O (17.90 mg, 0.075 mmol) to a methanolic solution of the imine ligand L (30.00 mg, 0.15 mmol) at a molar ratio of 1:2 (ligand:metal) (Fig. S2†). The reaction mixture was stirred using a magnetic stirrer in a 50 ml round-bottom flask for 24 h at room temperature to give a dark-green solution. The reaction mixture was concentrated and then Et2O was added. The precipitate was obtained, filtered via suction filtration, washed with Et2O (2 × 5 ml) and dried under vacuum. Yield: 42.53 mg, 88.7% based on ligand L.
[CuL2](BF4)2: HRMS (ESI) m/z; found: [CuL(BF4)(MeCN)]+ 393.2050; requires [CuL(BF4)(MeCN)]+ 393.2027 (5.85 ppm); found: [Cu(L–H)L(BF4)Na]+ 575.1980; requires [Cu(L–H)L(BF4)Na]+ 575.1955 (4.35 ppm); found: [CuL2(BF4)MeCN]+ 593.2958; requires [CuL2(BF4)MeCN]+ 593.2931 (4.55 ppm). Elemental analysis calc. for C27H40B2CuF8N10O2 [CuL2](BF4)2·MeOH·iPr2O (773.83): C, 41.91; H, 5.21; N, 18.10; found: C, 42.00; H, 5.16; N, 18.16%. FT-IR (KBr cm−1): ν(N–H) 3527, 3343; ν(C–H)ar 3141; ν(C–H) 2896; ν(C![[double bond, length as m-dash]](https://www.rsc.org/images/entities/char_e001.gif) N)imine 1643; ν(CC)ar 1608, 1569, 1490, 1447; ν(C–N) 1323; ν(CN)ar 1214; ρ(C–H)ar 1056; γ(C–H)ar 849, 768, 613.
N)imine 1643; ν(CC)ar 1608, 1569, 1490, 1447; ν(C–N) 1323; ν(CN)ar 1214; ρ(C–H)ar 1056; γ(C–H)ar 849, 768, 613.
2.4. X-ray crystallography
Diffraction data were collected on a Rigaku XCalibur four-circle diffractometer with an EOS CCD detector using the ω-scan technique at 100(1) K with graphite-monochromated MoKα radiation (λ = 0.71073 Å). The data were adjusted for Lorentz-polarization and for absorption effects.33 Precise unit-cell parameters were obtained by least-squares fitting. The highest intensity reflections were selected from the entire experiment. The structure was solved with SHELXT34 and improved with the full-matrix least-squares procedure on F2 by SHELXL.35 All non-hydrogen atoms were refined anisotropically, while hydrogen atoms were posted in idealized positions and enhanced as a ‘riding model’ with isotropic displacement parameters set at 1.2 (1.5 for methyl groups) times Ueq of appropriate carrier atoms.Structural analysis crystallographic data were deposited at the Cambridge Crystallographic Data Centre.
2.5. Electrode activation and modification
All solutions were arranged using ultra-pure deionized water and were deaerated with highly pure argon (99.998%) prior to measurements, which were carried out at room temperature in pre-washed laboratory vessels in peroxymonosulfuric acid (Piranha solution, Caro acid). Before use, the bare Au electrode was polished with alumina slurries of successively decreasing final grades down to 0.05 μM (Buehler) on polishing cloths (Buehler). Then, the polished gold template was rinsed carefully with acetone and water and next, it was electrochemically activated by cycling within the range of E = −0.8 V and E = 0.6 V vs. SCE at dE/dt = 0.1 V s−1 in 0.5 M sodium hydroxide until the stable cyclic voltammogram was obtained. This described procedure evades structural changes on the Au surface.36 To modify the surface of the gold electrode with the self-assembling monolayer of CuL2, the activated bare Au electrode was immersed in 0. 01 mM CuL2 dissolved in PBS (0.06 M; pH 7.0) for 16 h at room temperature. After this time, the electrode was washed profusely with water to remove unadsorbed compounds from the electrode surface, dried in a stream of argon and stored at room temperature in an empty tube. The modified electrode thus prepared was ready-to-use for electrochemical measurements (denoted as Cu/Au in the manuscript).2.6. Molecular simulations
Molecular simulations of the studied complexes were performed using the Gaussian 16 software package.37 The geometries were fully optimized by employing the B3LYP functional in conjunction with the 6-311+G(2d,p) basis set. To calculate the absorption spectra, the TD-DFT method was applied with the same basis set, considering the lowest 20 singlet–singlet transitions employing the long-range corrected CAM-B3LYP functional.38,39 Solvent effects were modeled using the conductor-like polarizable continuum model (CPCM).40,413. Results and discussion
3.1. Synthesis of the complex and theoretical analysis
Copper(II) complex was synthesized via direct reaction of copper(II) tetrafluoroborate with ligand L and was isolated in very high yield via precipitation. Its structure was unambiguously determined to be mer-[CuL2](BF4)2, using single-crystal X-ray analysis (see section 3.2), whereas elemental analysis, high-resolution mass spectrometry together with FT-IR spectroscopy (Fig. S3†) and thermogravimetric analysis (Fig. S4†) confirmed the purity of the synthesized sample.To verify that the mer-configuration of the complex is retained in the solution and does not convert into the fac-isomer, density functional theory analysis was performed. The CuL2 complex, as obtained from X-ray crystallography, was subjected to an optimization procedure, and the resulting geometry is shown in Fig. 1A. In order to investigate the possibility of the mer-isomer converting into the fac-isomer, a study was conducted on the rotational barrier around the dihedral angle formed by atoms 1, 2, 3, and 4 (Fig. 1B-left), which the ligand must overcome to adopt the favorable geometry for the formation of the fac-isomer. For this purpose, the considered dihedral angle should assume a value close to 90°, as illustrated in Fig. 1B-right. The results obtained are shown in Fig. 1C and highlight that the absolute energy minimum of the monomer corresponds to the geometry with a dihedral angle of 177.20°, while a relative minimum is observed with a dihedral angle of −2.80°. However, this rotation is associated with a ΔG° of 5.29 kcal mol−1. Analysis of the population corresponding to some of these dihedral angle values is presented in Table 1, revealing a significant steric hindrance to the formation of a conformer at 90°, and consequently to the possibility of mer- to fac-isomer conversion, in agreement with the experimental synthetic results (vide infra).
 | ||
| Fig. 1 (A) Optimized geometry of CuL2 in methanol at the B3LYP/6-311+G(2d,p)/CPCM level; (B) definition of the dihedral angle of the ligand for the rotational barrier study (left) and geometry associated with the ligand conformation required for the formation of the fac-isomer (right); (C) energy vs. dihedral angles formed by atoms 1, 2, 3 and 4, which are kept fixed during each optimization; and (D) starting geometry for the optimization of the fac-isomer (left) and optimized geometry of the fac-isomer at the B3LYP/6-311+G(2d,p)/CPCM level (right). | ||

To further support the prohibiting of mer- to fac-isomer conversion, an optimization was carried out based on the geometry of the fac-isomer shown in Fig. 1D-left. The optimized structure so obtained is reported in Fig. 1D-right. As shown, it exhibits a tetrahedral coordination, which is markedly different from the initial octahedral geometry, confirming that the formation of the fac-isomer would be energetically unfavorable. Finally, experimental UV-vis spectra of the mer-isomer were measured in water (PBS solution used for electrochemical measurements) and methanol. They were then compared with TD-DFT calculated spectra and are in good agreement (Fig. S5†). Notably, a bathochromic shift is observed in methanol, and the trend in the absorption intensities of the two main calculated bands is consistent with that of the experimental results. These altogether prove that the solid state structural representation of the complex is retained in the solution in the mer-configuration.
3.2. Crystallographic analysis
A description of an anisotropic displacement ellipsoid of the cationic complex is shown in Fig. 2a, while some relevant geometrical characteristics are presented in Table S1.†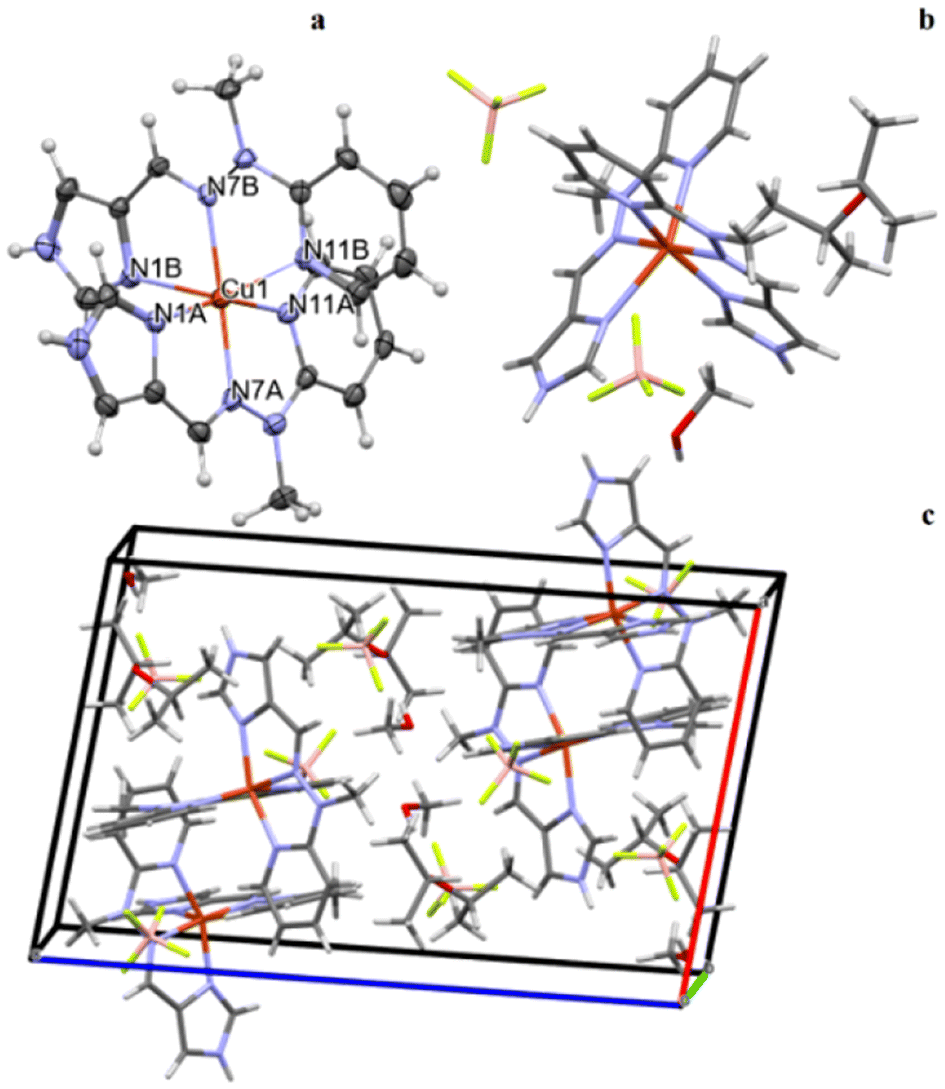 | ||
| Fig. 2 (a) Cation complex anisotropic ellipsoid representation. (b) Crystal structure of the CuL2 complex including the cationic part of the compound and the two BF4 counterions, along with the solvent molecules, methanol and diisopropyl ether. (c) An example of the crystal packing of a structure of the CuL2 complex. | ||
The Cu2+ ion in the cationic complex is coordinated in a distorted octahedral arrangement by six nitrogen donor atoms from two molecules of ligands (three from each). Interestingly there seems to be a difference in the interactions between the metal cation and the ligands as the Cu–N bonds are much shorter for one of the ligands (A, cf. Table 2). The ligand molecules are in a good approximation plane, and they are almost perpendicular in the complex; the dihedral angle between the mean planes of the ligand molecules is equal to 86.75°.
| Distances (Å) | Angles (°) |
|---|---|
| Cu1–N1A | 2.016(4) |
| Cu1–N1B | 2.402(4) |
| Cu1–N7A | 1.999(4) |
| Cu1–N7B | 2.049(4) |
| Cu1–N11A | 2.019(4) |
| Cu1–N11B | 2.246(4) |
| N1A–Cu1–N11A | 158.36(15) |
| N1B–Cu1–N11B | 149.22(13) |
| N7A–Cu1–N7B | 175.95(15) |
In the crystal structure, besides the two BF4− counteranions, there are also solvent molecules of methanol and diisopropyl ether (Fig. 2b). The crystal structure is an effect of different interactions, from the electrostatic interaction between the charged species through stronger N–H⋯F and weaker C–H⋯F hydrogen-bond-like interactions to really weak but ubiquitous van der Waals interactions.
3.3. Electrochemistry of obtained copper(II) complex on Au electrode and its characterization
Cyclic voltammogram (CV) of the bare Au electrode recorded in PBS (0.06 M, pH 7.0) as a supporting electrolyte solution (SES) in the potential range of E = −0.8–1.15 V vs. SCE at dE/dt = 0.1 V s−1 is presented in Fig. 3a. A well-defined pair of reversible peaks located at 0.83 V and 0.48 V vs. SCE is responsible for the gold oxide formation and for its reduction, respectively. In a wide range of potentials (E = −0.8 V to E = 0.6 V relative to the SCE) no electrochemical reactions take place on the Au electrode surface. Further electrochemical measurements can be analyzed in this potential window. | ||
| Fig. 3 (a) CV of the bare Au electrode in PBS at dE/dt = 0.1 V s−1. (b) CVs of the bare gold electrode in PBS (blue) and in PBS with 0.01 mM ligand L (orange), and the cyclic voltammogram of the gold electrode after modification with 0.01 mM CuL2 complex (green), dE/dt = 0.1 V s−1. Inset: approximation of an excerpt of CV (black dashed line). | ||
The CV of the Au electrode after its modification in a 0.01 mM solution of the CuL2 complex in the range of potential from E = −0.8 to −1.15 V vs. SCE at dE/dt = 0.1 V s−1 is presented in Fig. 3b. For comparison CVs of the bare Au electrode in PBS and in the sight of ligand L are shown too. As can be seen from the obtained cyclic voltammetry, the prepared ligand L is inactive on the Au electrode, and its addition to the SES does not change the shape of the CV. Alterations in the i–E course were noted after modification of the Au surface. For the prepared modified Cu/Au electrode a well-defined anodic peak at 0.25 V vs. SCE and cathodic peak at 0.18 V vs. SCE is visible.
This pair of oxidation/reduction peaks according to the literature data42–44 was assigned to Cu(I)/Cu(II) oxidation and Cu(II)/Cu(I) reduction, respectively.
The electrochemical activity of these processes was studied at various scan rates ranging from 0.02 to 0.50 V s−1 (Fig. 4a).
 | ||
| Fig. 4 (a) Cu/Au electrode CVs recorded in PBS at a scan rate of 0.02 to 0.50 V s−1. (b) The relationship between logip and logv. Inset: the relationship ip–v. | ||
The dependence of logip on logv was linear with a slope of dlogip/dlogv close to 1. On this basis, it was concluded that the CuL2 complex used adsorbs on the Au surface during the modification procedure. The linear correlation ipversus v defined by the linear equation ip [mA] = 0.2 v [V s−1] + 0.0006 with a high correlation coefficient value (R2 = 0.9979) confirmed the conclusion that the CuL2 complex is adsorbed on the surface of the gold electrode (Fig. 4b).
SAMs attached to the gold surface can facilitate the oxidation/reduction processes that occur at the interface between the electrode and the solution, but most importantly, effectively protect the metal surface from the adsorption of intermediate and/or final reaction products poisonous to the electrode surface.45–48 Importantly, there are no thiol groups in the structure of the SAM monolayer-forming complex compound we obtained, which, despite their copious and well-known drawbacks such as susceptibility to pH changes, oxidants and organic solvents,49 are widely used in gold surface alteration due to the ease of S–Au binding. In addition, the CuL2 complex is characterized by the simplicity of the system, being monometallic and facile to synthesize, which further enables our system to make the Au surface modification and selective detection of epinephrine even more attractive. The formation of SAM with CuL2 on the gold surface has been verified by considering the crystal structure of the complex discussed in more detail in the crystallographic part. The surface of the gold electrode has a good affinity for nitrogen when nitrogen is present in the form of both the NH groups and the N-heterocycles.50,51 In the complex we describe, nitrogen is present in both of these forms, which further improves its candidacy for SAM formation. The self-assembly of each molecule of CuL2 on the gold surface is achieved by forming covalent bonds between N atoms of two amino groups, which have previously undergone hydrogen oxidative abstraction, and the surface Au atoms. A proposed scheme for associating the CuL2 complex with the gold surface is shown in Fig. 5.
 | ||
| Fig. 5 A representative schematic presenting the bonding between nitrogen atoms from the complex CuL2 structure and gold atoms from the electrode surface. | ||
The adsorption of the CuL2 complex and the generation of a monolayer on the gold template were also proved by scanning electron microscopy (SEM) with energy dispersive X-ray analysis (EDAX). The examined morphology and chemical composition of the surface allowed for the comparison of the unmodified and modified gold electrodes, at the same time confirming the formation of a monolayer of a CuL2 complex on the gold electrode surface (Fig. 6). The surface of the bare gold electrode features a uniform arrangement (Fig. 6a), while the Cu/Au electrode surface represents a regular surface material formed by self-assembling and adsorbing the complex on its surface (Fig. 6b). It can be clearly seen that the surface of the bare gold electrode is smooth and devoid of any irregularities (Fig. 6a), while the surface of the modified Cu/Au electrode shows a regular arrangement of adsorbed material resulting from adsorption and self-organization of the complex on the surface (Fig. 6b). An additional EDAX analysis performed for the unmodified electrode (Fig. S6a†) and for the Cu/Au electrode (Fig. 6c and d) showed a uniform distribution of the contained chemical elements (Au and Cu), which is further evidence that CuL2 adsorption occurs on the gold electrode surface. The latter further confirms the X-ray energy dispersion spectrum presented at Fig. 6e and S6b.† Subsequently, the change of the gold electrode surface with the CuL2 complex was verified by attenuated total reflection infrared spectroscopy (ATR-IR), where the absence of a band in the 4000–3000 cm−1 range for the Cu/Au electrode is indicative of the disappearance of the NH groups through nitrogen binding to gold from the electrode surface (Fig. S7†).
 | ||
| Fig. 6 SEM micrographs showing (a) the unmodified Au electrode and (b) the modified Cu/Au electrode. The EDAX analysis of the Cu/Au electrode (c and d) and its (e) X-ray energy dispersion spectrum. | ||
3.4. Epinephrine electrooxidation at unmodified and modified gold electrodes
In order to determine whether the newly obtained modified Cu/Au electrode fulfils the assumed intended role during EP detection and determination, electrochemical experiments involving this neurotransmitter were carried out first on the unmodified gold electrode and then on the Cu/Au modified gold electrode. According to the literature,52 the oxidation of EP consists of three steps, which are schematically shown in Fig. 7. | ||
| Fig. 7 Scheme of epinephrine electrooxidation. | ||
Fig. 8a shows second scans of the voltammetric responses of the bare Au electrode during EP oxidation, which were recorded for solutions with increasing analyte concentration in PBS, starting at 0.0001 mM EP and ending at 1 mM EP. The assumed mechanism of the EP oxidation is reflected in the shape of the CVs shown in Fig. 8a. It can be seen that the oxidation of EP on the unmodified gold electrode takes place in two potential ranges. A broad irreversible current wave with a maximum at E = 0.36 V vs. SCE, dE/dt = 0.1 V s−1 represents irreversible EP electrooxidation yielding epinephrinequinone, which is known to convert to leucoepinephrinechrome via an intramolecular cyclization reaction (1,4-Michael addition). The latter nonelectrochemical step is possible because of the structure of an epinephrinequinone, which includes both an electron-poor aromatic ring and an electron-rich amine group. Deprotonation of the NH group allows the molecule to perform a 1,4-Michael addition reaction.11 According to the adopted mechanism of EP oxidation, the subsequent pairs of peaks visible on the CVs at about 0.01 V and −0.07 V with a peak-to-peak separation (ΔEp) equal to 80 mV are associated with the third step, i.e. the reversible oxidation of leucoepinephrinechrome to epinephrinechrome. An increase in the concentration of the analytical substance in the bulk of the solution does not influence the course of the cyclic voltammograms.
 | ||
| Fig. 8 (a) Second scans of CVs of the unmodified gold electrode recorded in PBS containing EP at different concentrations ranging from 0.0001 mM to 1 mM at dE/dt = 0.1 V s−1. (b) The set of CVs of the unmodified Au electrode recorded in PBS containing 0.5 mM of EP at scan rates of 0.02 to 0.50 V s−1. (c) The relationship between logip and logv. Inset: the relationship ip–v1/2. | ||
For the unmodified gold electrode in the presence of 0.5 mM EP, one set of CVs was recorded at different scan rates between 0.02 V s−1 and 0.50 V s−1(Fig. 8b). As established, a linear correlation between logip and logv with a concentration limit from 0.02 V s−1 to 0.20 V s−1 was obtained with a dlogip/dlogv slope being equal to 0.49. In addition, the following linear regression equation was obtained: ip [mA] = 0.23 v1/2 + 0.0041 (R2 = 0.9939) (Fig. 8c) by analyzing the experimental data of the linear correlation between ip and v1/2. Therefore, the overall rate of the EP oxidation is controlled by diffusion of substrate molecules towards the gold electrode surface.53
Having the characteristics of epinephrine electrooxidation on the bare Au electrode, the next stage of measurements was undertaken to study the electrooxidation of EP on a gold electrode modified with a prepared CuL2 complex, as shown in Fig. 9. On the Cu/Au electrode the anodic peak corresponding to the oxidation of epinephrine to epinephrinequinone appears at E = 0.23 vs. SCE at dE/dt = 0.1 V s−1, while the couple of peaks corresponding to the reversible oxidation/reduction processes described in the third step of the electrooxidation mechanism adopted above for the analyte under consideration are visible at E = −0.18 V and E = −0.24 V (ΔEp = 60 mV), respectively. On the prepared modified Cu/Au electrode, as on the bare Au electrode, an increase in the EP concentration in the supporting electrolyte solution does not change the shape of the CVs. It is conspicuous from Fig. 9a that an exceptional catalytic effect on the EP electrooxidation is achieved for the Au electrode modified with the SAM of CuL2. This manifests itself as a significant shift of the corresponding voltammetric peaks to the negative direction, accompanied by an increase in the current responses compared to the characteristics of the unmodified electrode (Fig. 8a). It is important to emphasize that the potential range at which the peak involving the electrooxidation of epinephrine to epinephrinequinone is seen on the CV overlaps with that of the oxidation/reduction potential of the CuL2 complex (Fig. 3b), whilst the current response of epinephrine is about seven times higher. This observation provides strong evidence that the epinephrine voltammetric response is catalyzed by the CuL2 complex, which modifies the surface of the gold electrode. It should be noted that similar patterns were found during the electrooxidation of dopamine on an Au electrode coated with the Cu complex [Cu4(L–H)4(BF4)2(CH3OH)2](BF4)2, which was prepared by us earlier.42
 | ||
| Fig. 9 (a) Second scans of CVs of the Cu/Au electrode recorded in PBS including EP concentrations from 0.0001 mM to 1 mM of EP at dE/dt = 0.1 V s−1. (b) The set of CVs of the Cu/Au electrode recorded in PBS in the presence of 0.5 mM of EP at scan rates of 0.02 to 0.50 V s−1. (c) The relationship between ip and v1/2. Inset: the relationship logip–logv. | ||
The effect of composition of the electrode on the rate of this process is shown in Fig. 9b and c. Replacement of the gold electrode with the Cu/Au modified electrode did not affect the linear correlation between the peak current associated with EP (0.5 mM) oxidation and the square root of the scan rate (v1/2) in the range from v = 0.02 V s−1 to v = 0.50 V s−1 (Fig. 9c) and is described by the following equation: ip [mA] = 0.35 v1/2 + 0.002 (R2 = 0.9981). Furthermore, throughout the entire range of scan rates, a linear relationship between logip and logv was established and revealed a slope of dlogip/dlogv, which was equal to 0.51. In line with this, the overall rate of oxidation of epinephrine at the peak maximum potential under the above experimental conditions is controlled by the process of diffusion, which is slower than both the adsorption of the EP and the subsequent charge transfer at the interface between the electrode and the solution. At this point, it is worth emphasizing that the diffusion-controlled electrode process is beneficial for the quantitative determination of the concentration of an analyte in electrolyte solutions.54
Moreover, it was observed that the anodic current peaks assigned to EP electrooxidation at the Cu/Au electrode are shifted towards lower electrode potentials as the concentration of proton ions in the electrolyte solution decreases (Fig. S8).† Analysis of the experimental data revealed that the potential of the peak maximum (Ep) decreased in a linear manner with increasing pH over the range from 3 to 11 and shift can be expressed by the equation of linear regression: Ep = −0.0596 pH + 0.6428. The resulting slope d Ep/d pH close to the theoretical Nernstian value of 0.059 V implies that an equal number of electrons and protons are exchanged during the oxidation of EP at the Cu/Au electrode.53 This is in agreement with the theory of electrochemical kinetics,53 and confirms the above assumed mechanism of EP electrooxidation.
Moreover, as shown in Fig. S8,† the current peak of epinephrine oxidation increases up to a pH of approximately 7–8, at which point a decrease in the recorded voltammetric responses is seen. This observation may be related to the fact that the epinephrine molecule has two active sites: one is an aromatic ring with two hydroxyl groups, and the other is a secondary amine group. According to the literature,55 at pH lower than 5.8 the NH group can undergo protonation, forming a HEp+ cation. At pH higher than 9.0, deprotonation of the hydroxyl group can result in problems to effectively accumulate at the surface of the electrode, hence a decrease in the current density. The latter observation together with considering the future practical application of the Cu/Au electrode as sensors in physiological systems was the reason why pH 7 was selected in all our further studies presented below.
3.5. Epinephrine electrochemical determination
Both the decrease in oxidation potential and the increase in the current intensity found during the EP oxidation at the Cu/Au electrode undoubtedly make the prepared modified electrode suitable for analytical applications. The differential pulse voltammetry (DPV) technique was used to determine the analytical sensitivity of the Cu/Au electrode for the quantitative determination of EP. The analyte concentration was varied in a range of 0.0001 mM to 1.375 mM. The DPVs recorded at the Cu/Au electrode for selected concentrations of EP from the above range are shown in Fig. 10a. | ||
| Fig. 10 (a) The DPVs recorded at the modified Cu/Au electrode with the addition of different EP concentrations in PBS at dE/dt = 0.1 V s−1. (b) The correlation ipvs. c in the EP concentration range from 0.0001 to 1.375 mM. Inset: ipvs. c in the narrow concentration range of the EP (0.0001–0.075 mM). | ||
The recorded DPVs demonstrate a clear correlation between the increasing EP concentration in the SES and the increasing current intensity. As can be seen from Fig. 10b, the relationship between the current peak ip, which corresponds to the electrooxidation of EP (cEP), and its concentration is within the concentration interval between 0.0001 mM and 0.875 mM, and the resulting linear regression equation is as follows: ip [mA] = 0.20 cEP [mM] + 0.01 (R2 = 0.9988). At a higher concentration of EP outside the linear relationship, the value of the current response decreases, which may indicate that above the concentration of 1 mM, EP begins to accumulate on the altered surface of the gold electrode.56 The limit of detection (LOD) and the limit of quantification (LOQ), calculated from the following IUPAC recommended formulas: LOD = 3 Sb/S and LOQ = 10 Sb/S (where Sb is the standard deviation of the current in the SES evaluated on the basis of 10 times repeated DPV measurements, S is the slope of the linear ipvs. c dependence),57 were 0.03 μM and 0.1 μM, respectively. Table 3 compares the value of LOD and that of the linearity range of EP quantification obtained with the modified Cu/Au electrode prepared in the present with analogue parameters obtained from other electrodes published in the literature. This comparison led to the conclusion that the Cu/Au electrode could undoubtedly be a successful sensor for the electrochemical determination of EP in real samples.
| Type of electrode | Range of linearity [μM] | LOD [μM] | Ref. |
|---|---|---|---|
| TMBH: 2-hydroxy-N′1-[(E)-1-(3-methyl-2-thienyl)methylidene]benzohydrazide; OMC–NiO: ordered mesoporous carbon/nickel oxide; MO/Pc/MWCNT: metal oxide (MO = Fe3O4, ZnO) nanoparticles, doped phthalocyanine (Pc) and functionalized MWCNTs; La: LAPONITE®. | |||
| Au electrode modified with a Cu(II) complex | 0.1–875 | 0.03 | This work |
| Au electrode modified with an Fe(III) complex | 0.01–900 | 0.0074 | 4 |
| Au electrode modified with TMBH | 1.7–24.9; 24.9–91.7 | 0.19 | 27 |
| SPE modified with a Cu(II) nanocomplex | 10–600 | 2.5 | 23 |
| CPE modified with Fe(II) phthalocyanine | 1–300 | 0.5 | 6 |
| CPE modified with graphene quantum dots | 0.36–380 | 0.0003 | 14 |
| GCE modified with a SnO2/graphene nanocomposite | 0.5–200 | 0.017 | 58 |
| GCE modified with an OMC–NiO nanocomposite | 0.8–50 | 0.085 | 59 |
| GCE modified with a MO/Pc/MWCNT composite | 20–48 | 12.3 | 60 |
| IPGE modified with a thin layer of a La clay mineral | 0.8–10 | 0.26 | 3 |
For the determination of EP in a commercial epinephrine injection solution, the practical application of the Cu/Au sensor was tested using the calibration method61 and the DPV technique. To do this, the contents of each pre-filled syringe with the test solution (concentration 300 mcg per 0.3 ml) were diluted to 10 ml, and then spiked with a known amount of 0, 0.01, 0.02, 0.05, 0.1 and 0.15 mM EP standard solution. Three repeated measurements were made for each solution studied. The averaged results of the analytical test determinations, together with the recovery and relative standard deviation (RSD), are summarized in Table 4. As can be seen, in each of the test samples, the amounts of the substances are very close to their nominal content. The feasibility of the developed Cu/Au sensor for EP determination in commercial samples is confirmed by recoveries ranging from 98.6 to 101.7% and the low RSD values from 1.8 to 2.7%, indicating the satisfactory accuracy of the proposed method.
| Initial amount [mM] | Spiked amount [mM] | Found amount [mM] | Recovery [%] | RSD [%] |
|---|---|---|---|---|
| 0.164 | 0 | 0.165 | 100.6 | 2.1 |
| 0.164 | 0.01 | 0.177 | 101.7 | 1.8 |
| 0.164 | 0.02 | 0.183 | 99.5 | 2.3 |
| 0.164 | 0.05 | 0.211 | 98.6 | 1.8 |
| 0.164 | 0.1 | 0.267 | 101.1 | 2.4 |
| 0.164 | 0.15 | 0.312 | 99.4 | 2.7 |
3.6. Study of interferences
As underlined in the Introduction section and as shown in Fig. 11a, accurate sensing of EP on the unmodified gold electrode is virtually impossible in physiological samples containing some interferents such as UA because of the overlap of the cyclic voltammetric responses of these compounds. This problem is eliminated when the Cu/Au electrode developed in this work was used to analyze a binary mixture containing EP and UA. | ||
| Fig. 11 (a) Second scans of the CVs recorded at the unmodified gold electrode in PBS (blue) in the presence of 0.5 mM EP (brown) and 0.5 mM UA (dark green), and second scans of the CVs recorded in PBS at the modified Cu/Au electrode including 0.5 mM EP (orange) and 0.5 mM UA (light green) at dE/dt = 0.1 V s−1. (b) DPVs recorded at the Cu/Au electrode in PBS with 0.5 mM UA and increasing EP concentrations (from 0.0001 mM to 0.5 mM) at dE/dt = 0.1 V s−1. Inset: the relationship ip–cEP. (c) DPVs recorded at the Cu/Au electrode in PBS with 0.5 mM EP and increasing UA concentrations (from 0.5 mM to 5 mM) at dE/dt = 0.1 V s−1. Inset: the relationship ip–cUA. | ||
It is evident from the CVs in Fig. 11a that the current density at the peak maximum potential is higher for both EP and UA oxidation on the Cu/Au electrode. Simultaneously, the current peaks corresponding to the oxidation of these compounds are noticeably separated from each other after using the Au electrode modified with the CuL2 complex. It should be distinguished that the peak potential separation between EP and UA is greater for the Cu/Au electrode (ΔEp = 220 mV) than for the bare Au electrode (ΔEp = 20 mV). The negative shift corresponding to the EP oxidation peak and the positive shift occurring during the UA oxidation recorded on the Cu/Au electrode can be attributed to CuL2 complex chemisorption on the gold surface leading to SAM formation. The monolayer formed is characterized by the presence of free electron pairs located on two nitrogen atoms of each molecule of the CuL2 complex (Fig. 5), the presence of which results in an excess of negative charge, thus causing electrostatic repulsion and attraction. Owing to electrostatic repulsion of anionic forms, most UA anions are excluded from the Cu/Au electrode, which results in a shift of the peak potential of UA in the direction of the higher overpotential. Concomitantly, the attraction of the cationic form of epinephrine by the electrostatic interaction between them and the Cu/Au electrode results in a reduction of the EP oxidation overpotential. Thus, this electrode appears to be advantageous for the selective EP sensing and analytical determination in the presence of UA and vice versa.
Information on the detection sensitivity of the Cu/Au electrode for the EP and UA determination in the presence of each other was obtained from DPV experiments in which the concentration of one compound was diverse while that of the other was kept constant (Fig. 11b and 10c). Analysis of the DPVs for the Cu/Au electrode showed that the current intensity (ip) corresponding to the electrooxidation of EP in the presence of a constant amount (0.5 mM) was proportional to the reactant concentration (cEP) over the range from 0.0001 mM to 0.5 mM (see inset in Fig. 11b) and was described by the following equation: ip [mA] = 0.20 cEP [mM] + 0.01 (R2 = 0.9988). It should be noted that the calculated LOD and LOQ values are the same as those calculated for EP without the presence of UA in the bulk solution (see above). Undoubtedly, this modified electrode is suitable for the accurate determination of the EP concentration without UA interference. Furthermore, when UA was analyzed quantitatively in the presence of a fixed amount of EP in solution, the linear ip–cUA relationship was found to be satisfied over the analyte concentration interval from 0.5 mM to 5.0 mM and is described by the equation: ip [mA] = 0.015 cUA [mM] + 0.13 (R2 = 0.9988). In this case, the LOD and LOQ values are 40 μM and 133 μM, respectively.
A further experiment was carried out on the practicality of the Cu/Au electrode for EP determination in the presence of UA, for which the calibration method was used. Each measurement was repeated three times and the results are presented in Table S2† as in the EP alone experiment. As expected, the concentrations of both components of the studied binary mixture in each sample are very close to their nominal content. For an accurate determination of the EP concentration without interference from UA and vice versa, there is no doubt that this modified Cu/Au electrode is adequate.
To ensure that the presence of additional interfering compounds did not affect the quantification of epinephrine using a Cu/Au electrode, a further experiment was carried out. The samples to be tested were prepared by adding 5 mM of the following salts: Na+, K+, Ca2+, NH4+, Mg2+, SO42−, and C2O42− to 0.5 mM EP solution in 5 mM PBS. The results presented in Table S3† show that the addition of the above disturbances did not alter the DPV voltammetric signal coming from the EP and did not influence the quality of the quantitative analysis.
Considering the above results, it can be concluded that the prepared Cu/Au electrode can be used with great success for the analytical purposes that are intended in this work.
3.7. Reproducibility and stability of the modified gold electrode
Reproducibility tests determined that the RDS values of five measurements performed on the new Cu/Au modified electrode in separate PBS solutions containing 0.5 mM EP were below 2.7%, suggesting high reproducibility of the obtained sensor (Fig. S9a†).The stability of the modified gold electrode was investigated four times over a period of 24 days in PBS with 0.5 mM EP. Prior to each of the following measurements, the electrode was washed with water only and dried in a stream of argon. Over a period of more than 3 weeks, the voltammetric responses for the tested system decreased by approximately 3.5% from the initial measurement (Fig. S9b†).
4. Conclusions
The present results indicate that the newly synthesized and characterized CuL2 complex [CuL2](BF4)2 forms a self-assembled monolayer on the gold electrode surface by the chemisorption process. The oxidation kinetics of epinephrine, a biologically important molecule, on the modified Cu/Au electrode surface was improved compared to the electrochemical activity of EP on the bare Au electrode. The measurements showed that the modified Cu/Au electrode is a promising electrochemical sensor for the detection of EP under aqueous conditions with good selectivity, long-term stability and reproducibility. The EP quantification method thus developed features simplicity and low cost, while the obtained linear relationship between ip and c of EP in the range of 0.0001 mM to 0.875 mM is comparable to or broader than that described in the literature using other modified electrodes. Furthermore, the Cu/Au electrode is capable of detecting EP in the presence of biogenic interferents, such as UA. These findings pave the way for further studies of Schiff-base Cu(II) complex compounds that can accumulate on a gold template and their application as sensors for the sensing of neurotransmitters in the presence of interfering substances.Author contributions
Daria Nowicka: investigation, data curation, formal analysis, visualization, project administration, writing – review & editing, and funding acquisition. Karol Garbaczewski: investigation, data curation and formal analysis. Teresa Łuczak: investigation, data curation, conceptualization, methodology, formal analysis, resources, visualization, writing – review & editing, and project administration. Giuseppe Forte: data curation, formal analysis, visualization, and writing – review & editing. Giuseppe Consiglio: data curation, formal analysis, visualization, and writing – review & editing. Maciej Kubicki: investigation, data curation, formal analysis, writing – review & editing, and visualization. Violetta Patroniak: supervision, visualization, resources, and writing – review & editing. Adam Gorczyński: supervision, conceptualization, writing – review & editing, project administration, resources, and funding acquisition.Data availability
The data supporting this article have been included as part of the ESI† and are available in the public open repository Zenodo at https://zenodo.org/uploads/14045170; 10.5281/zenodo.14045170.Conflicts of interest
There are no conflicts to declare.Acknowledgements
This work was supported by the National Science Centre, Poland (grant numbers UMO-2022/45/N/ST4/00632, UMO-2022/47/B/ST4/02310, and UMO-2020/39/D/ST4/01182). Daria Nowicka is a scholarship holder of the Adam Mickiewicz University in Poznan Foundation for the academic year 2023/2024. Adam Gorczyński is a scholarship holder of the Polish Ministry of Education and Science for outstanding young scientists. We would like to thank Dr Aleksandra Bocian for her help in ligand and complex synthesis.References
- K. E. Barrett, S. Boitano, S. M. Barman, W. F. Ganong and H. L. Brooks, Ganong's Review of Medical Physiology, McGraw-Hill Medical, 2012 Search PubMed.
- M. Müller, Clinical pharmacology: current topics and case studies, Springer, 2010 Search PubMed.
- C. N. Pecheu, V. K. Tchieda, K. Y. Tajeu, S. L. Jiokeng, A. Lesch, I. K. Tonle, E. Ngameni and C. Janiak, Molecules, 2023, 28, 5487 CrossRef CAS.
- A. Gorczyński, M. Kubicki, K. Szymkowiak, T. Łuczak and V. Patroniak, RSC Adv., 2016, 6, 101888–101899 RSC.
- E. Honarmand and M. H. Motaghedifard, Anal. Methods, 2015, 7, 4995–5005 RSC.
- S. Shahrokhian, M. Ghalkhani and M. K. Amini, Sens. Actuators, B, 2009, 137, 669–675 CrossRef CAS.
- A. Bhattacharya, K. B. Patel, R. Ghosh, D. N. Srivastava and P. B. Chatterjee, Sens. Actuators, B, 2024, 398, 134772 CrossRef CAS.
- M. V. Gorbunova, S. V. Gutorova, D. A. Berseneva, V. V. Apyari, V. D. Zaitsev, S. G. Dmitrienko and Y. A. Zolotov, Appl. Spectrosc. Rev., 2019, 54, 631–652 CrossRef CAS.
- J. Bicker, A. Fortuna, G. Alves and A. Falcão, Anal. Chim. Acta, 2013, 768, 12–34 CrossRef CAS PubMed.
- A. Moslehipour, J. Chem. Rev., 2020, 2, 130–147 CAS.
- M. D. Hawley, S. V. Tatawawadi, S. Piekarski and R. N. Adams, J. Am. Chem. Soc., 1967, 89, 447–450 CrossRef CAS.
- Z. Fredj and M. Sawan, Biosensors, 2023, 13, 211 CrossRef CAS.
- B. Soleymani, B. Zargar and S. Rastegarzadeh, J. Iran. Chem. Soc., 2020, 17, 1013–1025 CrossRef CAS.
- J. Tashkhourian, S. F. Nami-Ana and M. Shamsipur, J. Mol. Liq., 2018, 266, 548–556 CrossRef CAS.
- G. Pallam, S. Sam, S. Sreekumar and K. G. Kumar, Ionics, 2023, 29, 819–831 CrossRef CAS.
- M. Mazloum-Ardakani, F. Alvansaz-Yazdi, F. Hoseynidokht and A. Khoshroo, Anal. Bioanal. Chem. Res., 2023, 10, 387–394 CAS.
- G.-P. Jin, Q.-Z. Chen, Y.-F. Ding and J.-B. He, Electrochim. Acta, 2007, 52, 2535–2541 CrossRef CAS.
- B. O. Agboola and K. I. Ozoemena, Phys. Chem. Chem. Phys., 2008, 10, 2399–2408 RSC.
- Z. Yang, G. Hu, X. Chen, J. Zhao and G. Zhao, Colloids Surf., B, 2007, 54, 230–235 CrossRef CAS.
- B. Jin and H. Zhang, Anal. Lett., 2002, 35, 1907–1918 CrossRef CAS.
- S. Agrahari, A. K. Singh, R. K. Gautam and I. Tiwari, Environ. Sci. Pollut. Res., 2023, 30, 124866–124883 CrossRef CAS.
- H. Beitollahi, Z. Dourandish, S. Tajik, M. R. Ganjali, P. Norouzi and F. Faridbod, J. Rare Earths, 2018, 36, 750–757 CrossRef CAS.
- F. Soofiabadi, A. Amiri and S. Jahani, Anal. Bioanal. Electrochem., 2017, 9, 340–350 CAS.
- T. Joseph, T. Thomas and N. Thomas, Electroanalysis, 2020, 32, 2463–2473 CrossRef CAS.
- O. Gunes, A. Sarilmaz, S. Z. Bas, M. Ozmen, F. Ozel and M. Ersoz, Electroanalysis, 2021, 33, 2460–2468 CrossRef CAS.
- N. F. Atta, A. Galal and E. H. El-Ads, Analyst, 2012, 137, 2658–2668 RSC.
- M. Zohreh, S. M. Ghoreishi, M. Behpour and M. Mohammadhassan, Arabian J. Chem., 2017, 10, S657–S664 CrossRef CAS.
- S. Ramirez, N. Silva, M. P. Oyarzun, J. Pavez and J. F. Silva, J. Electroanal. Chem., 2017, 799, 349–357 CrossRef CAS.
- M. Mazloum-Ardakani, H. Beitollahi, M. K. Amini, B.-F. Mirjalili and F. Mirkhalaf, J. Electroanal. Chem., 2011, 651, 243–249 CrossRef CAS.
- K. Barman and S. Jasimuddin, RSC Adv., 2016, 6, 99983–99988 RSC.
- E. Wierzbicka and G. D. Sulka, Sens. Actuators, B, 2016, 222, 270–279 CrossRef CAS.
- A. Bocian, M. Szymańska, D. Brykczyńska, M. Kubicki, M. Wałęsa-Chorab, G. N. Roviello, M. A. Fik-Jaskółka, A. Gorczyński and V. Patroniak, Molecules, 2019, 24, 3173 CrossRef CAS.
- O. Rigaku, CrysAlis PRO, Rigaku Oxford Diffraction, Yarnton, England, 2015 Search PubMed.
- G. M. Sheldrick, Acta Crystallogr., Sect. A:Found. Adv., 2015, 71, 3–8 CrossRef PubMed.
- G. M. Sheldrick, Acta Crystallogr., Sect. C: Struct. Chem., 2015, 71, 3–8 Search PubMed.
- T. Łuczak, J. Appl. Electrochem., 2007, 37, 461–466 CrossRef.
- M. J. Frisch, G. W. Trucks, H. B. Schlegel, G. E. Scuseria, M. A. Robb, J. R. Cheeseman, G. Scalmani, V. Barone, G. A. Petersson, H. Nakatsuji, X. Li, M. Caricato, A. V. Marenich, J. Bloino, B. G. Janesko, R. Gomperts, B. Mennucci, H. P. Hratchian, J. V. Ortiz, A. F. Izmaylov, J. L. Sonnenberg, D. Williams-Young, F. Ding, F. Lipparini, F. Egidi, J. Goings, B. Peng, A. Petrone, T. Henderson, D. Ranasinghe, V. G. Zakrzewski, J. Gao, N. Rega, G. Zheng, W. Liang, M. Hada, M. Ehara, K. Toyota, R. Fukuda, J. Hasegawa, M. Ishida, T. Nakajima, Y. Honda, O. Kitao, H. Nakai, T. Vreven, K. Throssell, J. A. Montgomery Jr., J. E. Peralta, F. Ogliaro, M. J. Bearpark, J. J. Heyd, E. N. Brothers, K. N. Kudin, V. N. Staroverov, T. A. Keith, R. Kobayashi, J. Normand, K. Raghavachari, A. P. Rendell, J. C. Burant, S. S. Iyengar, J. Tomasi, M. Cossi, J. M. Millam, M. Klene, C. Adamo, R. Cammi, J. W. Ochterski, R. L. Martin, K. Morokuma, O. Farkas, J. B. Foresman and D. J. Fox, Gaussian 16, Rev C.01, Gaussian Inc., Wallingford CT, 2016 Search PubMed.
- T. Yanai, D. P. Tew and N. C. Handy, Chem. Phys. Lett., 2004, 393, 51–57 CrossRef CAS.
- G. Consiglio, A. Gorcyński, S. Petralia and G. Forte, RSC Adv., 2023, 13, 1019–1030 RSC.
- M. Cossi, N. Rega, G. Scalmani and V. Barone, J. Comput. Chem., 2003, 24, 669–681 CrossRef CAS PubMed.
- J. Tomasi, B. Mennucci and R. Cammi, Chem. Rev., 2005, 105, 2999–3094 CrossRef CAS.
- D. Nowicka, M. Kubicki, V. Patroniak, T. Łuczak and A. Gorczyński, Electrochim. Acta, 2024, 476, 143754 CrossRef CAS.
- M. I. Awad and T. Ohsaka, J. Power Sources, 2013, 226, 306–312 CrossRef CAS.
- G. Jiang, X. Gu, G. Jiang, T. Chen, W. Zhan and S. Tian, Sens. Actuators, B, 2015, 209, 122–130 CrossRef CAS.
- M. Singh, N. Kaur and E. Comini, J. Mater. Chem. C, 2020, 8, 3938–3955 RSC.
- M. Ravandeh, D. Thal, H. Kahlert, K. Wende and M. Lalk, J. Solid State Electrochem., 2020, 24, 3003–3011 CrossRef CAS.
- A. Ulman, Chem. Rev., 1996, 96, 1533–1554 CrossRef CAS.
- S. Watcharinyanon, Structure of self-assembled monolayers on gold studied by nexafs and photoelectron spectroscopy, Karlstads Universitet, 2008 Search PubMed.
- G. Kaur, R. L. Thimes, J. P. Camden and D. M. Jenkins, Chem. Commun., 2022, 58, 13188–13197 RSC.
- F. Chen, X. Li, J. Hihath, Z. Huang and N. Tao, J. Am. Chem. Soc., 2006, 128, 15874–15881 CrossRef CAS PubMed.
- S. Radenković, M. Antić, N. D. Savić and B. Đ. Glišić, New J. Chem., 2017, 41, 12407–12415 RSC.
- Y. Yao, R. Shen, J. Xu and Z. Feng, Int. J. Electrochem. Sci., 2024, 19, 100750 CrossRef CAS.
- A. J. Bard, L. R. Faulkner and H. S. White, Electrochemical methods: fundamentals and applications, John Wiley & Sons, 2022 Search PubMed.
- A. Kisza, Electrochemistry II, WNT Warsaw, 2001, p. 94 Search PubMed.
- Z. Kun, C. Hongtao, Y. Yue, B. Zhihong, L. Fangzheng and L. Sanming, Ionics, 2015, 21, 1129–1140 CrossRef.
- T. Łuczak, Electrochim. Acta, 2008, 53, 5725–5731 CrossRef.
- C. Analytical Methods, Analyst, 1987, 112, 199–204 RSC.
- N. Lavanya, E. Fazio, F. Neri, A. Bonavita, S. G. Leonardi, G. Neri and C. Sekar, Sens. Actuators, B, 2015, 221, 1412–1422 CrossRef CAS.
- X. Yang, P. Zhao, Z. Xie, M. Ni, C. Wang, P. Yang, Y. Xie and J. Fei, Talanta, 2021, 233, 122545 CrossRef CAS PubMed.
- N. G. Mphuthi, A. S. Adekunle and E. E. Ebenso, Sci. Rep., 2016, 6, 26938 CrossRef CAS PubMed.
- W. Szczepaniak, Instrumental methods in chemical analysis, PWN Scientific Publishers, Warsaw, 2010 Search PubMed.
Footnote |
| † Electronic supplementary information (ESI) available: Synthesis and analysis of the CuL2 complex, additional characterization of the bare gold electrode and supplementary electrochemical experiments. CCDC 2346925. For ESI and crystallographic data in CIF or other electronic format see DOI: https://doi.org/10.1039/d4dt02702g |
| This journal is © The Royal Society of Chemistry 2025 |