
Strong enhancement of effective refractive index in structured colloids (TiO2@Silica): Localization of light†
Jessica
Dipold
a,
Niklaus U.
Wetter
a,
Francisco C.
Marques
b,
Aristide
Dogariu
 c and
Ernesto
Jiménez-Villar
*bc
c and
Ernesto
Jiménez-Villar
*bc
aInstituto de pesquisas Energéticas e Nucleares, CNEN_IPEN, São Paulo, SP 05508-000, Brazil
bInstituto de Física “Gleb Wataghin”, Universidade Estadual de Campinas, Campinas, SP 13083-859, Brazil. E-mail: Ernesto.jimenez@uv.es
cCREOL, The College of Optics and Photonics, University of Central Florida, Orlando, FL 32816, USA
First published on 11th December 2024
Abstract
We use non-resonant Raman scattering to demonstrate a large enhancement of the effective refractive index experienced by Raman photons in a scattering medium comprising spatially-correlated photonic structures of core–shell TiO2@Silica scatterers mixed with silica nanoparticles and suspended in ethanol. We show that the high refractive index extends outside the physical boundary of the medium, which is attributed to the evanescent contributions of electromagnetic modes that are strongly localized within the medium. Notably, the effective enhancement can be observed even at very low intensities of Raman emission. This anomalous non-linear phenomenon could be explained by the successive polarization of valence electrons to virtual states induced by the strong photon correlations in the strongly localized electromagnetic modes. The enhancement of refractive index and its extension in the vicinity of the medium's interface provide new opportunities for controlling the electromagnetic fields in advanced photonic devices.
Introduction
The enhancement of the light–matter coupling in dielectric-scattering media, in addition to delving into fundamental concepts of physics, can also present advanced applications.1–3 In recent years, dramatic progress in the photonics field in engineered-disordered media has been seen.1,4–7 Engineered or correlated disorder in photonic assemblies can yield anomalous and impactful optical phenomena such as localization of light, enhanced light–matter interaction, unidirectional invisibility and single mode lasing. Several works on these topics have been published elsewhere.1,8–11 In particular, localization of light in a three-dimensional (3D) dielectric system shows prospects for completely new optical phenomena.2,3 However, it has proven elusive,12–16 which has led to extensive debate.17 Absorption, non-linear phenomena and the near field dipole–dipole coupling were claimed to hamper localization of light. In fact, renormalization of the absorption coefficient (enhanced absorption) in a disordered scattering medium at the mobility edge was first predicted theoretically18 and later experimentally shown.19 In our recent works,1,4,5 we showed that the correlation in the scatterers’ position, due to the Coulomb interaction between scatterers, might give rise to strongly localized electromagnetic modes (localization of light) and associated phenomena, such as strong enhancement of the Raman scattering cross section and very low random lasing threshold. The latter have been observed in correlated colloidal structures composed of core–shell TiO2@Silica scatterers suspended in ethanol with or without addition of silica nanoparticles.1,4,5 The silica NPs (20 nm diameter) enhances the particle–particle interaction between the TiO2@Silica NPs (scatterers). These silica NPs should be localized at the intermediate regions between TiO2@Silica NPs, due to their higher mobility and the strong Coulomb repulsion exerted on them by the larger TiO2@Silica NPs (500 nm diameter). In addition, due to the high dielectric permittivity of silica NPs,20 an increase in the solvation layer, effective viscosity and Coulomb potential is expected in the intermediate region between TiO2@Silica NPs,21 favoring the scatterer–scatterer interaction and, therefore, the correlation in their positions. Consequently, silica NPs would act like pivots or bridges for the Coulomb interaction between TiO2@Silica NPs.In this work, through non-resonant Raman scattering, strong enhancement of the effective refractive index experienced by Raman photons at the sample input interface is shown in a TiO2@Silica ethanol suspension with addition of silica NPs, which was suggested1,4,19,22,23 and inferred24,25 in our previous works. This strong enhancement of the effective refractive index experienced by Raman photons represents a new kind of non-linear phenomenon, especially considering the low intensities involved in the Raman emission. In previous works, we showed strong enhancement in the Raman cross section (non-resonant)1,4 and absorption coefficient19,24,25 near the sample input interface. The enhancement of the non-resonant Raman scattering together with an enhanced absorption should also imply an increase in the effective refractive index (nS). It should be noted that according to the Kramers–Kronig relationship, an enhanced absorption should be linked to an enhancement of the refractive index. Additionally, an enhancement of the non-resonant Raman scattering should be a consequence of the increase in the polarization of valence electrons to virtual states, which, in turn, leads to an increase in the refractive index. A parallel of this phenomenon in electronic systems was first addressed by Campagnano and Nazarov, who proposed a dynamic barrier at the border of a disordered electronic medium at localization.26
Materials and methods
Core–shell TiO2@Silica NPs, synthesized by an improved Stöber method,19 were dispersed in ethanol (HPLC) solution with the TiO2 core (rutile) with filling fractions (FFTiO2) of 0.26%, 0.54%, 1.35%, 4.8%, 8.8% and 12.1%. Additionally, silica NPs (20 nm diameter) with filling fractions (FFSiO2) of 0.75% and 1.5% were added to these TiO2@Silica NP suspensions. The TiO2@Silica NPs used in the current experiments are the same as those used in our previous reports.1,4,5,19,22–25 TEM, EELS (electron energy loss spectroscopy) mapping (Si) and energy dispersive X-ray fluorescence (ED-XRF) spectroscopy of the core–shell TiO2@Silica NPs were performed and reported in our previous work.4,19 The mass percentage ratio (Ti/Si), determined by ED-XRF, was Ti72/Si28, which allows estimating a silica shell thickness of ∼40–45 nm. Diffraction patterns from the TiO2@Silica suspensions showing the correlation of the scatterers’ position can be found in our previous works.5,27 Details of the synthesis of TiO2@Silica NPs can be found in the ESI.†A Micro-Raman LabRAMAN HR Horiba Scientific with a CW 532 nm laser as an excitation source (50 mW with power fluctuation ± 1%) was used for Raman scattering measurements. Micro-Raman measurements were done using a Leica 50× objective with the numerical aperture NA = 0.55. A schematic diagram of the Raman measurement can be found in our previous works.1,4 Three arrangements were performed, one without using slides to cover the sample (air) and the other two using either glass (refractive index for BK7 is nGlass = 1.52) or sapphire (nAl2O3 = 1.78) slides to cover the sample. For these air, glass and sapphire (slide) arrangements, the pumping spot sizes were 0.8 μm, 1.2 μm and 1.4 μm, respectively. The latter represents pumping power densities of 10 × 1010 W m−2, 4.4 × 10¹⁰ W m−2 and 3.2 × 10¹⁰ W m−2 for the air, glass and sapphire (slide) arrangements, respectively. For the above three arrangements, the Raman signature of the TiO2 core (rutile, 410 nm mean diameter) was monitored as a function of FFTiO2.
Fig. 1 shows illustrations of Raman pumping and collection corresponding to the three setups used for collecting the Raman signal and studying the enhancement of the effective refractive index at the sample–slide interface with air, glass and sapphire as cover slides (from left to right). For pumping and collection of the Raman signal, θCAir, θCGlass, θCAl2O3 cone angles and the depth of focus (dB(M)) are only determined by the classical refractive indexes of slides, nCM (nCAir, nCGlass, nCAl2O3) and the numerical aperture (NA) of the pumping-collection objective, NA = 0.55. The pumping-collection depth (dB(M)) is calculated through  , where λ = 532 nm is the pumping wavelength, nCM is the refractive index of the slide and NA = 0.55 is the numerical aperture of the objective. More details about the Raman measurements can be found in the ESI.†
 | ||
| Fig. 1 Illustrations of Raman pumping and collection using the 50× objective and air, glass and sapphire (Al2O3) slides (from left to right). The green and orange arrows represent the pumping and Raman emission, respectively. An enhancement in the effective refractive index of the sample leads to a decrease in the Raman cone angle (θSAir, θSGlass, θSAl2O3) collected by each detection system (air, glass and sapphire). θCSAir, θCSGlass and θCSAl2O3 are the classical Raman cone angles of pumping by each setup and would also be the collected angle if the effective refractive index of the sample was not enhanced. θCAir, θCGlass and θCAl2O3 are the angles of the entry and collection cone (Raman) at the air–sample or air–slide interfaces, which determine the pump and collection depth into the sample (dB). These angles are insensitive to the dynamics of the refractive indexes of the sample and the slide at the sample–slide interface. | ||
Results
An enhancement in the effective refractive index of the sample (nS) at the sample–slide interface, experienced by Raman photons, should induce a reduction of the cone angle of the Raman signal collected from the sample (θSAir, θSGlass, θSAl2O3; Fig. 1), due to light refraction at the sample–slide or sample–air interfaces. In turn, an increase of the internal reflection is also expected at these interfaces, which would reduce the Raman signal collected. This nS (sample) enhancement at the sample–slide interface could be extended to the refractive index of slides (sapphire and glass), due to the interaction with the evanescent wave coming from the electromagnetic modes strongly localized in the sample near the input interface (sample–slide). For the measurement without a slide (air), the enhancement of refractive index of air at the sample–air interface through the interaction with the evanescent wave would not be noticeable, since the electric susceptibility of air (χeAir) is close to zero, so the enhanced χeAir value would also be close to zero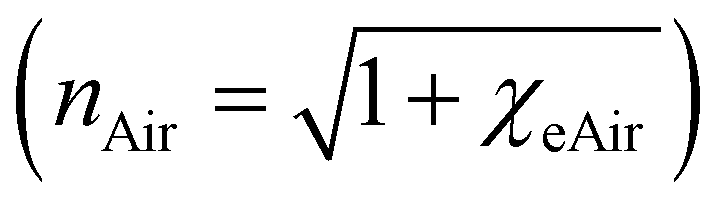 . Therefore, an nS enhancement for the measurement without a slide (air) should result in a lower collected Raman signal than expected without nS enhancement, since an enhanced nS would lead to an increase in the nS/nAir contrast at the sample–air interface, inducing a reduction in the Raman collection angle by refraction and an increase in the internal reflection. Following the above arguments, we could demonstrate an increase of the effective refractive index of the sample (nS) experienced by Raman photons at the sample–slide interface for FFTiO2 > 0.26%.
The Raman signal, measured experimentally (IExp) for each arrangement (air and slides), is plotted as a function of FFTiO2 for both FFSiO2 (Fig. 2a and b). As shown for the three arrangements, the Raman signal increases quicker than linearly as the FFTiO2 is increased. The solid red, black and blue lines represent the expected linear behavior of the Raman signal in FFTiO2 for the air, glass and sapphire arrangements, respectively.
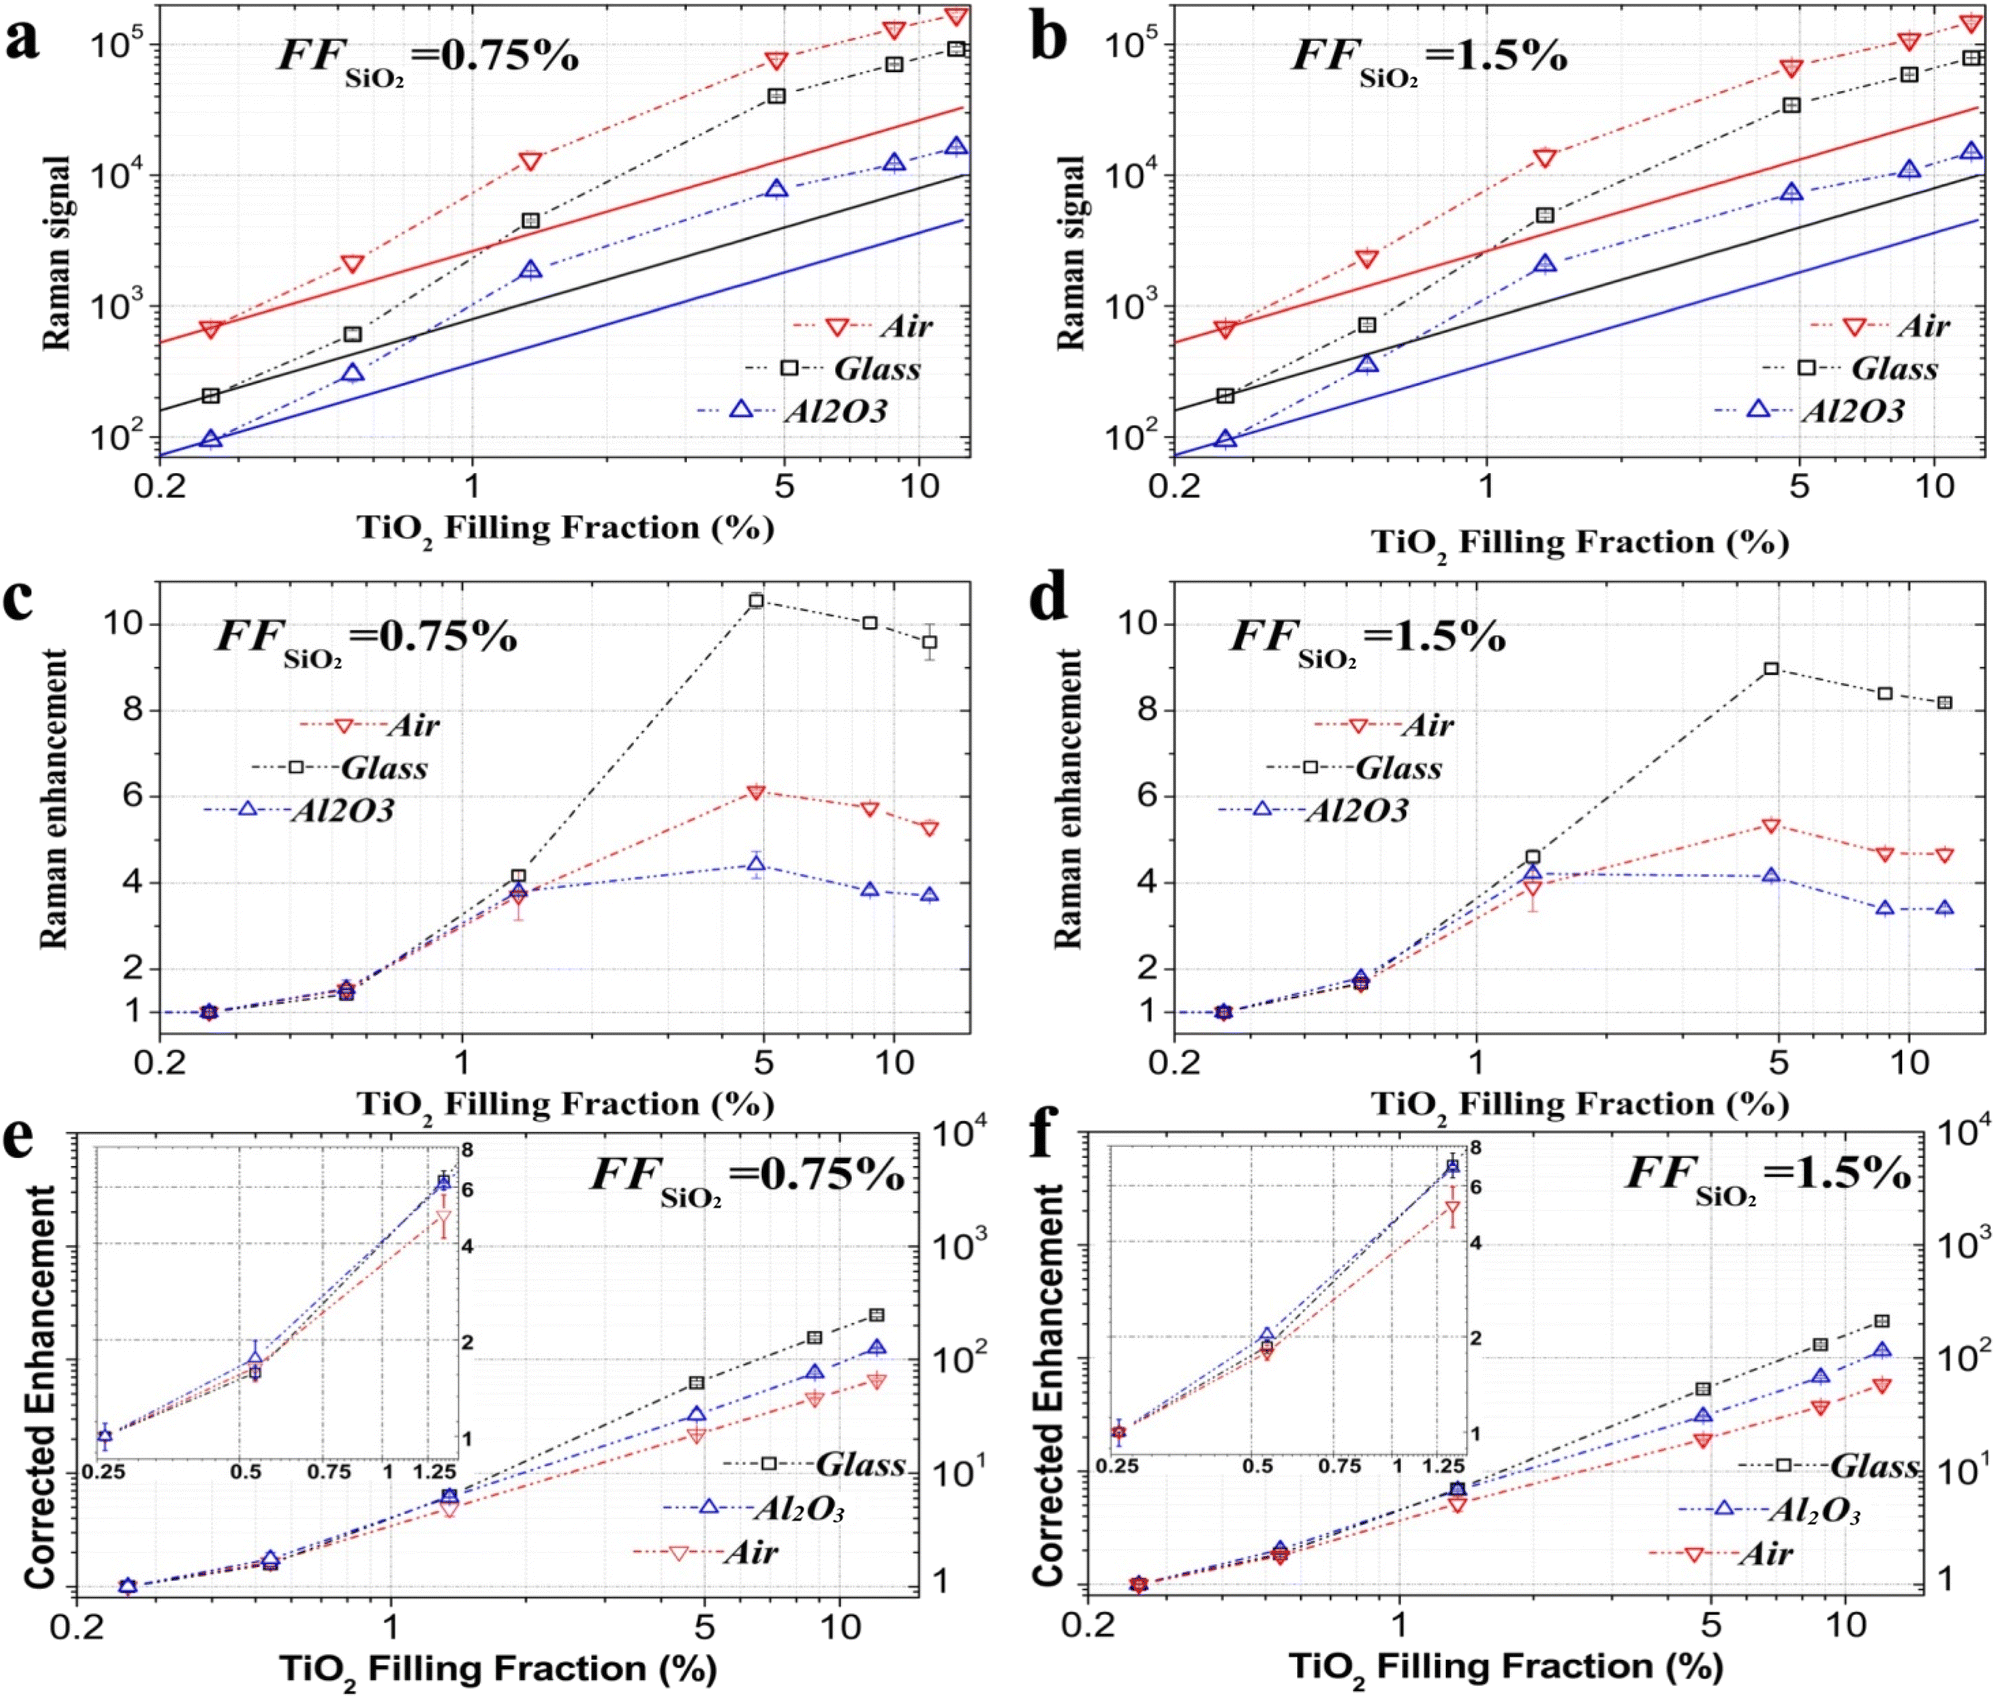 | ||
| Fig. 2 Comparison of the Raman signal and Raman enhancements measured with the three setups (sapphire slide, glass slide and air). For the three arrangements, Raman signals for the samples with FFSiO2 = 0.75% (a) are stronger than those with FFSiO2 = 1.5% (b). Measured Raman enhancements for the samples with FFSiO2 = 0.75% (c) and FFSiO2 = 1.5% (d). The corrected Raman enhancements at FFSiO2 = 0.75% (e) and FFSiO2 = 1.5% (f) are higher than two orders for arrangements using glass and sapphire slides. The inset shows a zoomed-in view of the first three FFTiO2 (0.26, 0.54 and 1.06%). | ||
The strongest Raman signal is collected for the air arrangement. This can be associated with the small spot size and depth of focus (higher numerical aperture) compared to the other arrangements (sapphire and glass slides), leading to an increase in the pumping power density per unit volume. The faster than linear increase in the Raman signal in FFTiO2 represents a per-particle enhanced Raman scattering cross section.
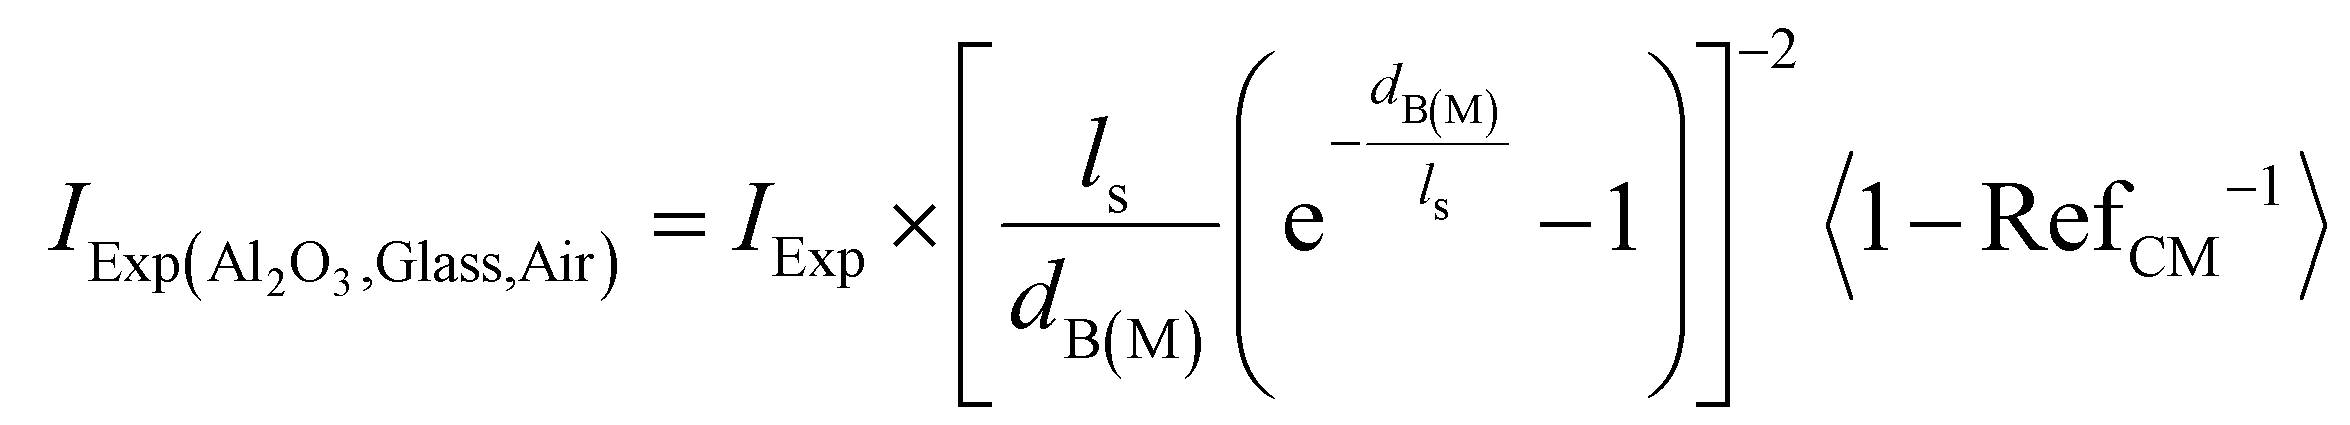
Conventionally, the Raman signal must be proportional to both the emitter concentration (FFTiO2) and excitation intensity. The enhancement of the Raman signal or Raman scattering cross section per particle as a function of FFTiO2, determined by normalizing the Raman signal by FFTiO2 and by the Raman signal at FFTiO2 = 0.26%, is illustrated in Fig. 2c and d. Even though the Raman signal is higher for the air arrangement (no slide), the enhancement in the Raman signal is stronger for the glass slide arrangement. This is the consequence of the index matching at the sample–glass interface, which would reduce the collection losses by internal reflection caused by an nS enhancement at the sample–glass interface. We also note that the experimental setup (50× objective with NA = 0.55) allows a collection depth (dB(M)) that is strongly sensitive to the pumping arrangement (sapphire and glass slides, and air). Therefore, for a better comparison of the enhancement as a function of FFTiO2, one needs a correction of the Raman intensity considering the pumping and collection depths, particularly for shorter scattering lengths (<dB(M)). Thus, the measured Raman signal is corrected for the effective depth of pumping and collection and for the reflection losses at the air–slide or air–sample interfaces as:
 | (1) |
In eqn (1), IExp(Al2O3,Glass,Air) is the corrected Raman signal. dB(M) and RefCM are the depth of pumping and collection for each slide and the reflection coefficient averaged over the pumping and collection cone angle at the air–slide or air–sample interfaces, respectively (see the ESI†).
For the above three setups (air, glass slide and sapphire slide), presented in Fig. 1, the Raman signal for each FFTiO2 > 0.26%, corrected by the effective depth of pumping and collection as well as by the reflected light at the air–slide or air–sample interfaces (IExp(Al2O3,Glass,Air)), was normalized by FFTiO2 and the Raman signal at FFTiO2 = 0.26% which allows the determination of the corrected Raman enhancement at each FFTiO2. For the above three setups, the determined-corrected Raman enhancement was plotted as a function of FFTiO2 as presented in Fig. 2e and f. For the three arrangements and FFTiO2 < 4.8%, the corrected Raman enhancement at FFSiO2 = 1.5% is stronger than that at FFSiO2 = 0.75%. This behavior is reverted for FFTiO2 ≥ 4.8%, which has been explained in our recent previous work4 through an increase of the residual absorption effect associated with the silica NPs (FFTiO2 ≥ 4.8%). For all FFTiO2 with both 0.75% and 1.5% FFSiO2, the lowest Raman enhancement was observed for the measurements without a slide (air), which can be explained through the collection losses due to internal reflection and light refraction at the sample–air interface caused by the enhanced refractive index of the sample near the sample–air interface. Additionally, for FFTiO2 < 1.35%, the strongest Raman enhancement was observed for the measurements with the sapphire slide. However, for FFTiO2 ≥ 4.8% with both 0.75% and 1.5% FFSiO2, the strongest Raman enhancement was achieved by using the glass slide. For FFTiO2 = 1.35%, Raman enhancements are similar for the measurements with both sapphire and glass slides. This result can be explained by the refractive index matching at the sample–slide (air, glass or sapphire) interfaces, which could be evidence of the dynamics of the effective refractive index in the sample interface. An index matching at the sample–slide interface reduces the collection losses by both the internal reflection and the decrease of the collection cone angle by light refraction at the sample–slide interface.
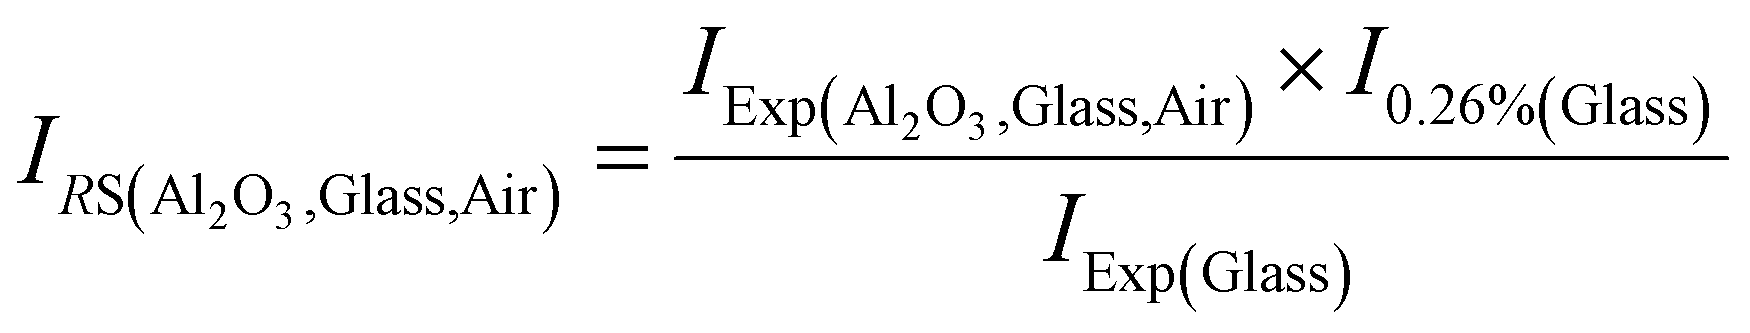
Next, in order to determine the losses by a possible nS enhancement, for each FFTiO2 > 0.26%, a scaling or normalization factor was calculated for the glass slide (I0.26%(Glass)/IExp(Glass)), where I0.26%(Glass) and IExp(Glass) are the corrected Raman signals obtained with the glass slide for FFTiO2 = 0.26% and FFTiO2 > 0.26%, respectively. The Raman signals measured at the lowest sample concentration, FFTiO2 = 0.26%, was taken as a reference because there was no Raman signal enhancement4 and presumably there should be no nS enhancement either. We have taken as a reference the ratio of the Raman signals between FFTiO2 = 0.26% and FFTiO2 > 0.26% measured with the glass slide because the classical refractive indexes of the sample (nCS) and glass slide (nCGlass) are very close. Therefore, if we preliminarily assume that a similar nGlass enhancement would also be induced at the sample–glass interface due to the interaction with the evanescent wave, the enhanced nS and nGlass at the sample–glass interface would also be very close. Thereby, the Raman signal losses due to the enhancement of the effective refractive indexes at the sample–glass interface (nS and nGlass) would be minimal. Clearly, the intensity of the evanescent wave decreases as it penetrates in the glass slide from the sample–slide interface. But as a first approximation, we will consider a similar enhancement of the electrical susceptibility of the glass (χeGlass) and the sample (χeS). With this normalization factor, we can obtain the expected values of the Raman signal enhancement if there were no losses due to the refractive index enhancement using the equation:
 | (2) |
 | (3) |
 | (4) |
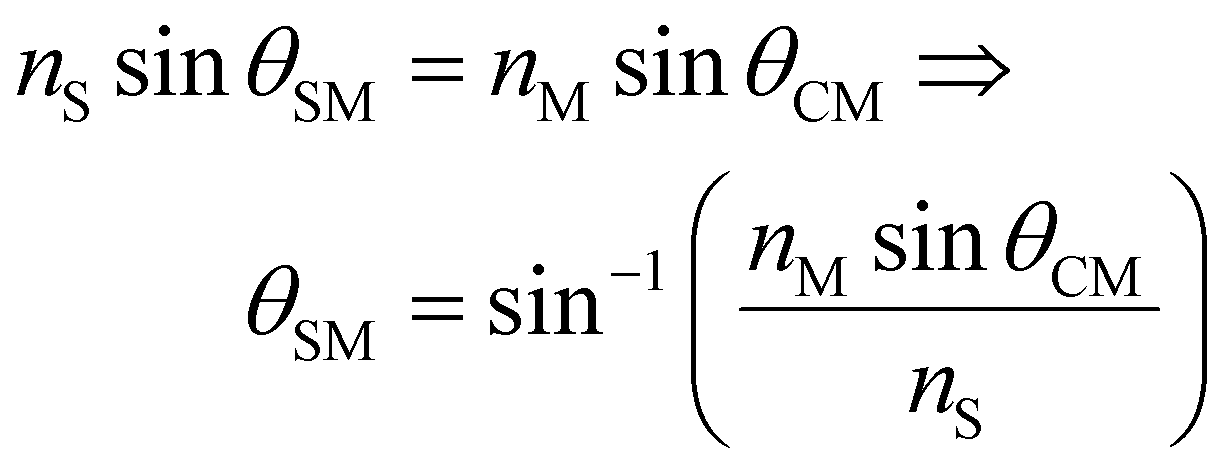
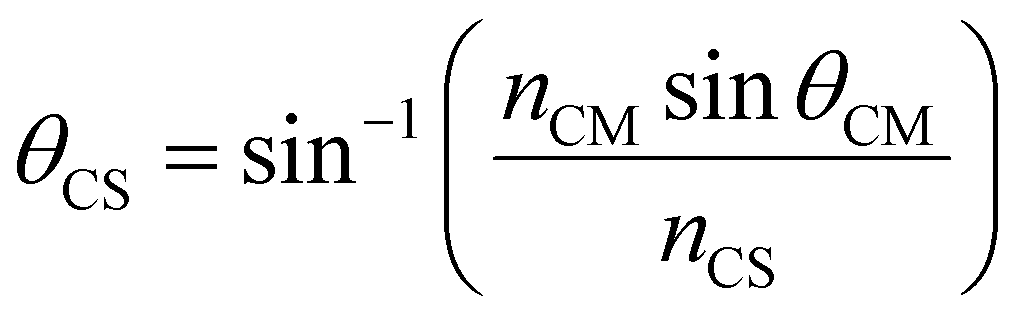
Thereby, we can estimate a classical value of the cone angle of the collected Raman signal from the sample without nS enhancement (θCS). For FFTiO2 = 4.8% and FFSiO2 = 0.75%, if we consider nCS = 1.44 and θCAir ≈ 33.4° (air, without slides), θCS can be determined as follows:
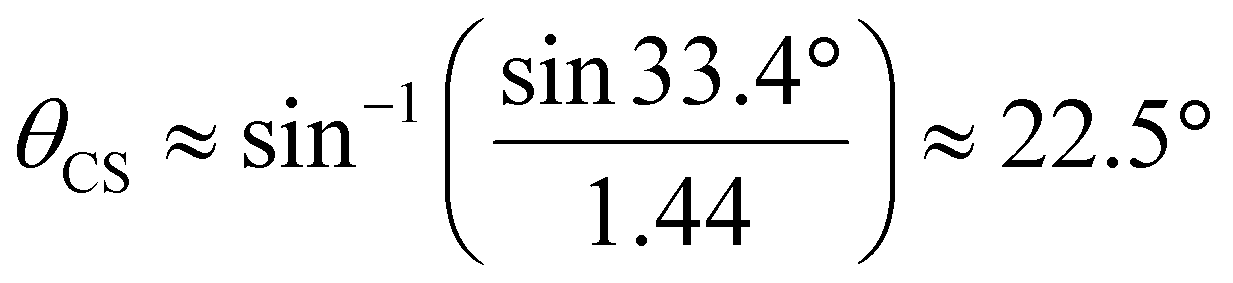
This classical θCS ≈ 22.5° (without enhancement) is the same for all microscope slides and air at FFTiO2 = 4.8% and FFSiO2 = 0.75% and only changes as a function of FFTiO2.
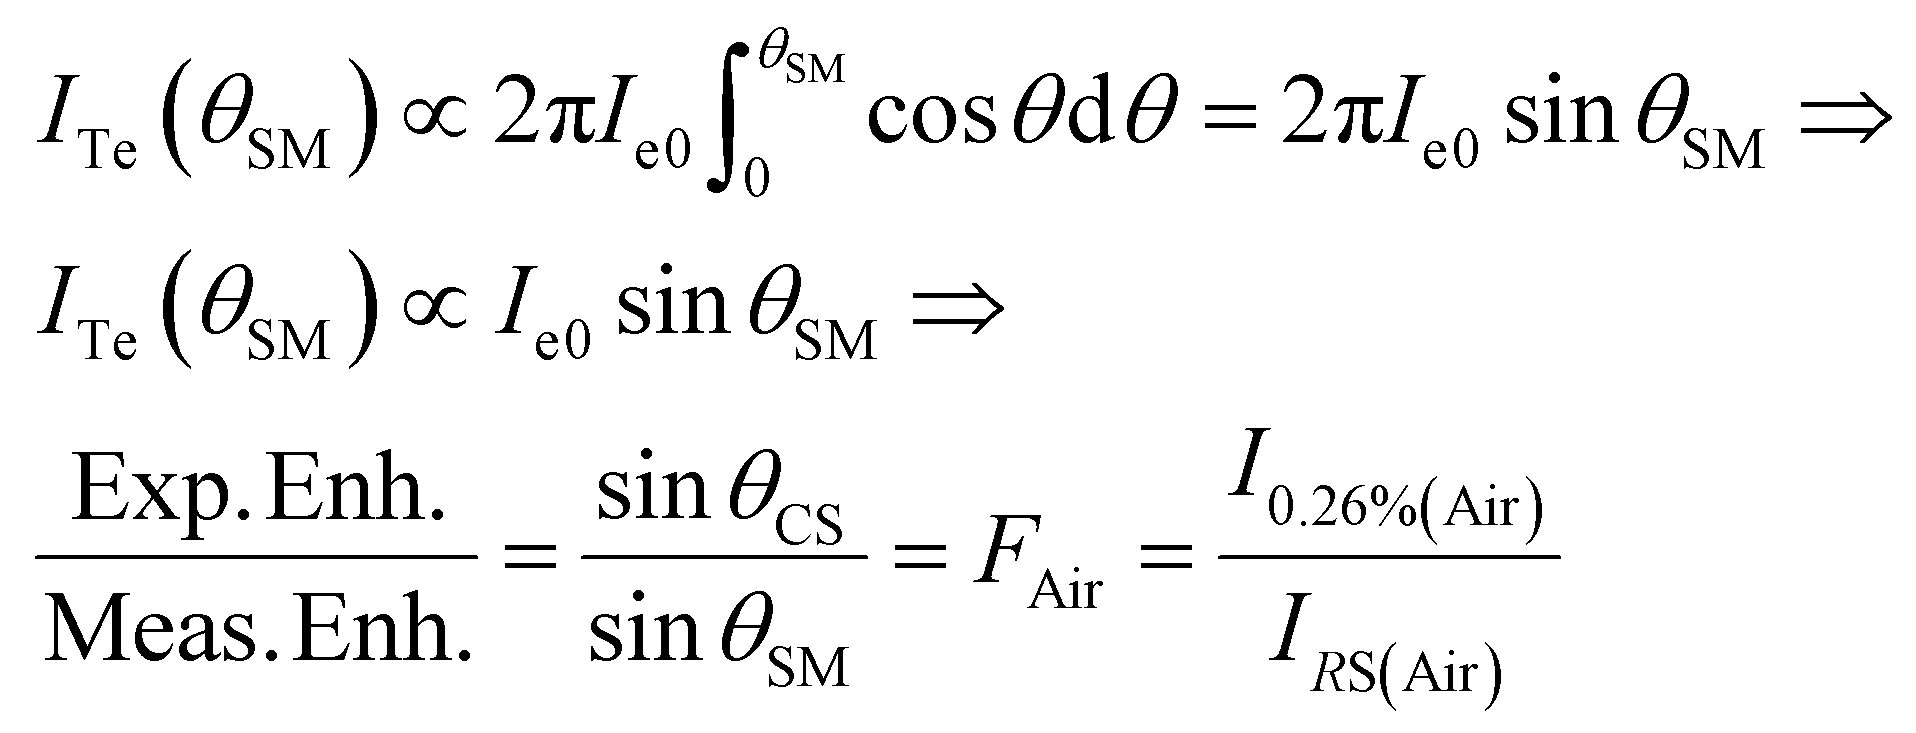
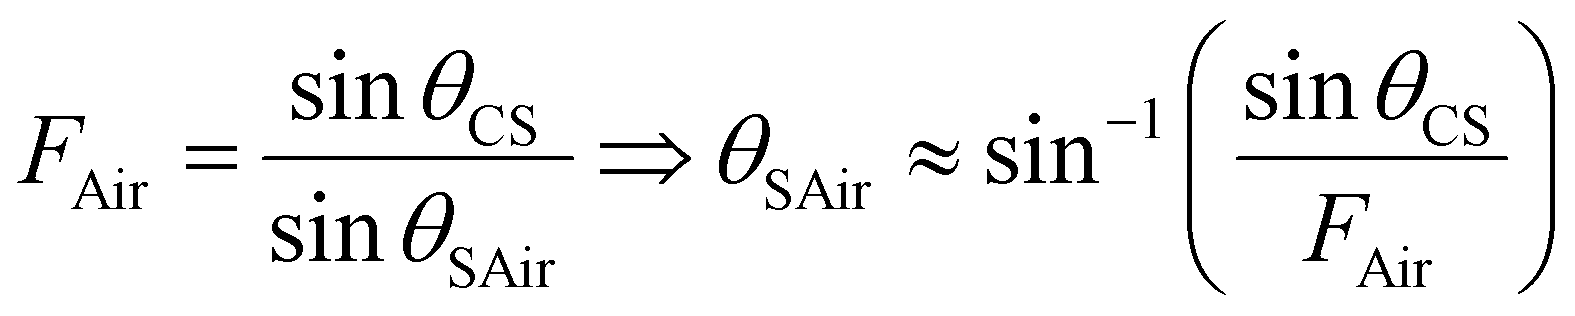
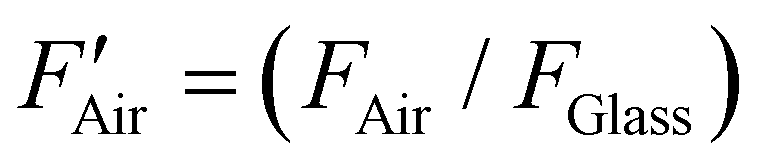
n CAir = 1 remains constant even if the effective refractive index of the sample is enhanced (bigger than its classical index, nS > nCS). This is because the electric susceptibility of air is very close to zero, so its enhanced electric susceptibility must also be close to zero. However, θSAir would be lower than θCS, so a decrease in the collected Raman signal is expected. For FFTiO2 > 0.26%, the IExp(Air) values are scaled as described by eqn (2), obtaining IRS(Air) values. The ratio (I0.26%(Air)/IRS(Air)) = FAir is defined as the deviation factor for the measurement without a slide (air). Note that FAir is the ratio between the expected enhancement (if there were no losses in the collection) and the measured enhancement of the Raman signal, i.e., FAir represents the losses of collected Raman intensity (eqn (5)).
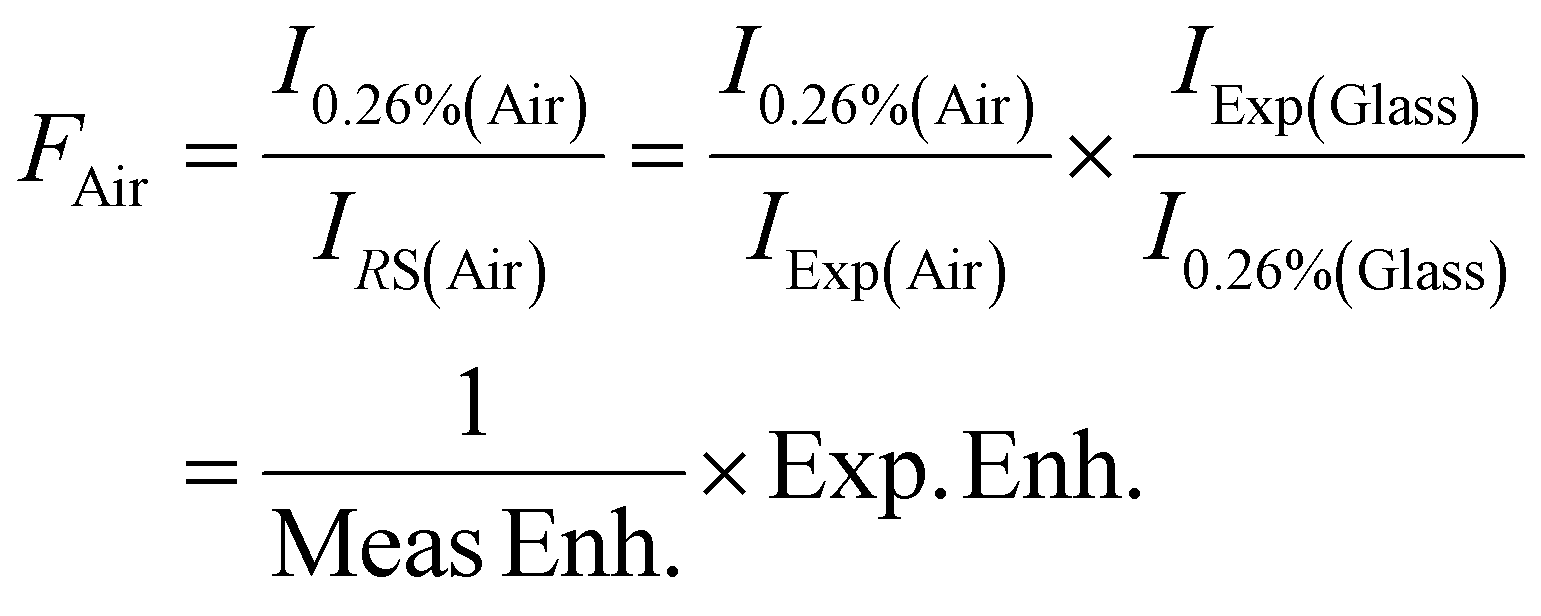 | (5) |
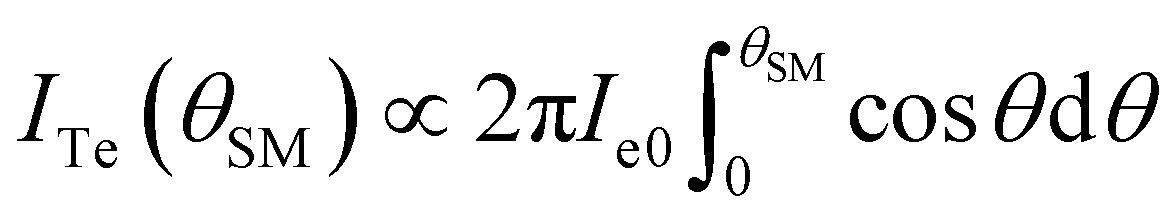
Note that (IExp(Glass)/I0.26%(Glass)) represents the expected enhancement of the Raman signal for each FFTiO2 > 0.26%, as it was preliminarily assumed that there are no Raman collection losses using a glass slide. On the other hand, the collected Raman intensity (ICR) is proportional to the total emitted Raman signal (ITe) in the θSM cone angle, i.e., ICR ∝ ITe(θSM) in the θSM cone angle. ITe(θSM) can be estimated by considering that the emitted Raman signal (IeR) is a Lambertian function in the emission angle θ (IeR(θ) ∝ Ie0cos![[thin space (1/6-em)]](https://www.rsc.org/images/entities/char_2009.gif) θ), where Ie0 is a constant that is proportional to the effective pumping intensity.
θ), where Ie0 is a constant that is proportional to the effective pumping intensity.
 | (6) |
Integrating it, we have:
 | (7) |
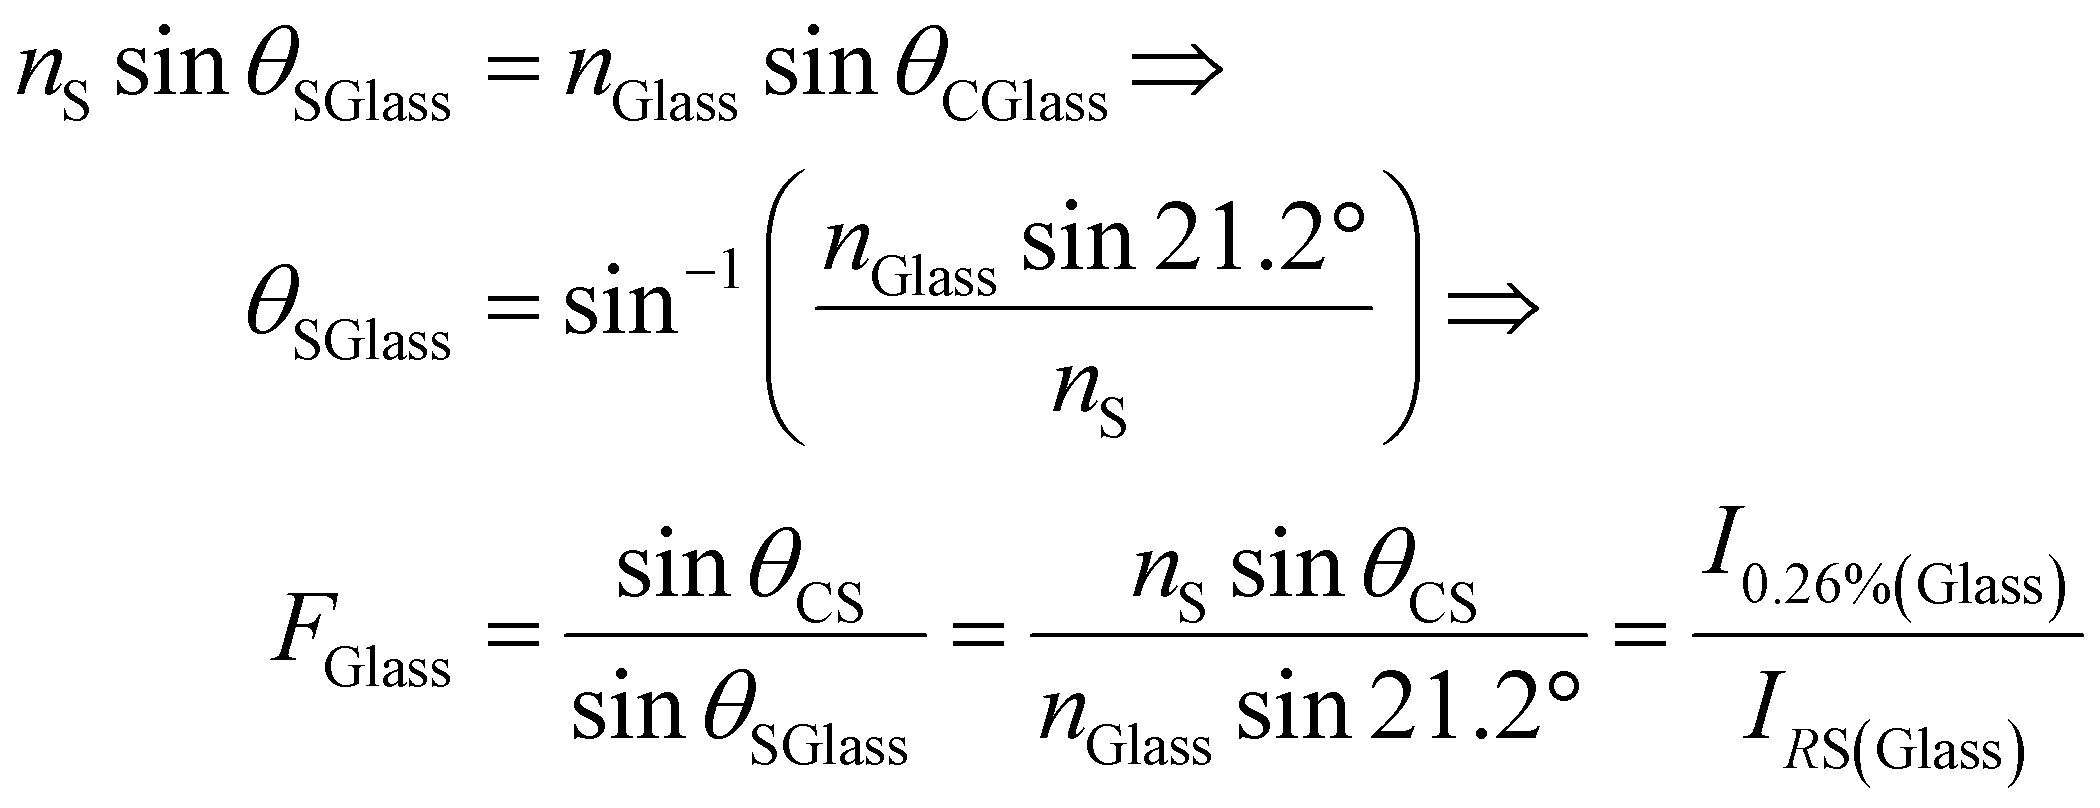
In this way, θSM for the measurement without a slide (θSAir) can be estimated using the following expression:
 | (8) |
Applying the Snell equation for this maximum angle of collection coming from the sample (θSAir) and assuming nAir = 1, we obtain:
 | (9) |
 | (10) |
From this nS value, 〈RSAir〉 is again determined, and a more accurate nS value is again calculated by iteration, until nS tends to reach the same value between iterations. We remark that the nS value has been determined by considering that, for the measurement with a glass slide, there is no deviation between the expected and measured Raman enhancements, i.e., I0.26%(Glass)/IRS(Glass) value is equal to unity, which was justified by assuming a similar enhancement for nS and nGlass at the sample–slide interface. But the latter approximation was used in order to estimate a preliminary nS value.
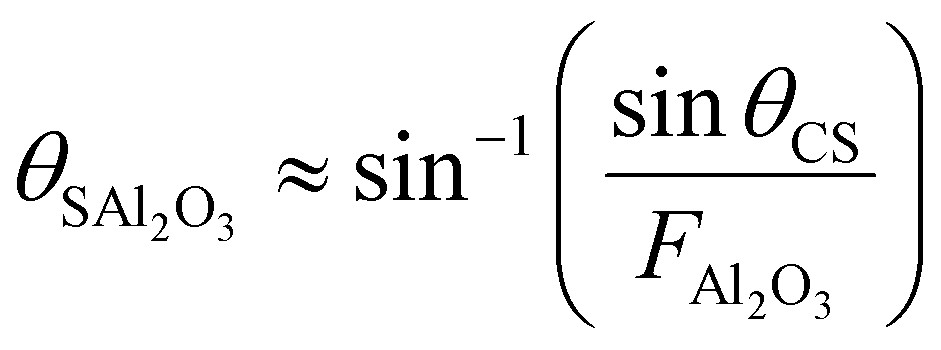
From this enhanced nS value, the enhanced value of nAl2O3, induced by the interaction with the evanescent wave at the sample–sapphire interface, can be estimated through the deviation factor with a sapphire cover slide, FAl2O3 = (I0.26%(Al2O3)/IRS(Al2O3)). θSAl2O3 can be expressed by applying a similar equation to eqn (8), substituting FAir by FAl2O3:
 | (11) |
Applying the Snell equation for this maximum angle of collection from the sample (θSAl2O3), we obtain:
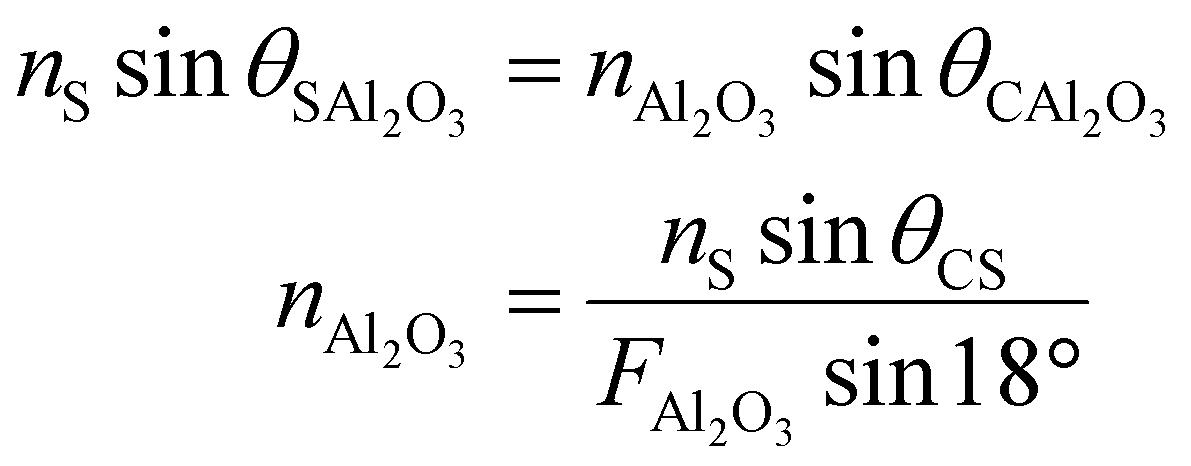 | (12) |
 | (13) |
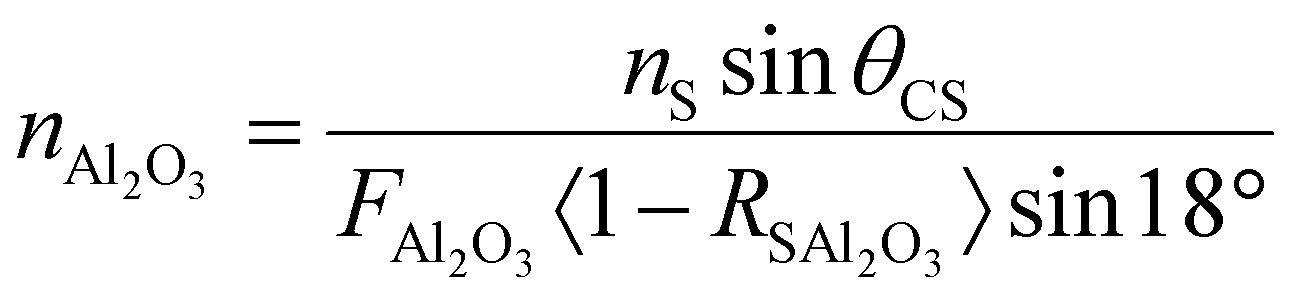
From this nAl2O3 value, 〈RSAl2O3〉 was again determined, and a more accurate nAl2O3 value was again calculated by iteration, until nAl2O3 tends to reach the same value between iterations. It is important to remark again that in the latter considerations we assumed as a first approximation that nGlass at the sample–glass interface undergoes an enhancement similar to that of the sample. However, the effective refractive index and susceptibility of the slide should decrease progressively from the sample–slide interface since the interaction of the evanescent wave decreases as it penetrates in the glass slide. This implies that the effective enhancement of susceptibility of the slide at the sample–glass interface should be less than that of the sample. The effective nGlass value (enhanced) at the sample–glass interface can be estimated theoretically from the enhanced nAl2O3 value determined above. Assuming that the classical susceptibilities of glass (χeCGlass) and sapphire (χeCAl2O3) at the sample–slide interface should be enhanced approximately equally, the enhanced nGlass can be estimated as:
 | (14) |
 | (15) |
 and
and 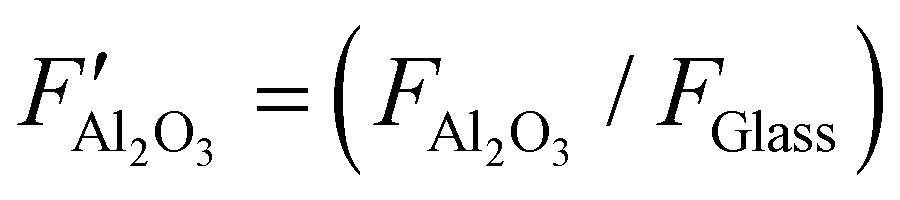 were obtained. Consecutively, nS, nAl2O3 and nGlass values were again calculated (more accurately) from
  and
and  values. Fig. S3 (ESI†) shows a schematic diagram of the flow of operations to determine the effective refractive indexes of the sample and slides (nS, nAl2O3 and nGlass) at the sample–slide interface.
Fig. 3a and b show the effective refractive indexes (nS) and electric susceptibilities (χeS) of the samples, experienced by emitted Raman photons, at the input sample–slide interface, extracted using the above method, as a function of FFTiO2, respectively.
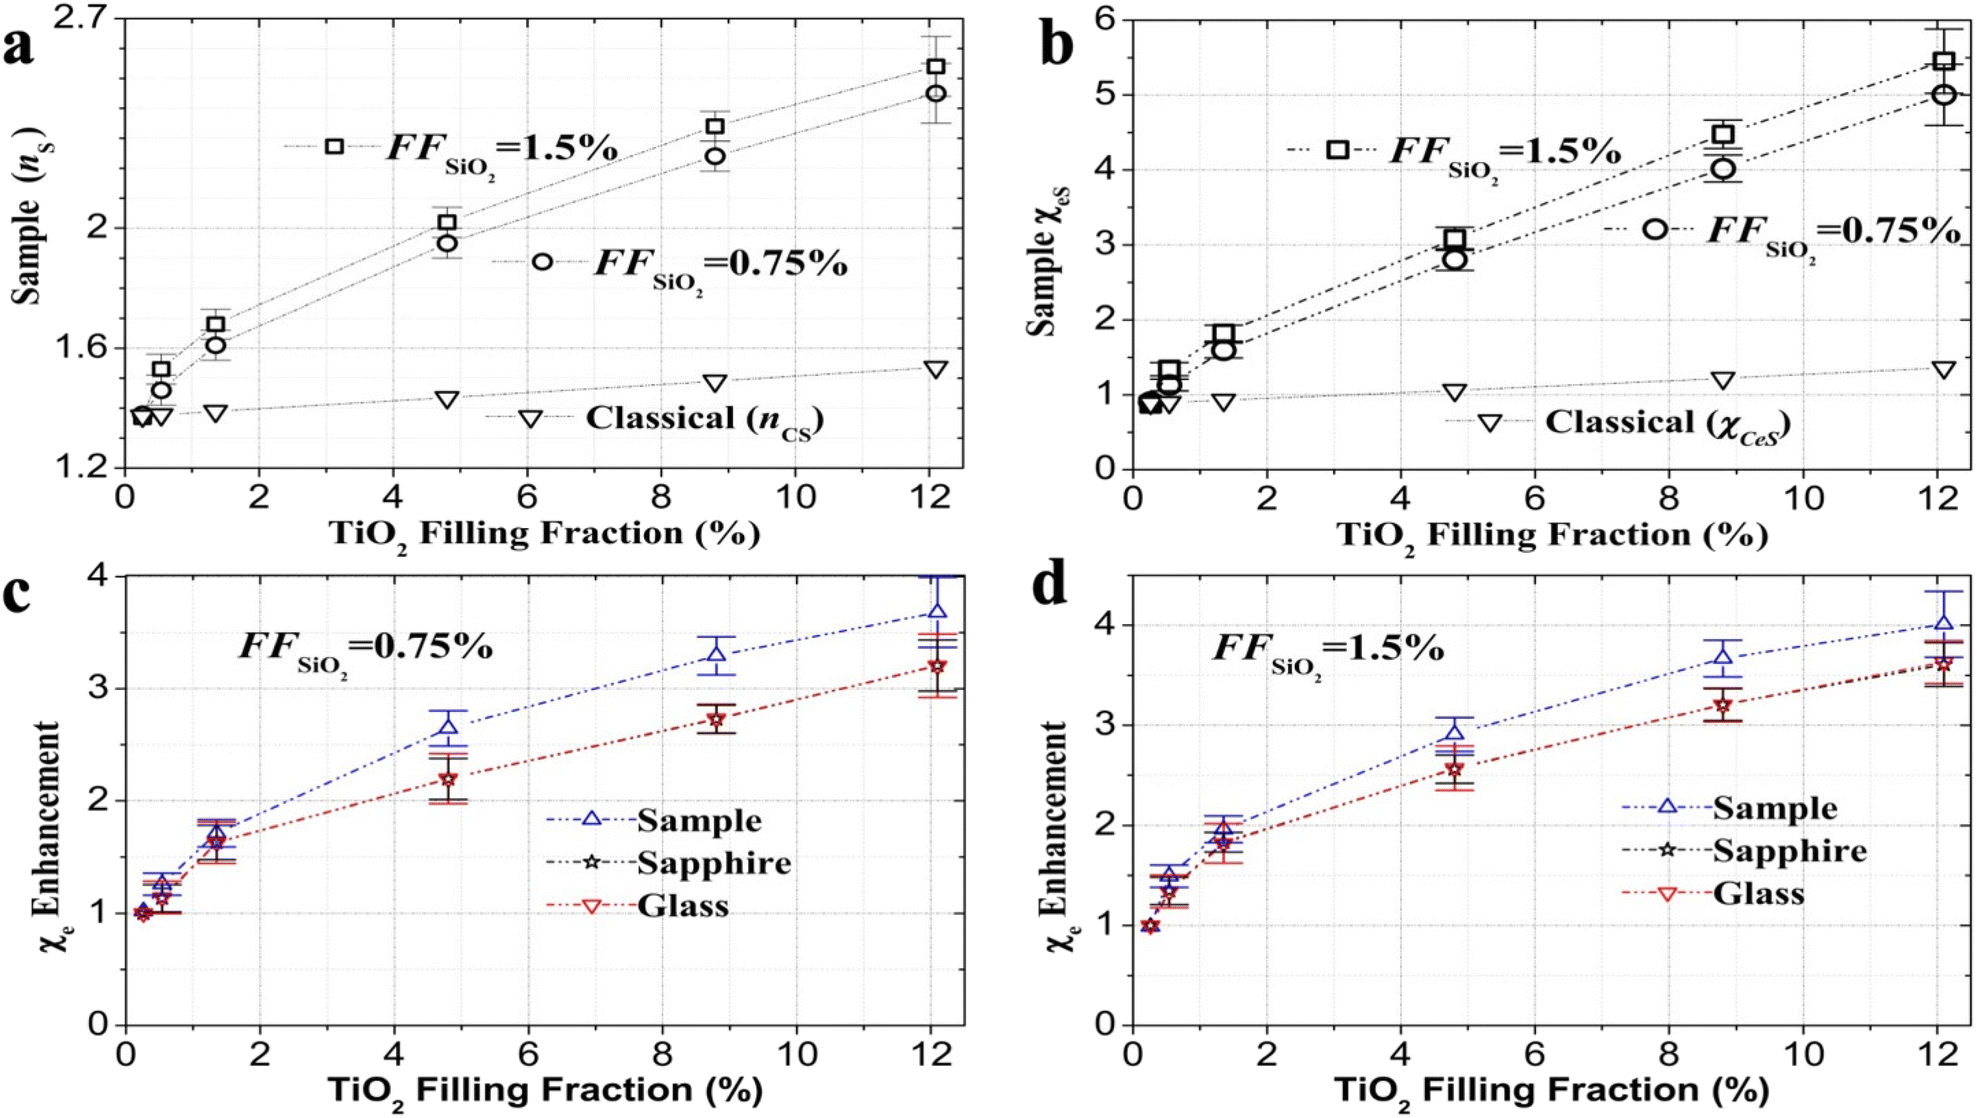 | ||
| Fig. 3 Determination of the effective refractive index and the corresponding electric susceptibilities extracted by the losses of the Raman signals. (a) Strong enhancement of the effective refractive index (nS) and (b) electric susceptibility (χeS) of the sample is observed as FFTiO2 is increased. Black inverted triangles in (a) represent the classical refractive index (nCS) and in (b) represent the classical electric susceptibility (χCeS) of the sample calculated by Maxwell–Garnett approximation; (c and d) electric susceptibility enhancements of the samples (blue triangles), sapphire (black stars) and glass (red triangles) extracted from measurements using samples with FFSiO2 = 0.75% (c) and FFSiO2 = 1.5% (d). | ||
A monotonic nS and χeS increase is observed as FFTiO2 is increased. For all FFTiO2, the effective refractive index and electric susceptibility of the samples with FFSiO2 = 1.5% are higher than those of the samples with FFSiO2 = 0.75%. This behavior is expected for FFTiO2 < 4.8%, since Raman enhancement for FFTiO2 < 4.8% is stronger in the samples with FFSiO2 = 1.5%, (stronger enhanced Raman signal) in comparison with the samples with FFSiO2 = 0.75% (Fig. 2). However, for FFTiO2 ≥ 4.8%, the above behavior is not intuitive since the enhanced Raman signal is larger for the samples with FFSiO2 = 0.75%. This may be the result of a higher residual absorption in the samples with FFSiO2 = 1.5% (larger total surface area of SiO2 NPs),4 which for FFTiO2 ≥ 4.8% would begin to contribute appreciably to the value of the deviation factors used to calculate the effective refractive index. This effect would be particularly pronounced for the FAir values, due to the higher internal reflection (higher refractive index contrast) at this sample–air interface. For FFTiO2 ≥ 4.8%, the collected Raman signal can be reduced (mainly in air) by two main causes: (i) the decrease of the collection cone angle due to the refraction of light at the sample–slide interface (approximation used for the refractive index determination) and (ii) a more strongly enhanced residual absorption (particularly, for the samples with FFSiO2 = 1.5%). The latter hypothesis would imply that the FAir value includes implicitly additional losses by residual absorption (FFTiO2 ≥ 4.8%), which means that the FAir value, extracted from the measurements and used for refractive index determination, would be effectively increased by the residual absorption (mainly for FFSiO2 = 1.5% and FFTiO2 ≥ 4.8%). The latter would limit the accuracy of the above method to only a negligible residual absorption.
Fig. 3c and d show the enhancement of the electric susceptibilities (sample, sapphire and glass) experienced by Raman photons and extracted from the measurements in the samples with 0.75% and 1.5% FFSiO2, respectively. For all FFTiO2, the enhancements of the effective susceptibilities (sample, sapphire and glass) for FFSiO2 = 1.5% are stronger than for FFSiO2 = 0.75%. Again, for the samples with FFTiO2 ≥ 4.8% and FFSiO2 = 1.5%, this may be due to a higher loss of the Raman signal given its higher residual absorption. Additionally, for both FFSiO2, the enhancement of the slide's susceptibilities (sapphire and glass slides) is less than that of the sample's, which can be explained by the decrease of the evanescent wave interaction coming from the sample entering the slides.
The extended enhancement of the effective refractive index to the immediate vicinity of the sample edge through interaction with the evanescent wave coming from the sample represents a phenomenon to highlight that makes it a powerful sensing tool with great potential applications. It should be noted that different from the SERS phenomenon, where strong enhancement of light–matter coupling occurs very close to the nanometallic structure and at a specific wavelength and bandwidth (plasmon resonance),28 the strong enhancement of the effective refractive index, described in this work, is extended to longer distances from the sample surface (extension of the evanescent wave) and possibly to a wider range of wavelengths (see our previous work).4 This means that the evanescent wave extension range in the near vicinity of the medium is considerably larger (hundreds of nanometers) than that of SERS (several nanometers).
For a negligible residual absorption, the enhancement factor of the sample's electric susceptibility, Gχe, experienced by the Raman photons is:
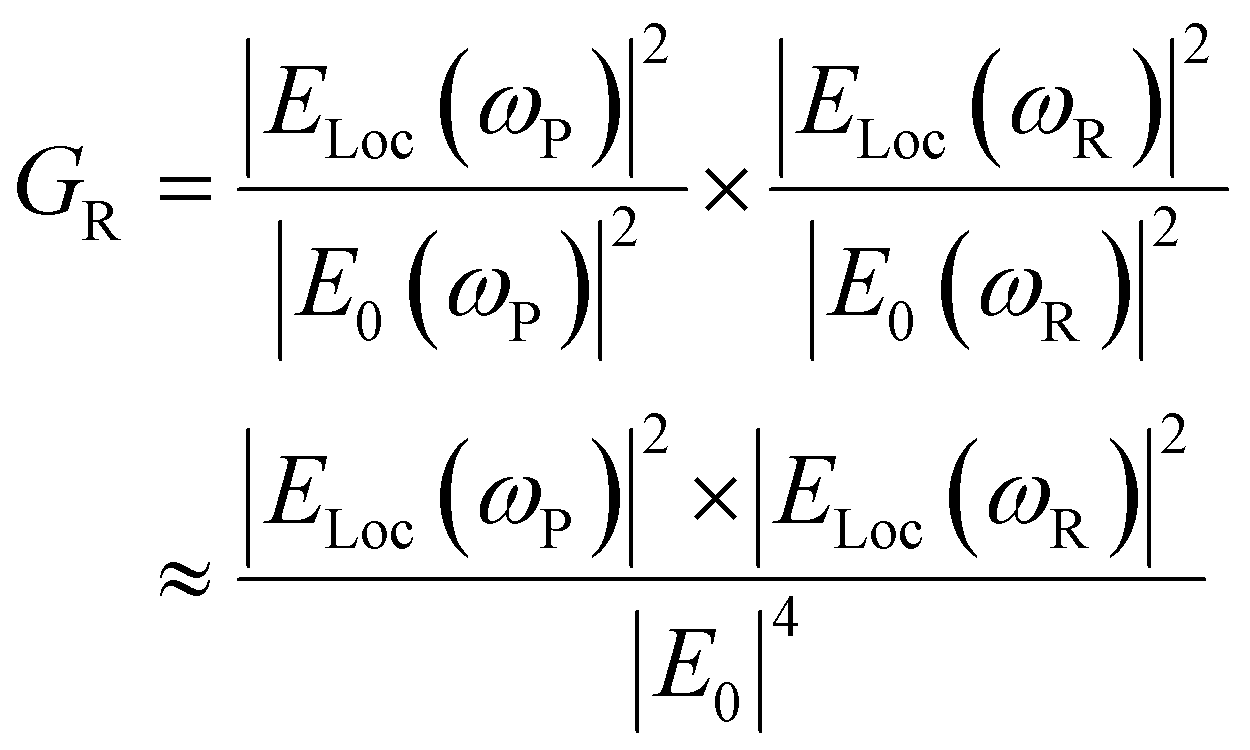
On the other hand, the enhancement factor of the Raman signal (GR) due to strongly localized electromagnetic field is defined as:
For the glass slide arrangement, Fig. 4a and b show a comparison of the Raman enhancement (GR) and the fourth power of the electrical susceptibility enhancement (Gχe)4 for the samples with FFSiO2 = 0.75% and FFSiO2 = 1.5%, respectively. For FFSiO2 = 0.75% (Fig. 4a), where the residual absorption effect should show less influence, a similar monotonic increase of GR and (Gχe)4 in FFTiO2 (seemingly a power law) is observed. Nevertheless, (Gχe)4 increase is slightly lower (lower slope) than GR increase for FFTiO2 ≥ 4.8%. The latter could be a consequence of a decrease in light confinement for Raman emission in comparison with the Raman pumping source, due to the low coherence of the Raman emission.
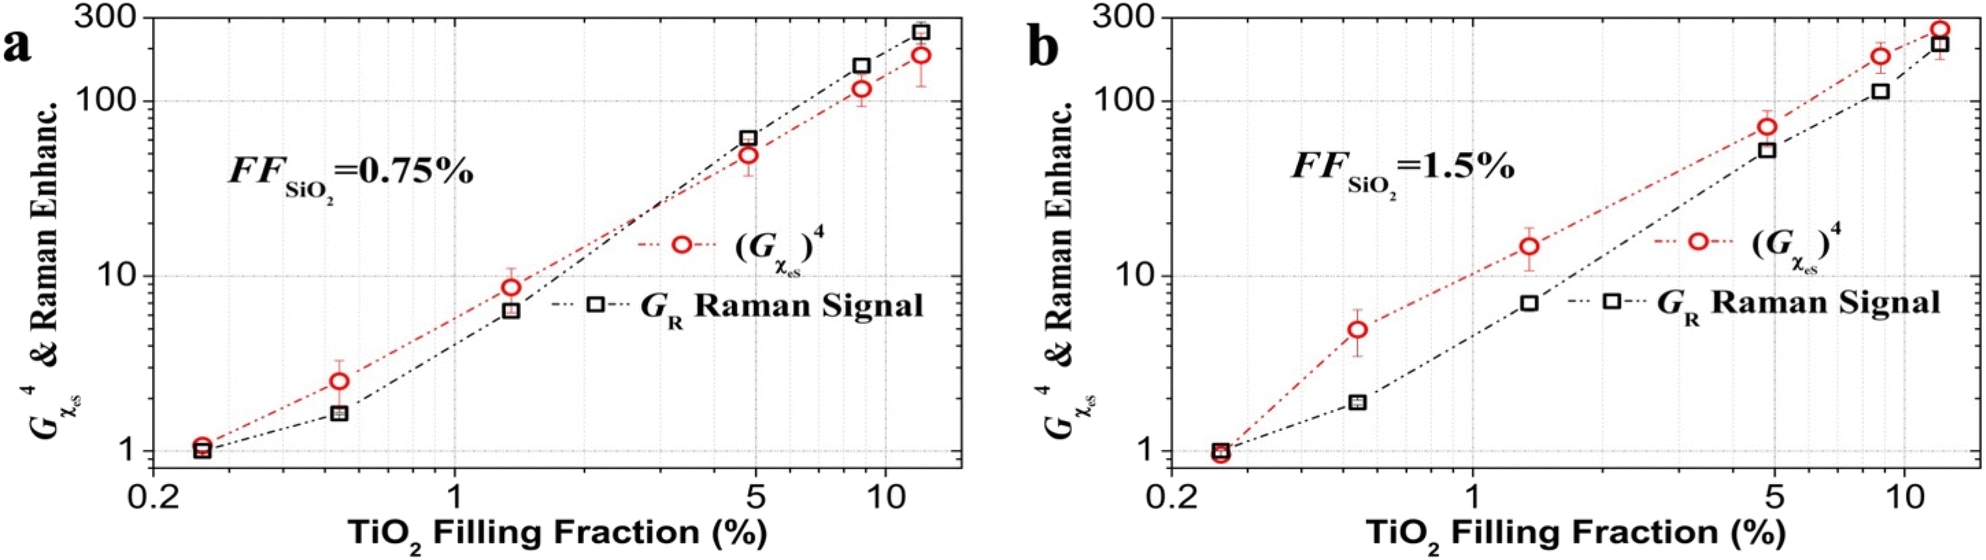 | ||
| Fig. 4 Comparison of the Raman enhancement measured using a glass slide to cover the samples, GR (black open squares), and fourth power of the electric susceptibility enhancement, (Gχe)4 (red open circles), for the samples with (a) FFSiO2 = 0.75% and (b) FFSiO2 = 1.5%. | ||
For FFSiO2 = 1.5% (Fig. 4b), a similar monotonic increase of GR and (Gχe)4 in FFTiO2 is also observed. Nevertheless, (Gχe)4 values are slightly higher than GR values, which could be attributed to the effect of residual absorption. Note that the residual absorption should contribute for both a decrease of the Raman enhancement and an increase of the electrical susceptibility enhancement.
It is important to highlight that this enhancement of the effective refractive index at the sample–slide interface, experienced by Raman photons, is experienced for the Raman emission intensity that is much lower than the Raman pumping intensity. Taking into account the nonlinear refractive index coefficient recently reported for rutile films (n2 = −1.36 × 10⁻¹⁶ m2 W−1)29 and the power densities used for pumping (∼1011 W m−2), both for a wavelength of 532 nm, the variation of refractive index (Δn rutile) must be around Δn ∼ −10−5. This further suggests that the observed enhancement of the effective refractive index experienced by the Raman emission (power density several orders lower) represents an anomalous non-linear phenomenon that cannot be explained in the context of the classical nonlinear optical framework, i.e., it would be essentially and conceptually different from a classical non-linear phenomenon.
Contrary to a classical non-linear phenomenon, which is due to the increased probability of simultaneous multi-photon interaction (very strong electromagnetic field), we propose that this anomalous non-linear phenomenon would be induced by the increased probability of sequential photon interactions, due to the strong correlation of the photons in the strongly localized electromagnetic modes. The latter can be understood as successive polarization of valence electrons to virtual states. The considerable benefit of sequential photon interaction is that it emerges even at very low intensity of the incoming electromagnetic field, i.e., there is no threshold for this phenomenon.
Further studies on the enhancement of the Raman signal and refractive index in this correlated-structured scattering system are called for in order to deepen the understanding on these strongly localized electromagnetic modes (localization of light) and associated phenomena.
Conclusion
By studying the Raman signal in this structured scattering medium with three configurations (two different cover slides and air), the effective refractive indexes of the structured medium (sample) and slides (sapphire and glass) experienced by Raman photons at the sample–slide interface were extracted. A strong enhancement of the effective refractive index experienced by the Raman photons is determined. This finding is attributed to the electromagnetic modes strongly localized in this structured scattering medium and the evanescent wave interaction coming from them, whose origin is induced by the correlation in the scatterers’ position. The latter is caused by a strong Coulomb interaction between TiO2@Silica NPs (scatterers), which is favored by the presence of silica NPs of 20 nm size. The silica NPs act like pivots or bridges for the interaction between TiO2@Silica NPs, leading to a stronger correlation in the scatterers’ positions which, in turn, favors interferential processes (higher density and Q-factors of strongly localized electromagnetic modes).The enhancement of the effective refractive index of both sapphire and glass slides, due to the evanescent wave interaction, is weaker than that of the sample, which is explained through the decrease of the evanescent wave interaction coming from the sample entering the slides. This strong enhancement of the effective refractive index, extended to the vicinity of loss-less materials, opens up a number of interesting sensing applications that require extended volumes of interaction and spectral sensitivities, which are way outside the SERS capabilities. A study of the detection sensitivity of molecules immobilized on a solid interface in contact with this structured medium is called for in order to demonstrate possible applications. The findings presented here open an avenue for designing and manufacturing advanced photonics devices.
Author contributions
F.C.M. & E.J.V. synthesized the nanoparticles; J.D., N.U.W. & E.J.V. performed the Raman experiments; J.D., N.U.W., F.C.M., A.D. & E.J.V. analyzed the results and prepared the manuscript; E.J.V. wrote the manuscript and guided the research.Data availability
Data for this article, including collected Raman signals for each experimental arrangement and concentrations of TiO2@Silica and silica NPs, are available at the following link: https://drive.google.com/drive/folders/1VqnzGWPZPumwiIMeqFd-SvNBbO1U5WQv?usp=sharing.Conflicts of interest
The authors declare no conflicts of interest.Acknowledgements
We gratefully acknowledge financial support from FAPESP (grants 2022/02525-2; 2019/06334-4; 2021/04334-7; 2017/11986-5 and 2017/10765-5), CNPq (grants 313703/2021-3, 435260/2018-9, 465423/2014-0) and IPEN/CNEN 2020.06.IPEN.33.PD. This work was partially funded by the Office of Naval Research under N00014-20-1-2789.References
- V. A. Ermakov, W. S. Martins, N. U. Wetter, F. C. Marques and E. Jiménez-Villar, Nanoscale, 2021, 13, 6417–6425 RSC.
- S. John, Nat. Mater., 2012, 11, 997–999 CrossRef CAS PubMed.
- S. John, Phys. Today, 1991, 44, 32 CrossRef.
- J. Dipold, N. Wetter, F. Marques, A. Freitas, A. Dogariu and E. Jimenez Villar, J. Opt. Soc. Am. B, 2024, 41, 1415 CrossRef CAS.
- C. T. Dominguez, A. A. V. Gomes, N. U. Wetter, J. Dipold, V. Mestre, W. S. Martins and E. Jiménez-Villar, Opt. Mater., 2021, 120, 111428 CrossRef CAS.
- S. Torquato, J. Compos. Mater., 2022, 56, 3635–3649 CrossRef.
- F. Sgrignuoli, S. Torquato and L. Dal Negro, Phys. Rev. B: Condens. Matter Mater. Phys., 2022, 105, 064204 CrossRef CAS.
- S. Yu, C.-W. Qiu, Y. Chong, S. Torquato and N. Park, Nat. Rev. Mater., 2020, 6, 226–243 CrossRef.
- K. Vynck, R. Pierrat, R. Carminati, L. S. Froufe-Pérez, F. Scheffold, R. Sapienza, S. Vignolini and J. J. Sáenz, Rev. Mod. Phys., 2023, 95, 045003 CrossRef CAS.
- S. Yu, Nat. Comput. Sci., 2023, 3, 128–138 CrossRef PubMed.
- P. A. Nosov, I. M. Khaymovich and V. E. Kravtsov, Phys. Rev. B, 2019, 99, 104203 CrossRef CAS.
- D. S. Wiersma, P. Bartolini, A. Lagendijk and R. Righini, Nature, 1997, 390, 671–673 CrossRef CAS.
- M. Störzer, P. Gross, C. M. Aegerter and G. Maret, Phys. Rev. Lett., 2006, 96, 1–4 CrossRef PubMed.
- F. Scheffold and D. Wiersma, Nat. Photonics, 2013, 7, 934 CrossRef CAS.
- F. Scheffold, R. Lenke, R. Tweer and G. Maret, Nature, 1999, 398, 206–207 CrossRef CAS.
- T. Van Der Beek, P. Barthelemy, P. M. Johnson, D. S. Wiersma and A. Lagendijk, Phys. Rev. B: Condens. Matter Mater. Phys., 2012, 85, 1–11 CrossRef.
- S. E. Skipetrov and J. H. Page, New J. Phys., 2016, 18, 021001 CrossRef.
- S. John, Phys. Rev. Lett., 1984, 53, 2169–2172 CrossRef.
- E. Jimenez-Villar, I. F. Da Silva, V. Mestre, P. C. De Oliveira, W. M. Faustino and G. F. De Sá, Nanoscale, 2016, 8, 10938–10946 RSC.
- K. Dutta and S. K. De, J. Nanopart. Res., 2007, 9, 631–638 CrossRef CAS.
- A. S. Dukhin and P. J. Goetz, in Characterization of Liquids, Dispersions, Emulsions, and Porous Materials Using Ultrasound, Elsevier, 2017, pp. 19–83 Search PubMed.
- E. Jimenez-Villar, V. Mestre, W. S. Martins, G. F. Basso, I. F. da Silva and G. F. de Sá, Mater. Today: Proc., 2017, 4, 11570–11579 Search PubMed.
- E. Jiménez-Villar, I. F. da Silva, V. Mestre, N. U. Wetter, C. Lopez, P. C. de Oliveira, W. M. Faustino and G. F. de Sá, ACS Omega, 2017, 2, 2415–2421 CrossRef PubMed.
- E. Jimenez-Villar, M. C. S. Xavier, J. G. G. S. Ramos, N. U. Wetter, V. Mestre, W. S. Martins, G. F. Basso, V. A. Ermakov, F. C. Marques and G. F. de Sá, in Complex Light and Optical Forces XII, ed. D. L. Andrews, E. J. Galvez and J. Glückstad, SPIE, 2018, vol. 1054905, p. 4 Search PubMed.
- E. Jimenez-Villar, M. C. S. Xavier, N. U. Wetter, V. Mestre, W. S. Martins, G. F. Basso, V. A. Ermakov, F. C. Marques and G. F. de Sá, Photonics Res., 2018, 6, 929 CrossRef CAS.
- G. Campagnano and Y. V. Nazarov, Phys. Rev. B: Condens. Matter Mater. Phys., 2006, 74, 1–15 CrossRef.
- E. Jiménez-Villar, W. S. Martins and N. U. Wetter, Appl. Opt., 2023, 62, 2707 CrossRef PubMed.
- M. Jahn, S. Patze, I. J. Hidi, R. Knipper, A. I. Radu, A. Mühlig, S. Yüksel, V. Peksa, K. Weber, T. Mayerhöfer, D. Cialla-May and J. Popp, Analyst, 2016, 141, 756–793 RSC.
- H. Long, A. Chen, G. Yang, Y. Li and P. Lu, Thin Solid Films, 2009, 517, 5601–5604 CrossRef CAS.
Footnote |
| † Electronic supplementary information (ESI) available: Theoretical description of the TiO2@Silica Coulomb interaction in the colloidal suspension; description of the Raman measurement setups and Raman emission spectra; mathematical description for the Raman signal correction by pumping and collection depth; the effective refractive indexes of the sapphire and glass slides at the sample–slide interface extracted from measurements; schematic description of the flow of operations executed to determine the effective refractive indexes. See DOI: https://doi.org/10.1039/d4nr03626c |
| This journal is © The Royal Society of Chemistry 2025 |