
 Open Access Article
 This Open Access Article is licensed under a Creative Commons Attribution-Non Commercial 3.0 Unported Licence
Reduction behaviors of tin oxides and oxyhydroxides during electrochemical reduction of carbon dioxide in an aqueous solution under neutral conditions†
Etsushi
Tsuji
 *a,
Kaede
Ohwan
a,
Tomoki
Ishikawa
a,
Yuki
Hirata
a,
Hiroyuki
Okada
a,
Satoshi
Suganuma
ab and
Naonobu
Katada
a
*a,
Kaede
Ohwan
a,
Tomoki
Ishikawa
a,
Yuki
Hirata
a,
Hiroyuki
Okada
a,
Satoshi
Suganuma
ab and
Naonobu
Katada
a
aCenter for Research on Green Sustainable Chemistry, Tottori University, Tottori 680-8552, Japan. E-mail: tsuji@tottori-u.ac.jp
bInstitute for Catalysis, Hokkaido University, Kita21, Nishi10, Kita-ku, Sapporo 001-0021, Japan
First published on 17th January 2025
Abstract
It is well known that tin oxides and oxyhydroxides show high selectivity for the electrochemical CO2 reduction reaction (CO2RR) to form HCOOH in aqueous solutions. Tin oxides and oxyhydroxides are reduced to form metallic Sn during the CO2RR, and the formed interface between the oxide and metallic Sn plays important roles in the CO2RR. In this study, reduction behaviors of tin oxides and oxyhydroxide during the CO2RR were investigated. SnO, SnO2 and tin oxyhydroxide containing both amorphous and crystalline phases were formed using solvothermal, sol–gel and precipitation methods, respectively. Reduction current densities of SnO2 and the oxyhydroxide for the CO2RR and hydrogen evolution reaction at −0.8 V vs. RHE were higher than that of SnO, and the faradaic efficiency of the oxyhydroxides for formation of HCOOH and CO was >90%. Based on high-resolution TEM observation and EDS mappings, it was revealed that metallic Sn nanoparticles with a ∼40 nm diameter were formed from SnO2 and tin oxyhydroxides during the CO2RR via a dissolution and reductive deposition process. Aggregates of SnO2 and the oxyhydroxide were dissolved in a neutral electrolyte solution during the CO2RR, and subsequently, metallic Sn nanoparticles with highly effective surface areas were formed on carbon electrodes via reductive deposition from dissolved Sn cations, leading to a higher reduction current. The thickness of native oxide layers formed on the surface of the metallic Sn particles in air after the CO2RR from the oxyhydroxide was greater than those of SnO and SnO2. Therefore, it is speculated that metallic surfaces of the former ones were more easily formed at the interface between SnOx and metallic Sn than those of the latter ones, leading to high selectivity for the CO2RR.
Sustainability spotlightOur research aims to reveal reduction behaviors of Sn oxide-based catalysts, which are promising electrocatalysts for the CO2 reduction reaction. Reduction behaviors of Sn oxide-based catalysts are important to improve catalytic activity for CO2 reduction because the activity is enhanced by the interface between SnOx and metallic Sn formed through reduction of the catalysts during CO2 reduction. Our research contributes toward achieving effective conversion of CO2 into chemical feedstocks for a sustainable society. Our study emphasizes the importance of the following UN Sustainable Development Goals: affordable and clean energy (SDG 7), industry, innovation and infrastructure (SDG 9), and climate action (SDG 13). |
Introduction
It is necessary to decrease CO2 concentration, which is the main cause of global warming on the earth.1 The electrocatalytic CO2 reduction reaction (CO2RR) in aqueous solutions using renewable energy, such as solar, wind and geothermal powers, is one of the promising technologies to convert CO2 into various chemical feedstocks,2,3 for example, CO,4,5 HCOOH,6–10 CH4,11,12 CH3OH13,14 and lower olefins.14–18 In electrocatalytic reactions, cathodic and anodic reactions are specifically separated, leading to facile collection of products. Meanwhile, H2 is also produced as a by-product during the CO2RR in an aqueous solution. Therefore, it is important to develop electrocatalysts with both high activity and high selectivity for the CO2RR.It is well known that tin-based electrocatalysts, such as metal,19 alloys,20–22 oxides,6–10 oxyhydroxides,7–23 and sulfides,24–26 progress to form HCOOH via the CO2RR. In many cases, the electrocatalytic activity and selectivity of tin oxides for the CO2RR were higher than those of metallic Sn, although they were usually reduced to metallic Sn during the CO2RR because the metallic phase is the most thermodynamically stable under reduction conditions for the CO2RR.6,7,27 Chen et al. reported that the electrocatalytic activity of Sn electrodes decreased upon the etching of the native oxide layer on the surface.6 They also reported that CO2RR activity was enhanced through the electrodeposition of an oxide layer on the metallic surface, resulting in enhanced electrocatalytic activity for the CO2RR by the interface between metallic Sn and SnOx. Baruch et al. investigated the reduction behaviors of CO2 on thin films of mixed Sn/SnOx species by in situ attenuated total reflectance infrared spectroscopy.7 They proposed that the reduction of CO2 was preceded by the two-electron reduction of SnO2 to a Sn(II) hydroxide species, which can react with CO2 to form surface-bound carbonate. Then, the carbonate species reacted with two electrons and a proton to form HCOOH, and returned to the Sn(II) hydroxide species by quick desorption of the formed HCOOH.
Some researchers investigated how to change the oxidation state of Sn atom in tin oxides during CO2RR.27–29 Dutta et al. investigated the correlation between the oxidation state of SnO2 and its electrocatalytic activity for CO2RR at various potentials using operando Raman spectroscopy.28 SnO2 showed a high faradaic efficiency to generate HCOOH at a moderate cathodic potential, where SnO2 is thermodynamically unstable. Meanwhile, the efficiency to generate HCOOH was significantly decreased at very negative potentials, where the oxide is reduced to metallic Sn. Ning et al. reported that SnO2 grown onto a carbon cloth by a hydrothermal method was partially reduced to Sn from the bottom of SnO2, as evidenced in by XRD, in situ Raman spectroscopy and XPS measurement.27 DFT calculations show that the formation of an interface between SnO2 and metallic Sn enhanced the stability of the adsorbed HCOO− intermediate, leading to the highly selective production of HCOOH. On the other hand, there are very few reports on the difference of the reduction behaviors of tin oxide and oxyhydroxide catalysts during CO2RR.
In this study, we formed SnO, SnO2 and a tin oxyhydroxide containing amorphous and crystalline Sn3O2(OH)2 by different methods, and investigated their reduction behaviors by XRD, SEM, high-resolution TEM, STEM, and EDS mapping before and after CO2RR. We found that SnO was reduced to metallic Sn while maintaining its morphology during CO2RR; whereas SnO2 and the tin oxyhydroxide were dissolved into a neutral electrolyte solution, and then formed metallic Sn nanoparticles of ∼40 nm diameter on the electrodes by reductive deposition from dissolved Sn cations.
Experimental
Preparation of catalysts
In this study, three types of tin oxides or oxyhydroxides were prepared by different methods; SG-, P- and ST-SNO were prepared by sol–gel, precipitation, and solvothermal methods, respectively.In the case of SG-SNO, SnCl2·2H2O (Fujifilm Wako Pure Chemical Corp. 97.0%) and citric acid monohydrate (Fujifilm Wako Pure Chemical Corp. 99.5%) were dissolved in ion-exchanged water. The molar ratio of SnCl2/(citric acid) was 0.5. The solution was stirred at 363 K for polymerization. The obtained gel was pre-calcined at 523 K for 1 h in air, ground for 30 min in a mortar, and then calcined at 723 K for 6 h in air.
In the case of P-SNO, SnCl2·2H2O was a dissolved mixed solution of ion-exchanged water and propylene glycol (Fujifilm Wako Pure Chemical Corp. 99.0%) (1![[thin space (1/6-em)]](https://www.rsc.org/images/entities/char_2009.gif) :1 volume ratio). Diethanolamine (Tokyo Kasei Corp., 99.0%) was added to the obtained solution drop-by-drop. The obtained white solid was collected by centrifugation at 4000 rpm, and dried at 383 K for overnight.
:1 volume ratio). Diethanolamine (Tokyo Kasei Corp., 99.0%) was added to the obtained solution drop-by-drop. The obtained white solid was collected by centrifugation at 4000 rpm, and dried at 383 K for overnight.
In the case of ST-SNO, the P-SNO suspension before the centrifugation shown above was put into a batch autoclave reactor, and heated at 433 K for 3 h without stirring. After the reaction, the suspension was cooled with water, and the solid was collected by centrifugation at 4000 rpm and dried overnight at 383 K.
Characterization
The crystallinities of the as-prepared ST-, SG- and P-SNO powders and the carbon paper (CP) electrodes loading ST-, SG- and P-SNO as the working electrodes before and after CO2RR (the details of preparation of the working electrodes for XRD are described in the “Preparation of electrodes and catalysts before and after CO2RR for analysis” section) were investigated by powder X-ray diffraction (XRD; Rigaku, Ultima IV) using Cu Kα radiation with some pieces of small Cu foil as a reference. The morphology of the electrodes before and after CO2RR was investigated using a scanning electron microscope (SEM; HITACHI S-4800) operated at 5 kV. The oxidation states of the working electrodes before and after CO2RR were investigated by Sn 3d and O 2p X-ray photoelectron spectroscopy (XPS; JEOL JPS-9200) using Mg Kα radiation. The binding energy was calibrated using the C 1s peak at 285.2 eV (included contamination). The local morphology, crystallinity and chemical composition of each catalyst particle were investigated by Cs-corrected scanning and transmission electron microscope with EDS (S/TEM-EDS; Titan3 G2 60-300, FEI Co.) at 300 kV. Each electrode and sample preparation after CO2RR are shown in the section, “Preparation of electrodes and catalysts before and after CO2RR for Analysis”.Preparation of catalyst inks and electrodes
A catalyst ink was prepared as follows. ST-SNO, SG-SNO or P-SNO powder (48 mg), a commercial acetylene carbon black (AB, 32 mg, STREM Chemicals, Inc.) as the conductive support, and 5 wt% Nafion solution (160 mm3, FUJIFILM Wako Pure Chemical Corp., DE521 CS type) were dispersed into a mixed solution of ethanol and ion-exchanged water (ethanol:water volume ratio = 1:3, total volume of the mixture was 5.0 cm3). The suspension was sonicated for at least 1 h to obtain a homogenous catalyst ink. The working electrodes were prepared by drop-casting the catalyst inks onto carbon paper electrodes (CP, Toyo Tanso Co., PERMA-FOIL, 2.0 × 1.0 cm2). The amount of ink was adjusted to maintain a concentration of 1.0 mgcat cm−2 of the catalyst loading on the apparent electrode surface. The lateral and back sides of the carbon paper were covered with epoxy resin for insulation (effective area is 1.0 × 1.0 cm2).
Electrochemical activity and selectivity for CO2RR
The CO2RR activity was investigated by electrochemical measurements using a normal three-electrode H-type cell with an anion exchange membrane (AGC Engineering Co., Ltd, AMVN). ST-SNO, SG-SNO or P-SNO coated with carbon paper was used as the working electrode. A platinum foil (1.5 × 1.5 cm2) and Ag/AgCl/KCl (satd.) were used as the counter and reference electrodes, respectively. 0.1 mol dm−3 NaHCO3 solution saturated with CO2 (pH 7) was used as an electrolyte solution. The cyclic voltammograms (CVs) were obtained with a commercial potentiostat and potential programmer (Toho Technical Research Co., Ltd, Model PS-04) with a potential sweep rate of 10 mV s−1 and a constant stirring rate at 350 rpm for three cycles. The potential U was converted from the Ag/AgCl/KCl (satd.) reference scale to RHE using the following equation.| U V vs. RHE = U V vs. Ag/AgCl/KCl (satd.) + 0.199 V + 0.059 V × pH |
Constant potential measurements were carried out at −0.8 V vs. RHE for 6 h. After applying potential for 6 h, the generation of the gas component was corrected by 1.0 cm3 of a gas-tight syringe, and analyzed by a gas chromatograph with a thermal conductivity detector (Shimadzu Corp., GC-8A) and an MS-5A column through argon carrier gas. The generation of the liquid component was corrected by 50 mm−3 of a syringe, and analyzed by a high-performance liquid chromatograph with a UV detector (JASCO Corp., PU4580 and UV4075) and packed columns (Rspak KC-811 and Unifinepak C18). The faradaic efficiencies of CO, HCOOH and H2 (FECO, FEHCOOH and FEH2) were calculated from the ratio of electrons used in each reaction and that of the total electrons.
Preparation of electrodes and catalysts before and after CO2RR for analysis
Each ST-, SG- and P-SNO/CP electrode was evaluated by XRD after CVs were performed between 0.5 and −1.2 V vs. RHE with a potential sweep rate of 10 mV s−1 for 3 cycles, and following constant potential measurements at −0.8 V vs. RHE for 0.25, 0.5, 1 and 2 h. After each electrochemical measurement, the CP sheets loaded with ST-, SG- and P-SNO were rinsed with ion-exchanged water and dried in an air stream. Subsequently, the samples were investigated by XRD. Those after-constant potential measurements at −0.8 V vs. RHE for 2 h were also investigated by SEM and XPS. The ST-, SG- and P-SNO powders were scratched from the surface of the electrodes after constant potential measurement at −0.8 V vs. RHE for 2 h, and then investigated by high-resolution (S)TEM and EDS mapping.Results and discussion
Electrocatalytic activity for CO2RR
Fig. 1 shows the XRD patterns of the samples before the electrochemical reaction. ST- and SG-SNO showed XRD patterns that were attributed to tetragonal SnO and rutile SnO2, respectively. Conversely, P-SNO shows both a broad halo pattern between 30 and 50 degree and a weak pattern attributed to crystalline Sn3O2(OH)2, indicating that it was a mixture of the amorphous and crystalline oxyhydroxide phases. Therefore, ST-, SG- and P-SNO were tetragonal SnO, rutile SnO2 and a mixture of crystalline Sn3O2(OH)2 and amorphous phase, respectively. | ||
| Fig. 1 XRD patterns of (a) ST-SNO, (b) SG-SNO and (c) P-SNO powders before the electrochemical reaction. | ||
Fig. 2 shows the electrocatalytic activities of ST-, SG- and P-SNO, together with that of a metallic Sn electrode formed by electrodeposition (details of the electrodeposition is shown in the ESI†). From the CV measurements shown in Fig. 2a, ST-, SG- and P-SNO showed large redox peaks attributed to the reduction and oxidation of the Sn cation/Sn metal at −0.6–0.4 V vs. RHE, whereas the electrodeposited Sn electrode showed small ones (black dash line in the inset figure). In all samples, the reduction current densities were observed at approximately below −0.6 V vs. RHE. The onset potentials and reduction current densities of ST-, SG- and P-SNO were higher than those of metallic Sn, suggesting that the electrocatalytic activities for the reduction reactions on the oxides and oxyhydroxide were higher than that of metallic Sn. From time courses of the current density at −0.8 V vs. RHE (Fig. 2b), the reduction current densities of ST-SNO and metallic Sn showed almost constant values from the initial stage of CO2RR, whereas those of SG- and P-SNO changed at the initial stage and became constant after 1 h. The time required for the current density to stabilize was observed to be shorter for SG-SNO compared to P-SNO. The saturated current density of SG-SNO at more than 2 h was comparable to that of P-SNO. Fig. 2c shows the amounts of electrons used in the reduction reactions, and the faradaic efficiency of all samples at −0.8 V vs. RHE for 6 h. The amounts of electrons involved in the reduction reactions on SG-SNO and P-SNO were clearly greater than that on ST-SNO and metallic Sn. Meanwhile, the faradaic efficiencies for CO2RR (FECO + FEHCOOH) on ST-, SG- and P-SNO were much higher than that on metallic Sn. Furthermore, FEH2 on P-SNO was lowest among them, and the total of FECO and FEHCOOH was >90%. The FEHCOOH on P-SNO was comparable to that on ST-SNO (∼55%), and greater than those of SG-SNO and metallic Sn. These results were in agreement with the previous report.7
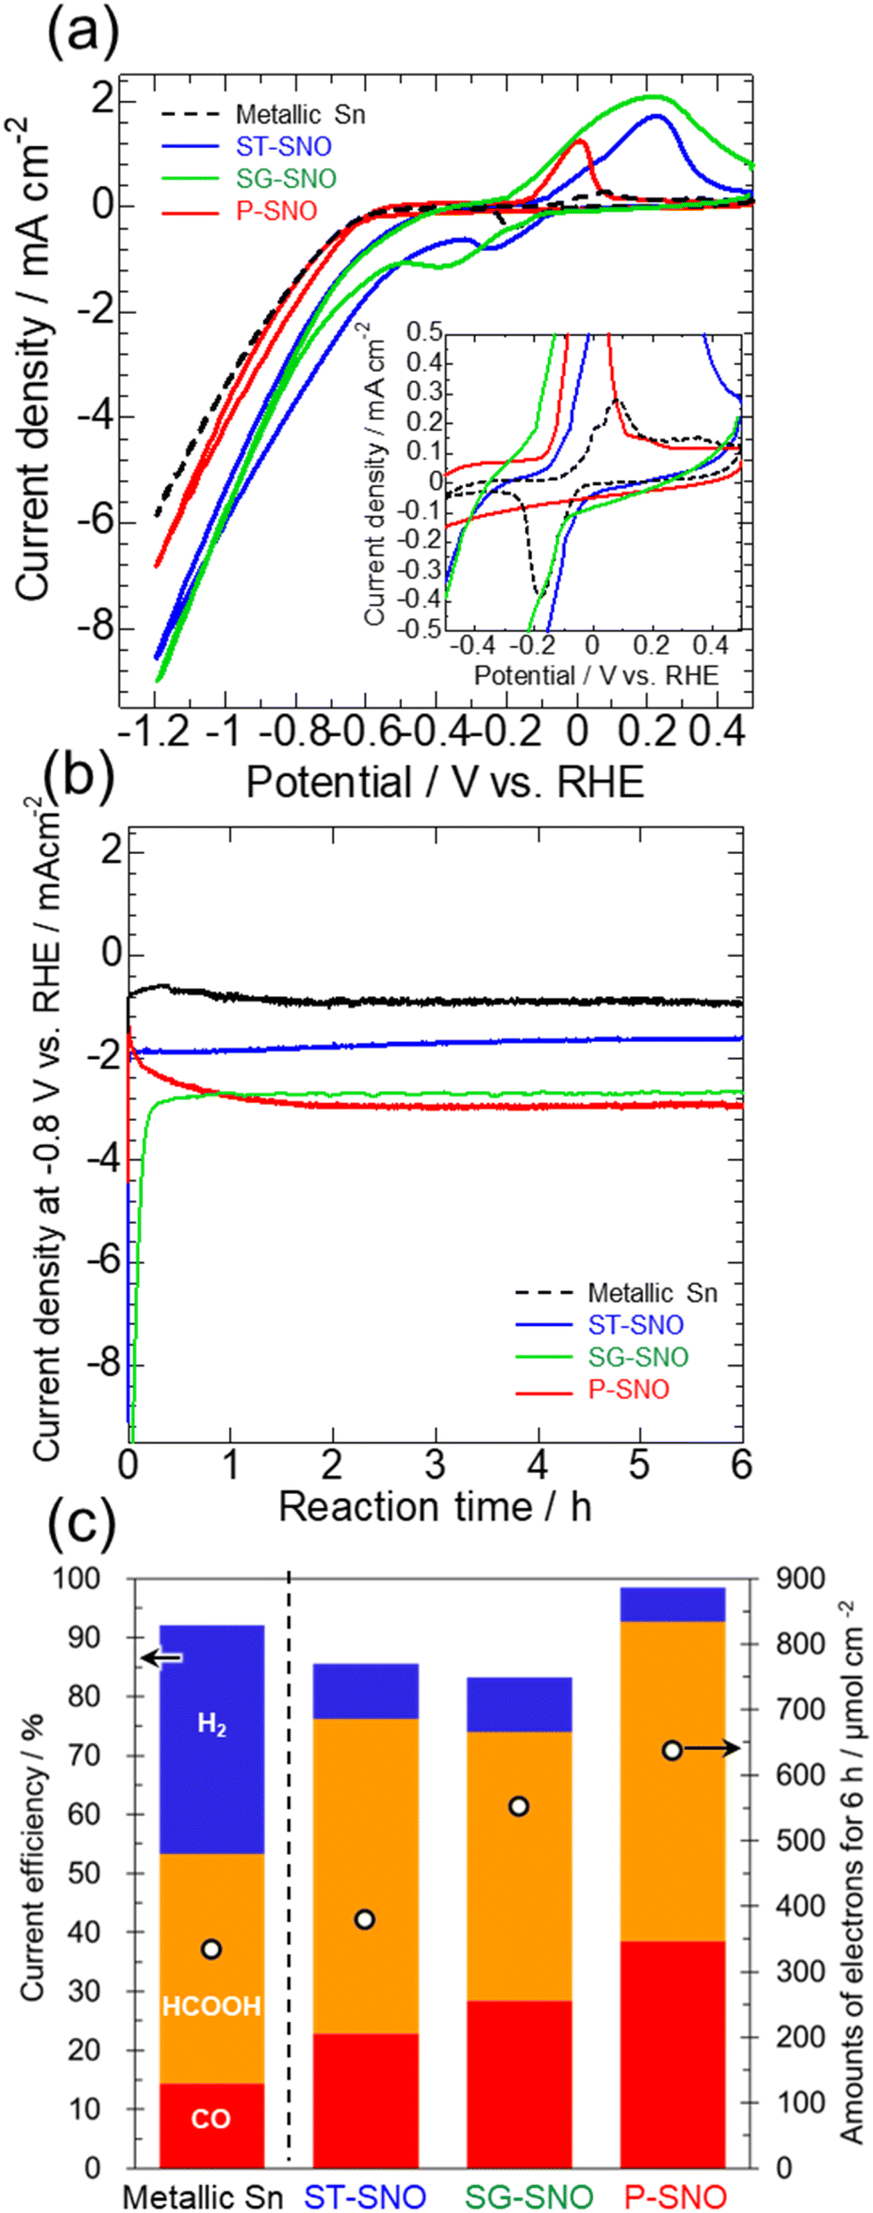 | ||
| Fig. 2 (a) Cyclic voltammograms, (b) time courses of current densities at −0.8 V vs. RHE for 6 h, and (c) the amounts of electrons used for the reduction reaction and current efficiency to form each product at −0.8 V vs. RHE for 6 h of ST-, SG- and P-SNO measured in CO2-saturated NaHCO3 aqueous solution, together with those of a metallic Sn formed by the electrochemical deposition. The inset figure in (a) is the enlarged cyclic voltammograms between −0.5 and 0.5 V vs. RHE. | ||
Change of the crystallinity, morphology and chemical state of catalysts after CO2RR
It is well known that tin oxides are reduced during CO2RR.6,7,27 Thus, methods for how to change ST-, SG- and P-SNO during CO2RR in various conditions were investigated. Fig. 3 shows the XRD patterns of all samples after 3 cycles of CV between 0.5 V to 1.2 V vs. RHE with a potential sweep rate of 10 mV s−1 and following constant potential measurements at −0.8 V vs. RHE for 0.25, 0.5, 1 and 2 h, respectively. In the case of ST-SNO, the strong pattern of metallic Sn was detected just after CV cycles with a small pattern from the retained tetragonal SnO. After more than 0.25 h of constant potential measurements, the pattern of the tetragonal SnO completely disappeared. These results indicated that ST-SNO, which is tetragonal SnO, was easily reduced to metallic Sn during CO2RR. Conversely, in the case of SG-SNO and P-SNO, only very weak patterns of metallic Sn were observed after CV cycles, together with that of SnO2. Then, the intensity of the metallic Sn pattern increased with increasing applied potential time, even though that of SG-SNO increased more rapidly than that of P-SNO. | ||
| Fig. 3 XRD patterns of (a) ST-SNO, (b) SG-SNO and (c) P-SNO loaded on carbon paper electrodes before and after CV between 0.5 and −1.2 V vs. RHE with 10 mV s−1 for 3 cycles, and constant potential measurements at −0.8 V vs. RHE for 0–2 h in CO2 saturated NaHCO3 aqueous solution. | ||
Fig. 4 shows the SEM observations of ST-, SG- and P-SNO before and after CO2RR at −0.8 V vs. RHE for 2 h. ST-SNO comprised cubic shape particles with sizes in the micron to sub-micron scales before CO2RR (Fig. 4a-1), and such cubic shapes were almost retained after the reactions (Fig. 4a-2). Conversely, SG- and P-SNO were aggregates of several micrometers in size surrounded by AB particles before CO2RR (Fig. 4b-1 and c-1). The primary particle of SG-SNO was a round shape with a diameter of 20–30 nm (inset of Fig. 4b-1), whereas that of P-SNO was an uneven shape that was smaller than 10 nm (inset of Fig. 4c-1). In both cases of SG- and P-SNO after CO2RR, similar aggregates were observed, and some holes were observed in AB layers (Fig. 4b-2 and c-2).
 | ||
| Fig. 4 SEM images of (a) ST-SNO, (b) SG-SNO and (c) P-SNO/carbon paper electrodes (1) before and (2) after constant potential measurements at −0.8 V vs. RHE for 2 h in CO2 saturated NaHCO3 aqueous solution. Inset figures in (b-1) and (c-1) are the enlarged figures of SG-SNO and P-SNO, respectively, before the reaction. | ||
To further investigate the details of the morphologies and chemical compositions of the samples after CO2RR for 2 h, at which point the current density of all samples became constant, they were characterized by high-resolution TEM and EDS mappings. From the high-resolution TEM images, the cubic shape of ST-SNO was almost retained even after CO2RR (Fig. 5a-1), as mentioned in the SEM image shown in Fig. 4a-2. Conversely, both SG-SNO and P-SNO were core–shell nanoparticles with diameters of 40 nm (Fig. 5b-1 and c-1), even though the shape of SG-SNO before CO2RR was different from that of P-SNO, which was a mixture of crystalline nanoparticles with diameters of about 5 nm and amorphous grains (Fig. S1†). The layer thickness of both shells was about 5 nm. The lattice fringes, which were attributed to the (200) face of metallic Sn, were observed in the inner parts of SG-SNO and P-SNO, whereas no lattice fringe was observed in the outer parts, suggesting that the outer parts were amorphous (Fig. 5b-2 and c-2). From EDS mappings (Fig. 5a-3–c-3), the inner parts of all samples after CO2RR were metallic Sn. Meanwhile, the outer parts, which may be oxidized in air after CO2RR, were tin oxide. In all samples, the molar ratio of Sn/O of the outer oxide layer was about 1, suggesting that the average oxidation state of Sn in the outer layer was divalent.
 | ||
| Fig. 5 (1 and 2) HR-TEM images and (3) EDS mappings of (a) ST-SNO, (b) SG-SNO and (c) P-SNO/carbon paper electrodes after constant potential measurements at −0.8 V vs. RHE for 0–2 h in CO2 saturated NaHCO3 aqueous solution. | ||
Fig. 6 shows the XPS spectra of ST-, SG- and P-SNO after CO2RR. From the Sn 3d spectra. All samples contained metallic and cationic Sn species after CO2RR, whereas those samples contained cationic Sn before CO2RR (Fig. S2†). These results were consistent with the HR-TEM and EDS mappings, as shown in Fig. 5. The molar ratios of Snn+/Sn0 at ST-, SG- and P-SNO were 8.3, 7.7 and 16.7, suggesting that the thickness of the outer layer of P-SNO was greater than those of ST-SNO and SG-SNO. Conversely, from the O 2p spectra, all spectra were deconvoluted to four peaks assigned to the lattice O, OH species, adsorbed H2O, and oxygen of Nafion. The molar ratios of the OH species to the lattice oxygen of ST-, SG- and P-SNO were 0.35, 0.44 and 0.39, respectively. These results suggest that the amount of OH species containing in the oxide layer, which is speculated to form by oxidation of the metallic Sn surfaces in air, and was almost comparable among all samples.
 | ||
| Fig. 6 XPS spectra of Sn3d and O2p of (a) ST-SNO, (b) SG-SNO and (c) P-SNO/carbon paper electrodes after constant potential measurements at −0.8 V vs. RHE for 0–2 h in CO2 saturated NaHCO3 aqueous solution. | ||
Reduction behaviors of tin oxides and oxyhydroxides during CO2RR
Fig. 7 shows a schematic illustration of how to reduce ST-, SG- and P-SNO to metallic Sn. In the case of ST-SNO, which is a tetragonal SnO formed by the solvothermal method, SnO was rapidly reduced to metallic Sn during CO2RR (Fig. 3a) and the cubic shape of SnO was almost maintained after CO2RR (Fig. 4a and 5a). It is well known that the SnO phase is thermodynamically more unstable than the SnO2 phase. In addition, from chemical composition analysis, ST-SNO had some oxygen vacancies and the chemical composition of ST-SNO was SnO0.81. Therefore, it is speculated that the unstable phase induced by Sn2+ and the oxygen vacancies promote the rapid reduction itself to the metallic phase during CO2RR. These results indicate that the tetragonal SnO phase was directly reduced to metallic Sn phase at −0.8 V vs. RHE (Fig. 7a). Conversely, in the case of both SG-SNO and P-SNO, which were SnO2 and a mixture of amorphous tin oxyhydroxide and crystalline Sn3O2(OH)2, respectively, they were gradually reduced to the metallic Sn phase (Fig. 3b and c). Furthermore, both particles had a round shape with the diameter of ∼40 nm, even though the shape of SnO2 was different from that of the amorphous oxyhydroxide before CO2RR (Fig. 4b, c and 5b, c). In addition, when ultrasmall particles of SnO2 with diameters of less than 5 nm (Fig. S3†) synthesized by reverse micelle deposition30 and solvothermal method (the details are shown in the ESI†) were reduced at −0.8 V vs. RHE for 2 h, similar round shape particles were formed (Fig. S4†). These results suggest that almost the same round shape metallic Sn particles were formed on SnO2 during CO2RR by a different reduction mechanism from SnO, which almost maintained the shape of the particles even after CO2RR. It is speculated that SnO2 and oxyhydroxides were first dissolved into the electrolyte solution at pH 7 during CO2RR. Then, the Sn cation was reduced to the metallic phase and formed round shape nanoparticles on the electrodes. | ||
| Fig. 7 Schematics of the reduction behaviors of (a) SnO and (b) tin oxyhydroxide or SnO2 during the CO2RR. | ||
These findings open up a new way towards improving the electrocatalytic activity of tin oxides and oxyhydroxides for CO2RR. For example, improving the activity by the formation of nanostructures, such as nanoparticles, nanofibers, and nanosheet, is maybe more useful for tetragonal SnO, not SnO2 and tin oxyhydroxides. It is also important to investigate the reduction behaviors to improve the catalytic activity of other metal oxides and oxyhydroxides catalysts for CO2RR.
Correlation between reduced catalysts and electrocatalytic activity for CO2RR
The time courses of the current densities of ST-, SG- and P-SNO are consistent with their reduction rates. ST-SNO was rapidly reduced to metallic Sn during CO2RR (Fig. 3a) without changing the morphology (Fig. 4a). Consequently, the current density was constant at −0.8 V vs. RHE despite the initial stage of CO2RR (Fig. 2b). In contrast, SG- and P-SNO were dissolved and reduced to the metallic phase, and the reduction rate of SG-SNO was faster than that of P-SNO (Fig. 3b and c). The current densities of both SG- and P-SNO changed during the initial stage of CO2RR (Fig. 2b). The time required for the current density to stabilize was shorter for SG-SNO (∼0.25 h) compared to P-SNO (∼2 h), reflecting the relatively fast reduction rate of SG-SNO. As mentioned above, the current densities of SG- and P-SNO changed during the initial stage of CO2RR, whereas that of ST-SNO was nearly constant (Fig. 2b). This is because the morphology of the SG- and P-SNO changed during CO2RR (Fig. 4b, c and 5b, c), leading to an increase or decrease of the effective surface areas (ECSA) of the electrocatalysts. Conversely, ST-SNO maintained its morphology due to the rapid reduction to Sn metal (Fig. 4a and 5a). The current density and total amount of electrons used in CO2RR and HER of P-SNO was almost the same as those of SG-SNO (Fig. 2b and c) and higher than that of ST-SNO. One of the possible reasons is that the particle size of SG- and P-SNO after reduction was almost the same and smaller than that of ST-SNO, leading to a higher ECSA of both electrocatalysts.Selectivity of P-SNO for CO2RR was higher than those of the others. It is well known that surface hydroxyls play an important role due to the formation of an intermediate, such as *OCHO by not only experimental analysis such as ATR-IR8,23 but also DFT calculations.31,32 From O 2p XPS spectra of the samples after CO2RR shown in Fig. 6, the amounts of hydroxyls of P-SNO were not clearly higher than those of ST- and SG-SNO. However, molar ratio of Snn+/Sn0 of the former one was higher than those of the latter ones (Sn 3d spectra shown in Fig. 6), suggesting that the native oxide layer formed on the metallic Sn nanoparticles at P-SNO is thicker than those of ST- and SG-SNO. These results suggested that the surface of the metallic Sn nanoparticles formed from P-SNO was more easily oxidized than those from ST- and SG-SNO, leading to the rapid formation of an interface between SnOx and metallic Sn, which acts as the active site for CO2RR.6,27 Additionally, selectivity for HCOOH formation at −0.8 V vs. RHE on ST- and P-SNO, which were mainly composed of Sn3O2(OH)2 and SnO, were higher than that of SG-SNO, which consisted of SnO2 (Fig. 2c). In the previous report, Baruh et al. suggested that the Sn2+ species on Sn showed higher activity for HCOOH formation compared to Sn4+ on Sn. Furthermore, it is difficult for Sn4+ to reduce to Sn2+ at −0.788 V vs. RHE.7 Therefore, it is speculated that the amount of Sn2+ species in ST- and P-SNO at −0.8 V vs. RHE was higher than that in SG-SNO, leading to higher selectivity for HCOOH formation.
Conclusions
SnO, SnO2 and a mixture of amorphous tin oxyhydroxide and a small amount of crystalline Sn3O2(OH)2 were formed by various methods. SnO2 and the oxyhydroxides showed higher reduction current density than SnO. Furthermore, the faradaic efficiency of the oxyhydroxide for the formation of HCOOH and CO was more than 90%. SnO was reduced to metallic Sn particles, while maintaining the sub-micron scale cubic shape during CO2RR. Conversely, both SnO2 and the oxyhydroxide were dissolved into the electric solution at pH 7, and reduced and electrodeposited as metallic Sn nanoparticles with a diameter of ∼40 nm on the electrode. Therefore, highly effective surface areas of metallic Sn nanoparticles were formed from SnO2 and the oxyhydroxide, which was induced to higher current density than SnO. On the other hand, it is speculated that the oxide layer was easily formed on the surface of metallic Sn from the oxyhydroxide compared to SnO and SnO2, leading to higher selectivity for CO2RR.Data availability
All the data supporting this article have been included in the manuscript in the form of figures and part of the ESI.†Author contributions
E. Tsuji was a supervisor, and contributed to the concept of this study, and writing the manuscript. K. Ohwan, T. Ishikawa, Y. Hirata and H. Okada measured and analyzed the data, and revised the manuscript. S. Suganuma and N. Katada were co-supervisors, and discussed the data and reviewed the manuscript.Conflicts of interest
There are no conflicts to declare.Acknowledgements
The authors thank Prof. Horoyuki Usui of Tottori University and Dr Toshiyuki Tanaka of Tottori Institute of Industrial Technology for the oxygen vacancy analysis of SnO. A part of this study was supported by JSPS KAKENHI Grant Number 23K23437, JSPS Fellows Grant Number 24KJ1706, JKA, and its promotion funds from KEIRIN RACE and the Joint Usage/Research Center for Catalysis (Proposal # 23DS0350 and 23DS0488). In addition, some of this work was conducted at the Institute for Molecular Science, supported by “Advanced Research Infrastructure for Materials and Nanotechnology in Japan (ARIM)” of the Ministry of Education, Culture, Sports, Science and Technology (MEXT) (Proposal Number JPMXP1223HK0115), and at the Research Center for Ultra-High Voltage Electron Microscopy (Nanotechnology Open Facilities) in Hokkaido University and Tottori University International Platform for Dryland Research and Education (IPDRE) Research Projects, Japan.References
- T. R. Karl and K. E. Trenberth, Science, 2023, 302, 1719–1723 CrossRef PubMed.
- S. S. A. Shah, M. S. Javed, T. Najam, C. Molochas, N. A. Khan, M. A. Nazri, M. Xu, P. Tsiakaras and S.-J. Bao, Coord. Chem. Rev., 2022, 471, 214716 CrossRef CAS.
- S. Zhao, S. Li, T. Guo, S. Zhang, J. Wang, Y. Wu and Y. Chen, Nano-Micro Lett., 2019, 11, 62 CrossRef PubMed.
- M. L. J. Peerlings, K. Han, A. Longo, K. H. Helfferich, M. Ghiasi, P. E. Jongh and P. Ngene, ACS Catal., 2024, 14, 10701–10711 CrossRef CAS PubMed.
- Q. Li, J. Fu, W. Zhu, Z. Chen, B. Shen, L. Wu, Z. Xi, T. Wang, G. Lu, J. Zhu and S. Sun, J. Am. Chem. Soc., 2017, 139, 4290–4293 CrossRef CAS PubMed.
- Y. Chen and M. W. Kanan, J. Am. Chem. Soc., 2012, 134, 1986–1989 CrossRef CAS PubMed.
- M. F. Baruh, J. E. Pander III, J. L. White and A. B. Bocarsly, ACS Catal., 2015, 5, 3148–3156 CrossRef.
- J. Li, J. Li, X. Liu, J. Chen, P. Tian, S. dai, M. Zhu and Y.-F. Han, Appl. Catal., B, 2021, 298, 120581 CrossRef CAS.
- F. C. Romeiro, A. S. Martins, J. A. L. Perini, B. C. Silva, M. V. B. Zanoni and M. O. Orlandi, J. Mater. Sci., 2023, 58, 3508–3519 CrossRef CAS.
- S. Zhang, P. Kang and T. J. Meyer, J. Am. Chem. Soc., 2014, 136, 1734–1737 CrossRef CAS PubMed.
- Y. Zhu, P. Li, X. Yang, M. Wang, Y. Zhang, P. Gao, Q. Huang, Y. Wei, X. Yang, D. Wang, Y. Shen and M. Wang, Adv. Energy Mater., 2023, 13, 2204143 CrossRef CAS.
- X. Zhou, J. Shan, L. Chen, B. Y. Xia, T. Ling, J. Duan, Y. Jiao, Y. Zheng and S.-Z. Qiao, J. Am. Chem. Soc., 2022, 144, 2079–2084 CrossRef CAS PubMed.
- H. Guzmán, F. Salomone, S. Bensaid, M. Castellino, N. Russo and S. Hernández, ACS Appl. Mater. Interfaces, 2022, 14, 517–530 CrossRef PubMed.
- K. A. Adegoke, R. O. Adegoke, A. O. Ibrahim, S. A. Adegoke and O. S. Bello, Sustainable Mater. Technol., 2020, 25, e002000 Search PubMed.
- X. Zhou, J. Shan, L. Chen, B. Y. Xia, J. Duan, Y. Jiao, Y. Zheng and S.-Z. Qiao, J. Am. Chem. Soc., 2022, 144, 2079–2084 CrossRef CAS PubMed.
- Z. Li, R. M. Yadav, L. Sun, T. Zhang, J. Zhang, P. M. Ajayan and ad J. Wu, Appl. Catal., A, 2020, 606, 117829 CrossRef CAS.
- J. Zhao, S. Xue, J. Barber, Y. Zhou, J. Meng and X. Ke, J. Mater. Chem. A, 2020, 8, 4700–4734 RSC.
- J. Chen, T. Wang, Z. Li, B. Yang, Q. Zhang, L. Le and P. Feng, Nano Res., 2021, 14, 3188–3207 CrossRef CAS.
- V. S. K. Yadav, Y. Noh, H. Han and W. B. Kim, Catal. Today, 2018, 303, 276–281 CrossRef CAS.
- J. He, K. E. Dettelbach, A. Huang and C. P. Berlinguette, Angew. Chem., Int. Ed., 2017, 56, 16579–16582 CrossRef CAS PubMed.
- X. Zheng, Y. Ji, J. Tang, J. Wang, B. Liu, P.-G. Steinrück, K. Lim, Y. Li, M. F. Toney, K. Chan and Y. Cui, Nat. Catal., 2018, 2, 55–61 CrossRef.
- X. Hou, Y. Cai, D. Zhang, L. Li, X. Zhang, Z. Zhu, L. Peng, Y. Liu and J. Qiao, J. Mater. Chem. A, 2019, 7, 3197–3205 RSC.
- W. Deng, L. Zhang, L. Li, S. Chen, C. Hu, Z.-J. Zhao, T. Wang and J. Gong, J. Am. Chem. Soc., 2019, 141, 2911–2915 CrossRef CAS PubMed.
- F. Li, L. Chen, M. Xue, T. Williams, Y. Zhang, D. R. MacFarlane and J. Zhang, Nano Energy, 2017, 31, 270–277 CrossRef CAS.
- J. He, X. Liu, H. Liu, Z. Zhao, Y. Ding and J. Luo, J. Catal., 2018, 364, 125–130 CrossRef CAS.
- A. Zhang, R. He, H. Li, Y. Chen, T. Kong, K. Li, H. Ju, J. Zhu, W. Zhu and J. Zeng, Angew. Chem., Int. Ed., 2018, 57, 10954–10958 CrossRef CAS PubMed.
- S. Ning, J. Wang, D. Xiang, S. Huang, W. Chen, S. Chen and X. Kang, J. Catal., 2021, 399, 67–74 CrossRef CAS.
- A. Dutta, A. Kuzume, M. Rahaman, S. Vesztergom and P. Broekmann, ACS Catal., 2015, 5, 7498–7502 CrossRef CAS.
- A. Dutta, A. Kuzume, V. Kaliginedi, M. Rahaman, I. Sinev, M. Ahmadi, B. R. Cuenya, S. Vesztergon and P. Broekmann, Nano Energy, 2018, 53, 828–840 CrossRef CAS.
- E. Tsuji, R. Nanbu, Y. Degami, K. Hirao, T. Watanabe, N. Matsumoto, S. Suganuma and N. Katada, Part. Part. Syst. Charact., 2020, 37, 2000053 CrossRef CAS.
- C. Cui, J. Han, X. Zhu, X. Liu, H. Wang, D. Mei and Q. Ge, J. Catal., 2016, 343, 257–265 CrossRef CAS.
- Z. Liu, J. Chen, H. Guo and X. Huang, Nano Energy, 2023, 108, 108193 CrossRef CAS.
Footnote |
| † Electronic supplementary information (ESI) available. See DOI: https://doi.org/10.1039/d4su00476k |
| This journal is © The Royal Society of Chemistry 2025 |