
 Open Access Article
 This Open Access Article is licensed under a
 Creative Commons Attribution 3.0 Unported Licence
Environmentally friendly regeneration of graphite from spent lithium-ion batteries for sustainable anode material reuse†
Subramanian
Natarajan
 *ab,
Tomotaro
Mae
a,
Heng Yi
Teah
bc,
Hiroki
Sakurai
a and
Suguru
Noda
*ab
*ab,
Tomotaro
Mae
a,
Heng Yi
Teah
bc,
Hiroki
Sakurai
a and
Suguru
Noda
*ab
aDepartment of Applied Chemistry, Waseda University, 3-4-1 Okubo, Shinjuku-ku, Tokyo 169-8555, Japan. E-mail: natarajan@aoni.waseda.jp; smnatarajan90@gmail.com
bWaseda Research Institute for Science and Engineering, Waseda University, 3-4-1 Okubo, Shinjuku-ku, Tokyo 169-8555, Japan. E-mail: noda@waseda@jp
cPresidential Endowed Chair for “Platinum Society”, The University of Tokyo, 7-3-1, Hongo, Bunkyo-ku, Tokyo 113-8656, Japan
First published on 17th January 2025
Abstract
The graphite industry is currently facing significant supply and demand issues owing to the sudden rise in electric vehicle (EV) usage; however, the lithium-ion batteries (LIB) that power such vehicles will be landfilled or incinerated at the end of their lifetime, raising questions concerning their environmental impact and resource reuse. The recycling of spent LIBs using economical and environmentally sustainable technologies is therefore required. We therefore employ three different strategies to regenerate graphite from spent LIBs as an anode material in new LIBs. Acid (Gr-AcOH), alkali (Gr-KOH), and gas (Gr-N2) treatments are used to reconstruct the structure of the spent graphite, which is then evaluated as an anode material in a half-cell configuration. The graphite regenerated by the Gr-AcOH, Gr-KOH, and Gr-N2 techniques exhibit delithiation capacities of 328, 325, and 338 mA h ggr−1, respectively, after 150 cycles, with a coulombic efficiency of ∼99.9%. These delithiation capacities are considerably higher than that of untreated spent graphite (120 mA h ggr−1, where ‘gr’ in the subscript stands for graphite) and close to that of commercial graphite (345 mA h ggr−1). Additionally, our life cycle assessment estimates the impact of graphite regeneration ranges from 0.27 to 3.53 kg CO2e per kg graphite, assuming a pilot-scale operation using 100 kg graphite operation. This study demonstrates the suitability of environmentally sustainable graphite recycling for LIB applications, and the implementation of circular approaches for battery anode recycling.
1. Introduction
The unique characteristics of Li-ion batteries (LIB), such as their long-life span and high energy density characteristics, have contributed to their global popularity and have cemented their position as the foremost power source for various applications from portable electronics to electric vehicles.1–3 LIBs remain the most widespread power source in consumer electronic products and electric vehicles even after 20–25 years.4,5 The annual demand for LIBs has reached 700 GWh and it is expected to climb to an unprecedented 4.7 TWh by 2030.6 LIBs typically comprise Li-based cathodes (LiCoO2, LiMn2O4, LiNixMnyCozO2, LiNixCoyAlzO2, LiFePO4), anode (graphite), electrolyte (LiPF6 in organic solvents), and separator (polypropylene or polyethylene).7 The Li-based cathode is the key component of LIBs; however, the cost of such cathodes is increasing owing to the soaring price of metals such as Li, Co, Ni, and Mn.8,9 Graphite is the most common anode material in commercial LIBs owing to its modest theoretical capacity (372 mA h g−1), lower working potential (<0.1 V vs. Li), and low cost.10 However, the graphite industry has seen significantly increased demand in the last few years owing to the rapid universalization of electric vehicles and portable electronics.11,12 For instance, the graphite market was estimated at $14.83 billion in 2021 and is predicted to grow to $25.70 billion by 2028.13LIBs most commonly employ natural and synthetic graphite as anode materials. The battery sector used 0.4 megatons (Mt) of natural graphite in 2021, which is expected to increase to 3 Mt by 2030. Similarly, the consumption of synthetic graphite is expected to increase to 1.5 Mt by 2030 from just 0.3 Mt in 2021 according to the world's top critical material analyst. Both natural and synthetic graphite possess a polycrystalline structure; however, the crystal orientation of the structures differ. Natural graphite particles adopt a “flake-like” structure while synthetic graphite particles are irregularly shaped; thus, both natural and synthetic graphite require mechanical treatment to form a spherical/spheroidal shape after the mining process, which improves the volumetric capacity of the electrode material by homogenizing the particle size and morphology.12 The performance decay of spent graphite anodes in lithium-ion batteries is primarily due to the formation of a thick, resistive solid electrolyte interphase (SEI), deposition of inactive lithium compounds, and structural degradation of the graphite material. Additionally, electrolyte decomposition and transition metal leaching from the cathode can further exacerbate the decline in performance. These changes lead to increased resistance, reduced capacity, and overall diminished efficiency in the anodes.12 Recycling of the anode is not as economically viable as recycling the highly valuable metals contained in the cathode owing to the low cost of graphite.11,14 Despite being more costly than natural graphite, synthetic graphite is preferred as an anode material owing to its high purity; however, natural graphite is designated as a critical material by the European Union.11,12
Moreover, this type of graphite material (∼21%) can be obtained from spent LIBs; however, it must be recovered after cycling and reused effectively. The reuse of spent graphite could reduce the cost of fresh graphite ($8–13/kg), which currently accounts for ∼10–15% of the material costs of commercial LIBs.15–17 The anode material from spent LIBs has been regenerated at the lab scale using various techniques. For example, Wang et al. pulverized graphite from spent LIBs and purified the resulting powder using 5 M sulfuric acid with hydrogen peroxide without any separation. The regenerated graphite exhibited a delithiation capacity of ∼377 mA h g−1 at 0.1C.17 Cao et al. electrolytically separated the Cu current collector and graphite anode by adjusting various parameters such as voltage and electrolyte concentration to afford regenerated graphite with a delithiation capacity of ∼374 mA h g−1 at 0.2C after 100 cycles.18 Similarly, graphite can also be purified by alkaline-acidic treatment followed by heat treatment at 2600 °C, achieving an initial delithiation capacity of 359 mA h g−1.19
The aforementioned studies required harmful acid treatments, high temperatures, or several complex steps that limit graphite recycling. In addition, these studies fail to fully explain the graphite recycling procedures. Research has shown that organic acid treatment effectively removes surface impurities from graphite, enhancing its electrochemical performance.20 Alkali treatment using potassium hydroxide, followed by heat treatment, improves electrical conductivity and structural integrity by dissolving impurities and expanding the graphite structure.21 Additionally, thermal annealing in a nitrogen atmosphere promotes graphitization and reduces defects, further refining the material.22 Together, these methods provide a comprehensive approach to achieving high-purity graphite suitable for advanced applications. We therefore employed three regeneration techniques to purify graphite: (i) organic acid treatment with acetic acid, (ii) alkali treatment using potassium hydroxide, followed by heat treatment at 800 °C, and (iii) thermal annealing at 800 °C with N2. Electrodes were fabricated by holding the regenerated graphite materials within a three-dimensional current collector consisting of submillimeter-long few-wall carbon nanotubes (CNTs) in the absence of polymeric binder or metal foils to determine their suitability as LIB anode materials. We provide a detailed comparison of the delithiation capacities achieved through these methods, demonstrating that our regenerated materials not only surpass the performance of untreated spent graphite but also approach that of commercially available graphite. Additionally, our life cycle assessment quantifies the environmental impact of graphite regeneration, highlighting its potential for sustainable practices in the graphite industry. By addressing both performance and sustainability, our work contributes to the development of effective circular economy strategies for battery anode recycling, making significant strides toward resource reuse and environmental responsibility in the rapidly growing electric vehicle market.
2. Experimental section
2.1. Materials and reagents
Spent 18![[thin space (1/6-em)]](https://www.rsc.org/images/entities/char_2009.gif) 650 Li-ion cells were purchased from a local market in Tokyo, Japan. Single-element standard solutions of Li, Ni, Co, Mn, and Al used in inductively coupled plasma optical emission spectroscopy (ICP-OES) were purchased from Kanto Chemicals. Acetic acid (CH3COOH), isopropanol, and potassium hydroxide (KOH) were obtained from local vendors in Japan. Deionized water was used in all graphite regeneration processes.
650 Li-ion cells were purchased from a local market in Tokyo, Japan. Single-element standard solutions of Li, Ni, Co, Mn, and Al used in inductively coupled plasma optical emission spectroscopy (ICP-OES) were purchased from Kanto Chemicals. Acetic acid (CH3COOH), isopropanol, and potassium hydroxide (KOH) were obtained from local vendors in Japan. Deionized water was used in all graphite regeneration processes.
2.2. Discharging, dismantling, and recovery process
To ensure safety, LIBs were electrochemically discharged using a potentiostat to completely remove the remaining current before being dismantled manually in a dry room using protective equipment. The separated cathode, anode, and separator components were immediately stored in a glass container following dismantling. The other dismantled materials, metallic cases, and plastics were packed separately. The cathode and anode were subsequently moved to an Ar-filled glove box and washed with dimethyl carbonate to recover the organic compounds present on the electrode surface.2.3. Graphite regeneration process
The anode Cu foil with the graphite paste was separated by sonication in deionized water for 2 min. Carbon black particles floated after sonication and were thus separated from the graphite particles via filtration. After separation of the conductive carbon black additive, the graphite particles were filtered and dried at 120 °C for 2 h, and the metal content in the separated graphite (Gr-W) was determined by ICP-OES by completely digesting Gr-W in nitric acid in a microwave oven at ∼220 °C for 45 min (Table S1†). Three samples of Gr-W, containing Li (3.54 mg Li gGr-W−1), were separately subjected to acid, alkali, and gas treatments to recover Li from the Gr-W particles and reconstruct the graphite structure.:3 ratio (g mL−1) (Fig. S1†). This process recovers Li present on the graphite surface as a solid electrolyte interphase (SEI), along with that in the graphite edge sites, grain boundaries, and turbostratic structure. The acetic acid containing graphite was filtered using a polyvinylidene difluoride (PVDF) membrane filter (0.45 μm pore size) and washed with deionized water. The filtrate was analyzed by ICP-OES to confirm the recovery of Li (3.47 mgLi gGr-W−1; 98% of Li in Gr-W) from Gr-W to the filtrate (Table S1†). The graphite was then dried, and the regenerated sample (Gr-AcOH) was used in subsequent electrochemical studies.
:3 ratio (g mL−1) with stirring for 6 h. The KOH solution containing graphite was filtered through a PVDF membrane filter (45 μm). The KOH-attached graphite was separated from the filter and treated at 800 °C under N2 flow for 1 h at a flow rate of 1 L min−1. The graphite was then mixed with deionized water, filtered, and dried in an oven at 120 °C to obtain regenerated graphite (Gr-KOH) (Fig. S2†). The resulting filtrate was neutralized using an aqueous HNO3 solution (7 M) and analyzed by ICP-OES, revealing a recovery of 2.96 mgLi gGr-W−1 (83.6% of Li in Gr-W) from Gr-W to the filtrate (Table S1†). KOH treatment yielded a lower Li recovery rate than AcOH treatment because some Li remained in the KOH solution.
:3 ratio (g mL−1) (Fig. S3†) and recovered on a PVDF membrane filter. ICP-OES analysis of the filtrate confirmed the recovery of 0.51 mg Li g Gr-W−1 (14.4% of Li in Gr-W) from Gr-W to the filtrate (Table S1†). The electrochemical performance of the reconstructed graphite (Gr-N2) was then compared with that of the above samples. A schematic representation of all regeneration processes is shown in Fig. 1.
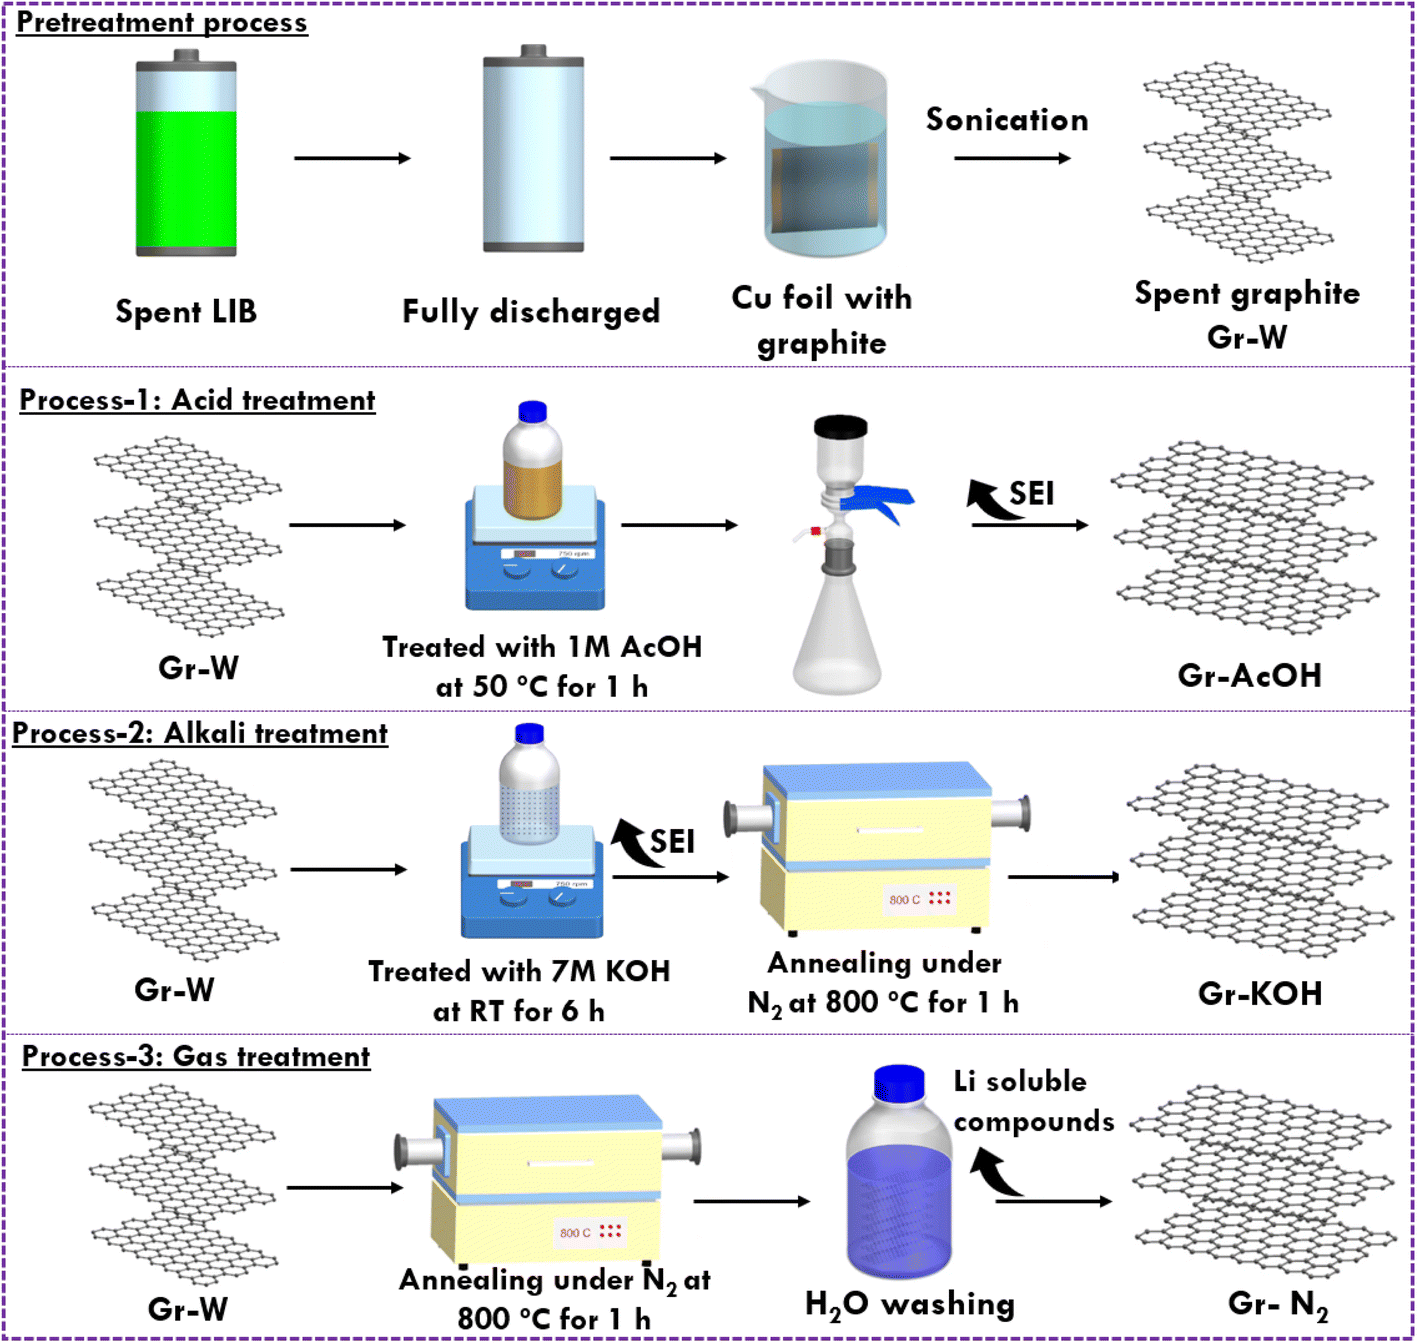 | ||
| Fig. 1 Schematic representation of the graphite regeneration process by three different techniques. | ||
2.4. Characterization
The recycled and regenerated graphite samples were characterized by X-ray diffraction (XRD, Rigaku RINT-TTRIII, Akishima, Japan) using a Cu Kα radiation source. The structural defects of the graphite samples were evaluated using micro-laser Raman spectroscopy (Renishaw, inVia Reflex, Japan) with an excitation wavelength of 532 nm. The presence of impurities was determined by ICP-OES (Agilent Technologies, Agilent 5100, Tokyo, Japan). The morphologies of the recovered and regenerated graphite samples were determined by scanning electron microscopy (SEM, Hitachi S-4800, Tokyo, Japan).2.5. Electrode preparation, fabrication, and electrochemical tests
In this study, all electrodes were initially prepared without the use of any binder or conductive additives. The self-supporting graphite-carbon nanotube (Gr-CNT)-based electrodes23 were then prepared for electrochemical tests. Subsequently, the highest-performing regenerated electrode and a commercial graphite electrode were prepared using the standard slurry method for comparison. The CNT route offers several advantages over traditional slurry deposition onto copper foil for battery applications. The CNT-based electrodes allow for the rapid evaluation of active materials using only a few milligrams of sample, which is significantly less than the several grams required by traditional slurry methods. These electrodes have proven effective with various anodes, including graphite, Si, and SiO, as well as with cathodes such as LiCoO2, LiNi0.8Co0.1Mn0.1O2, and sulfur.23–25 This efficiency in sample usage makes them a valuable tool in materials research. Graphite (∼1.3–1.4 mg) and CNT in a 97:3 ratio were added to isopropanol (60 mL) and sonicated for 15 min to achieve uniform dispersion. Electrode materials containing solution were then vacuum filtered onto a PVDF membrane filter (0.45 μm pore size) using a metal mask to achieve electrodes of the desired size (φ8 mm) as shown in Fig. S4.† The electrodes were vacuum-dried at 120 °C for 2 h. For the slurry-based method, the electrodes were prepared by first preparing the slurry of graphite: acetylene black: NMP with a mass ratio of 8:1:1 using a bead mill and N-methyl-2-pyrrolidone solvent and casting onto a Cu foil (10 μm in thickness) current collector. Coin cells (2032 type) were fabricated in an Ar-filled glove box using the CNT-based (φ8 mm with an areal loading of ∼2.6–2.8 mg cm−2 and an areal capacity of 0.9–1.0 mA h cm−2) or slurry-based (with an areal loading of ∼2.2–2.4 mg cm−2 and an areal capacity of ∼0.8 mA h cm−2) Gr working electrode, polypropylene separator (φ16 mm), and Li foil counter electrode (φ14 mm). Lithium hexafluorophosphate (LiPF6, 1 M) in a 1:1 v/v mixture of ethylene carbonate and diethyl carbonate was used as the electrolyte in all cell configurations. The cycle performance of the Gr-CNT/Li half-cells was tested using a battery tester (HJ1001SD8, Hokuto Denko, Tokyo, Japan) at 0.1C over the initial three cycles and thereafter at 0.3C over the remaining cycles with a cut-off voltage of 0.001 to 2 V. The rate performance tests were conducted using constant current (CC) at varying current densities (0.1C, 0.2C, 0.5C, 1C, and 3C), with each rate tested for 5 cycles. After that, 0.3C was used until a total of 70 cycles were completed. All the electrochemical inspections were evaluated at room temperature (20 °C).
2.6. Life cycle assessment
The environmental performance of the graphite regeneration process was evaluated using life cycle assessment (LCA),26 which quantifies the environmental impact of the activities involved in graphite regeneration, including direct emissions, material production, and energy generation. The model included goal and scope definition, inventory analysis, impact assessment, and interpretation in accordance with the ISO 14040 standard.27 The acid, alkali, and gas treatments were comparatively analyzed with the goal of supporting the environmentally sustainable development of graphite recycling and activation methods. Complete battery recycling is complex and beyond the scope of this study; thus, only the gate-to-gate system boundary from acquiring recycled graphite (after Cu foil separation) to activated graphite (before cell fabrication) was studied (Fig. S5†). The inventory of materials and electricity demands of the processes were measured using laboratory equipment. The electricity demand was then scaled from the laboratory-scale treatment capacity (1 g) to a pilot-scale operation (100 kg), the scale of which was estimated based on available similar-scale equipment (Tables S2–S4†). The indirect environmental impacts associated with upstream chemical production and electricity generation were estimated using the commercially available Ecoinvent v3.9 LCA database. The impact of the greenhouse gas (GHG) emissions was characterized using the global warming potential, (GWP, GWP100, IPCC 2021) model, in which the impact is determined by the summation of each input and output inventory multiplied by their GWP impact factors. A full set of 18 environmental indicators based on the ReCiPe 2016 method28 was further examined to avoid the potential burden shifting from GWP to other environmental impacts.3. Results and discussion
3.1. Physicochemical characterization
Fig. 1 shows the pretreatment of spent LIBs and graphite recycling using three different treatments. The structural changes and interlayer distances of the recovered graphite samples, (Gr-AcOH, Gr-KOH, and Gr-N2) were compared with those of Gr-C (commercial graphite) and Gr-W by XRD (Fig. 2a). The XRD patterns of all samples showed a strong and sharp peak indicative of the (002) plane at 2θ = 26.6°20 irrespective of the regeneration process, confirming that the structure of graphite is preserved in all processed samples including Gr-W. Moreover, no peaks related to possible impurities from the Cu current collector, PVDF binder, or conductive agent used in the commercial LIBs were observed. All graphite sample patterns exhibited a highly crystalline hexagonal phase (JCPDS No. 00-056-0159).22 The enlarged view of 2θ = 26 to 27° (Fig. 2b.) clearly showed that the graphite (002) peak is slightly shifted to 26.2° in the pattern of Gr-W relative to that in the pattern of Gr-C at 26.6°. However, the peaks of the Gr-AcOH, Gr-KOH, and Gr-N2 regenerated graphite samples, were shifted to 26.4°, 26.5°, and 26.5°, respectively. These changes are caused by the effective removal of intercalants in Gr-W during all three regeneration processes, which reduces the interlayer distance of the graphite samples and thus restores their structure. The interlayer distance in the (002) plane of all graphite samples was verified by Bragg's equation (nλ = 2dsinθ). The (002) plane of Gr-W exhibited an interlayer distance of 3.39 Å, which is slightly larger than that of Gr-C (3.34 Å), primarily owing to residual Li compounds that accumulate between the Gr-W layers during long-term cycling. The interlayer spacing in Gr-AcOH was 3.37 Å, suggesting that the acetic acid leaching process removed residual Li at 50 °C and reduced the interlayer spacing from 3.39 Å. Additionally, KOH treatment followed by an annealing process better maintained the spacing of 3.36 Å in the Gr-KOH (002) plane. In this case, Li was removed from the graphite surface after KOH activation via a washing process, and the annealing process at 800 °C further reduced the interlayer distance in the graphite sample, resulting in an identical interlayer spacing to that in pristine graphite, also the presence of defects generated during alkali etching can also play a significant role. The Gr-N2 sample without KOH activation at 800 °C retained an interlayer spacing of 3.36 Å, implying that the annealing process reconstructed the graphite structure.
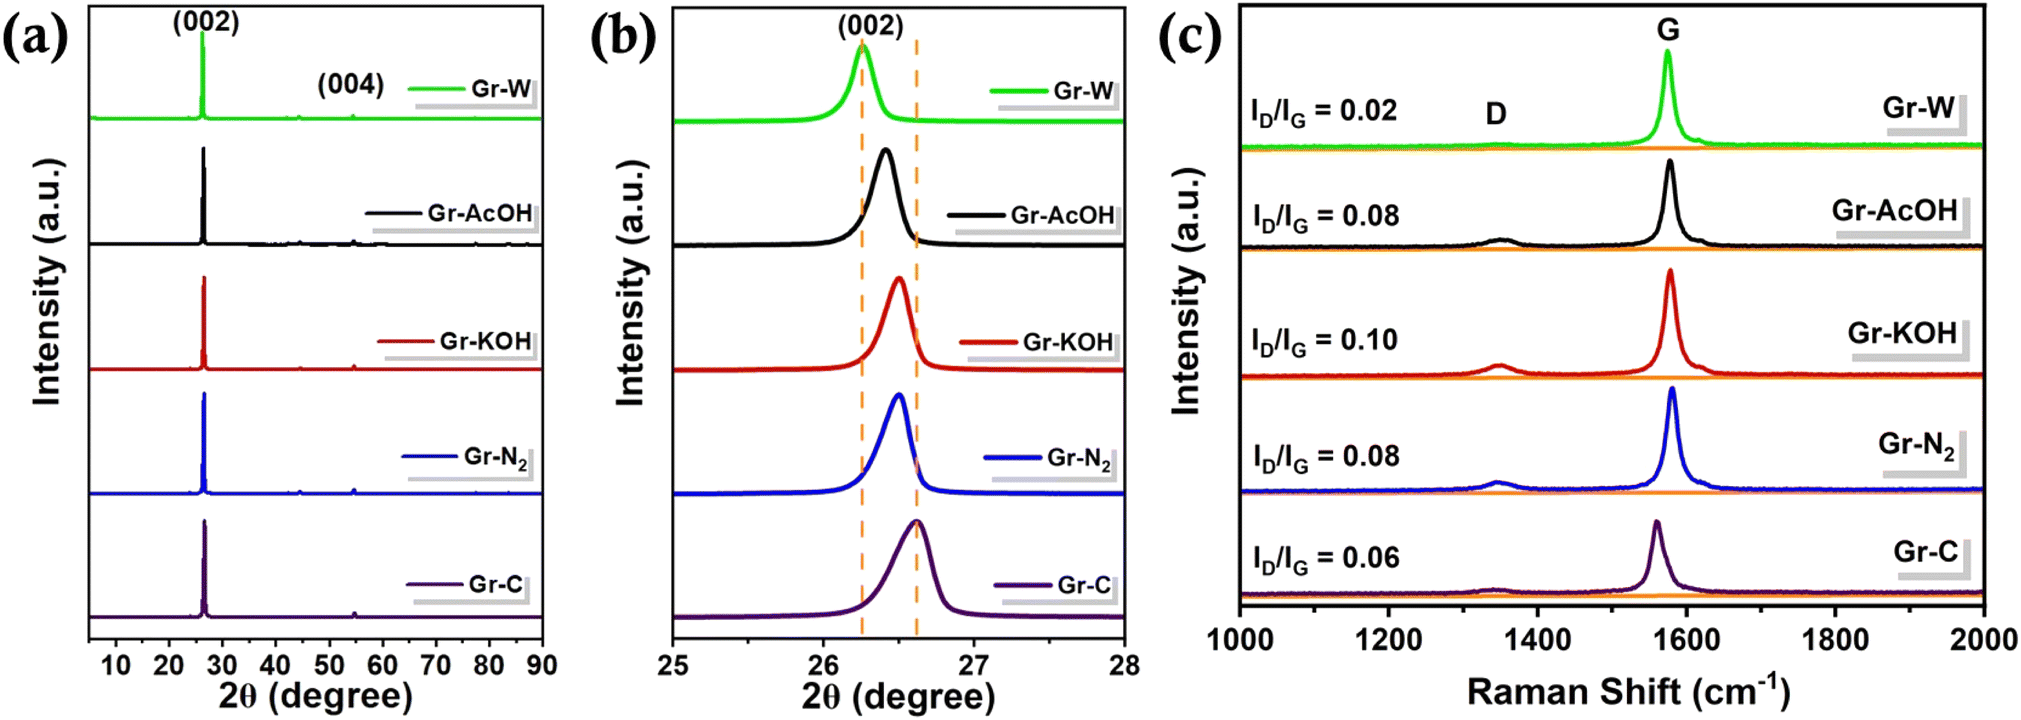 | ||
| Fig. 2 (a) XRD patterns of graphite samples, (b) magnified view of the peak corresponding to the (002) plane of graphite samples, (c) Raman spectra of the graphite samples. | ||
The graphite samples were analyzed using Raman spectroscopy to evaluate their structural quality through ID/IG ratios (Fig. 2c). The Gr-W sample, with the lowest ID/IG ratio of 0.02, indicates a high level of structural integrity and minimal disorder in each graphene layer. However, the Gr-W exhibited increased interlayer spacing as observed through XRD. These results show that the graphite before cycling had the inherent high crystallinity of battery-grade graphite, and that each graphene layer remained intact while the interlayer spacing between graphene changed due to the intercalant during cycling. In contrast, the Gr-AcOH sample, treated with 1 M acetic acid at 50 °C for 1 hour, shows a moderate ID/IG ratio of 0.08. This suggests a degree of disorder likely resulting from organic acid treatment, which primarily focuses on leaching lithium rather than significantly enhancing structural quality. The Gr-KOH sample, treated with 7 M KOH at room temperature followed by annealing at 800 °C, exhibits an ID/IG ratio of 0.10, indicating an increase in disorder in each graphene layer compared to Gr-W, likely due to the activation process. Nevertheless, it still maintains good structural quality with an interlayer spacing closed to that of bulk graphite, as evidenced by its XRD characteristics. The Gr-N2 sample, subjected to annealing at 800 °C under nitrogen for 1 hour and then washed with deionized water, shows an ID/IG ratio of 0.08, suggesting a similar level of crystallinity to Gr-AcOH and indicating effective graphitization. Lastly, the Gr-C sample, representing commercial-grade graphite, demonstrates an ID/IG ratio of 0.06, showing fewer defects compared to the regenerated samples but more defects than the sample recovered from spent LIBs possibly due to the difference in the inherent structural properties of the battery-grade graphite used in LIBs.
The influence of these three regeneration processes was further analyzed using SEM. The morphologies of Gr-W, Gr-AcOH, Gr-KOH, Gr-N2, and Gr-C are shown in Fig. 3. The Gr-W powder recovered from Cu foil by sonication (Fig. 3a) exhibits an irregular cobblestone-like morphology with particle sizes ranging from ∼5 to ∼30 μm. This morphology is similar to that of synthetic graphite, revealing that the structure does not change significantly even after numerous charge–discharge cycles. In contrast, the acetic acid leaching process formed small flakes (Fig. 3b). The image of the Gr-KOH sample (Fig. 3c) showed more bright spots on the surface of the graphite. The morphology of the Gr-N2 sample (Fig. 3d) was similar to that of Gr-W, as it was not subjected to acid or alkali treatment. Annealing did not change the morphology of graphite waste samples.
 | ||
| Fig. 3 SEM images of the (a) Gr-W (b) Gr-AcOH (c) Gr-KOH and (d) Gr-N2 (e) Gr-C samples. | ||
3.2. Mechanism of spent graphite regeneration
The SEI layer developed on the surface of the graphite electrode of LIBs during the initial charging and discharging cycles comprises a complex mixture of organic and inorganic compounds formed by the decomposition of the electrolyte, including lithium carbonate (Li2CO3), lithium alkoxide (LiOR), lithium oxide (Li2O), and other lithium salts. The recovery of Li from spent graphite, which includes an SEI layer, via three different processes is illustrated in Fig. 4 and can be explained as follows: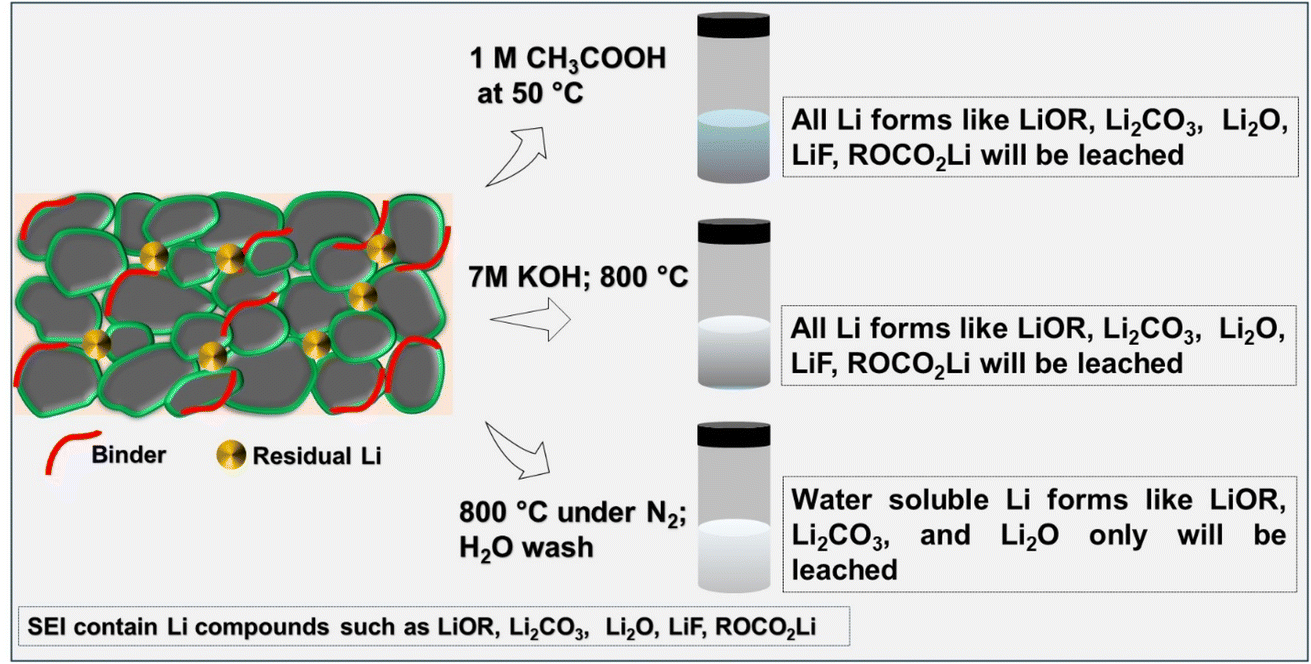 | ||
| Fig. 4 Schematic of the extraction of lithium from spent graphite using three different methods. | ||
(i) Acetic acid (CH3COOH) treatment: treatment of the graphite sample, which includes an SEI layer, with 1 M acetic acid, a weak organic acid, at 50 °C for 1 h dissolves lithium compounds in the SEI layer and in the graphite structure, forming lithium acetate complexes. The mass transfer of acetic acid and lithium acetate to and away from the graphite, respectively, is promoted by stirring, while heating enhances the solubility of the lithium compounds. Filtration through a PVDF membrane separated the dissolved lithium ions, and the graphite residue is then purified by washing with deionized water. This process yields a lithium-containing acetic acid solution that can be used in further recovery steps.29
(ii) Potassium hydroxide (KOH) treatment: the process of recovering lithium from spent graphite, including the SEI layer, involves several steps. Following initial treatment with 7 M KOH, Li ions are extracted from the graphite structure and SEI layer. Following a 6 h stirring period, filtration through a PVDF membrane separated the graphite from the KOH solution. Subsequent heating at 800 °C under N2 decomposed the organic components of the SEI and eliminates impurities. Washing with deionized water and drying completes the purification process, yielding regenerated graphite (Gr-KOH) with recovered Li. This method efficiently retrieved Li from graphite, including the SEI layer, ensuring that the material was ready for reuse.21,30
(iii) Annealing under N2 treatment: the annealing of Gr-W, which includes an SEI layer, under nitrogen gas at 800 °C initiates the thermal decomposition of organic components within the SEI layer. Subsequent mixing of the annealed graphite with deionized water in a 1:3 w/v ratio (g mL−1) facilitates the removal of soluble impurities, including residual lithium compounds. Filtration through a PVDF membrane separates the purified graphite from the solution, effectively recovering water-soluble lithium compounds and preparing graphite for reuse.31,32
Although certain lithium forms within the SEI layer are insoluble, standard methods such as acid treatment followed by thermal processing20,33 and washing effectively recover soluble lithium compounds. Specialized techniques may be required to recover insoluble compounds such as LiF to ensure complete lithium recovery from spent graphite.
3.3. Electrochemical performance of regenerated graphite samples
The Li storage capabilities of all regenerated samples were compared with those of waste and commercial graphite samples using half-cell configurations. The gravimetric capacity, expressed in mA h g−1, refers to the charge storage capacity per unit mass of the active material. The differential capacity vs. voltage (dq/dV) curves of all the graphite samples were derived (Fig. S6†) from their lithiation–delithiation profiles (Fig. S7†). The derived dq/dV plots of all graphite samples show peaks indicative of the intercalation/deintercalation of Li between the graphene layers. The decomposition of the organic electrolyte and formation of the SEI layer on the graphite surface can be identified in the plots of all samples except for the Gr-W from the plateau between 0.8 and 0.6 V (Fig. S7†) and the small peak at approximately 0.76 V (Fig. S6†).34 The plateau was not detected in consecutive cycles; however, a long plateau was observed from ∼0.2 to 0.02 V (Fig. 5a–d), which was ascribed to the intercalation of Li+ between the graphene layers.35 These results are consistent with those of the Gr-C sample (Fig. 5e). The Gr-W sample displayed a poor initial delithiation capacity of 122 mA h ggr−1 (with ‘gr’ in subscript indicating graphite) with a low coulombic efficiency of 61.9% owing to the presence of impurities after hundreds or thousands of charge/discharge cycles. Additionally, electrochemically unresponsive “Li” is retained in the active sites of Gr-W after recovery, further hindering performance. Furthermore, the leaching process with acetic acid (Gr-AcOH) eliminated impurities from the graphite, resulting in a higher initial delithiation capacity and coulombic efficiency of 370 mA h ggr−1 and 73.7%, respectively. KOH treatment of the Gr-KOH sample followed by annealing under an inert atmosphere activated the spent graphite, and increased the specific capacity of the material by developing Li intercalation sites and shortening the routes for Li diffusion pathways. As expected, the Gr-KOH sample exhibited an initial delithiation capacity of 335 mA h ggr−1 and coulombic efficiency of 76.9%. To determine the effect of the annealing treatment, spent graphite was treated at 800 °C for 1 h under the flow of N2 gas, thereby reforming the spent graphite structure (Gr-N2). Additionally, washing with deionized water after thermal treatment facilitates the removal of some water-soluble SEI components, such as Li2O, Li2CO3, and LiOR, from graphite, thereby eliminating impurities and reconstructing the graphite structure. For instance, extraction of Li from the SEI passivation layer occurs via the reaction of Li2O with water: Li2O + H2O → 2LiOH.36 This thermal treatment and washing of the Gr-N2 sample resulted in an initial delithiation capacity and coulombic efficiency of 343 mA h ggr−1 and 74.2%, respectively. The capacities of the regenerated samples differed based on the efficiency of Li removal by the regeneration techniques. In addition to the Li present in the SEI, that trapped on the graphite edge sites, grain boundaries, and turbostratic structure should also be removed efficiently.22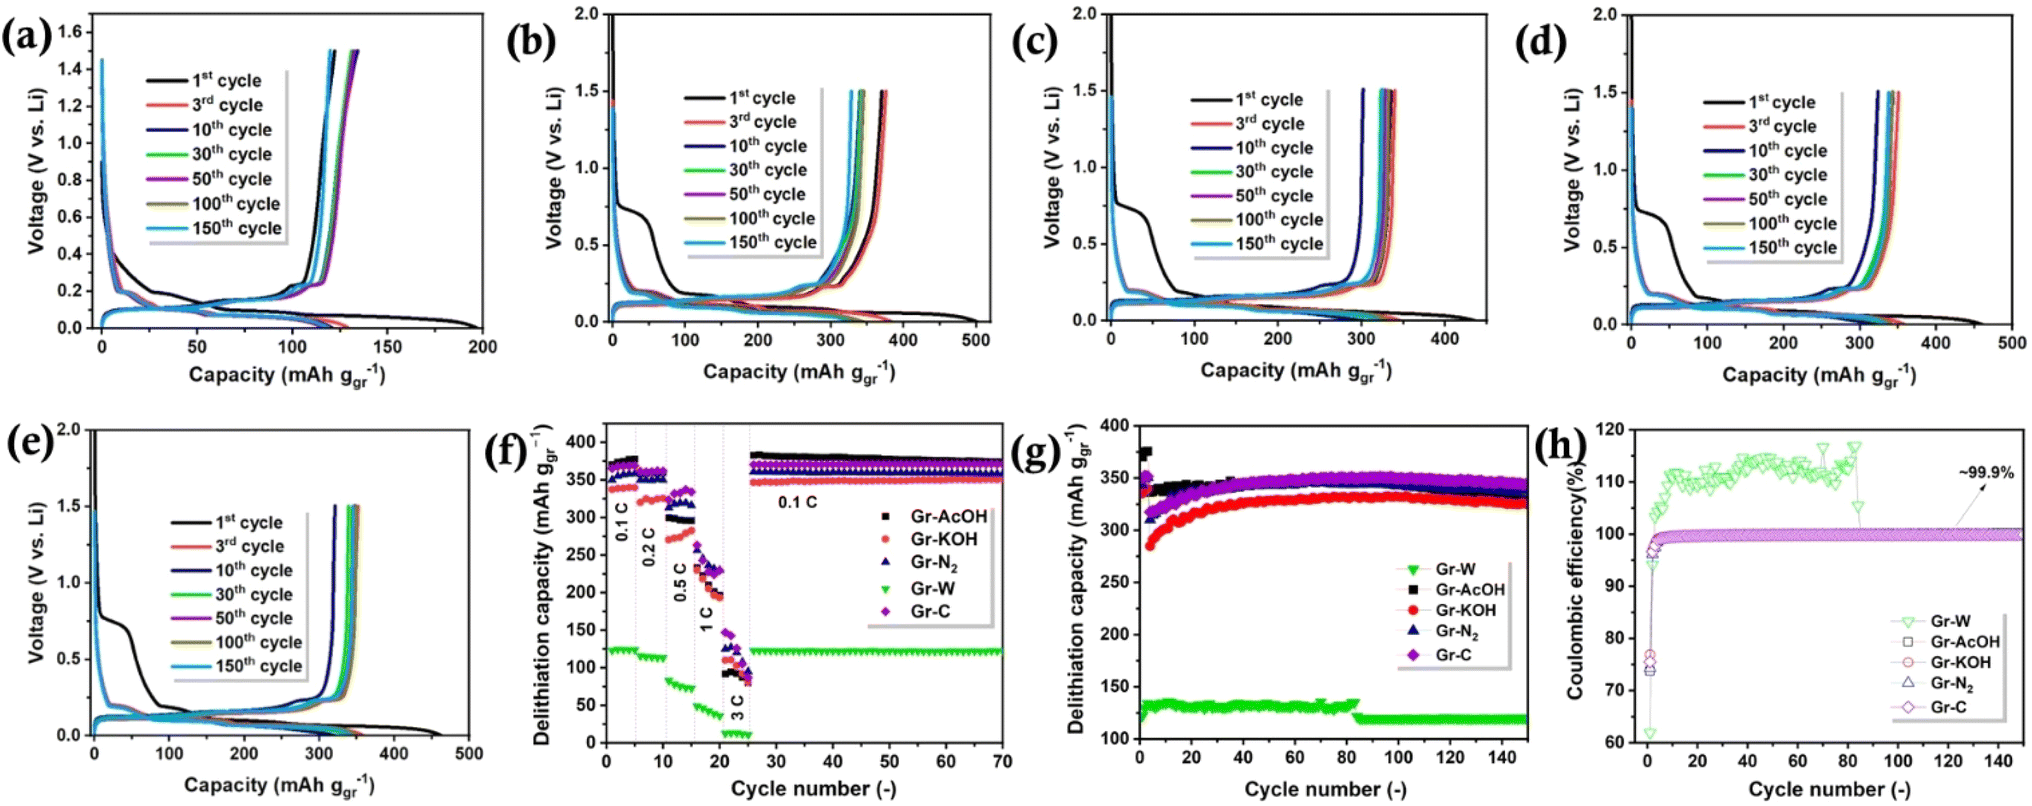 | ||
| Fig. 5 Lithiation-delithiation curves of CNT-based electrodes: (a) Gr-W (b) Gr-AcOH (c) Gr-KOH (d) Gr-N2 and (e) Gr-C. (f) Median capacity from rate performance repeatability test. (g) Cycling stability of graphite half-cells. (h) Coulombic efficiency of the graphite half cells. | ||
The rate capabilities were evaluated to determine the conductivity of all the graphite samples over five cycles at current densities of 0.1C, 0.2C, 0.5C, 1C, and 3C. In addition, the rate performances of the graphite samples were evaluated using two more-coin cells (Fig. S8–S10†). The average capacity for each rate of all three cells is tabulated in Tables S5–S9.† The median capacities of Gr-W, Gr-AcOH, Gr-KOH, Gr-N2, and Gr-C at 0.1C were 134, 363, 344, 347, and 358 mA h ggr−1, respectively (Fig. 5f). However, the capacities were reduced to 70, 226, 237, 235, and 267 mA h ggr−1, respectively, at 1C. The same tendency was reflected at a high current density of 3C, with the samples showing capacities of 26, 106, 121, 119, and 150 mA h ggr−1, respectively. The rate performance of Gr-N2 was comparable to that of the Gr-C sample, even at a high current density, owing to it rapid charge transfer rate and ease of Li-ion transport. The Gr-AcOH and Gr-KOH showed similar behavior; however, Li-ion de/intercalation did not occur in the Gr-W sample owing to changes in interlayer spacing, which was caused by long-term use (hundreds or thousands of cycles), resulting in lower performance. Subsequently, the cycle performances of the regenerated materials, including Gr-AcOH, Gr-KOH, and Gr-N2, were compared with those of Gr-W and Gr-C. The first three cycles were performed at 0.1C for electrode activation and thereafter at 0.3C for a further 150 cycles. The capacities of Gr-KOH, Gr-N2, and Gr-C increased over the initial four–40 cycles and thereafter stabilized (Fig. 5g). This behavior is common in graphite anodes owing to electrolyte infiltration, which extends the activation time. This gradual activation suggests that the original graphitic structure of Gr-C was restored in the Gr-KOH and Gr-N2 samples owing to heat treatment. In addition, the Gr-N2 and Gr-C samples display the same trend during cycling, indicating their ideal graphite structures after regeneration. As expected, the lower performance of Gr-W recovered from the spent battery was related to the alterations in its graphite structure. After 150 cycles, the Gr-W, Gr-AcOH, Gr-KOH, Gr-N2, and Gr-C delivered 120, 328, 325, 338, and 345 mA h ggr−1 with ∼99.9% coulombic efficiency (except for the Gr-W anode) (Fig. 5h). The cycle performance of all regenerated samples was essentially equivalent to that of the Gr-C material. The Gr-C and the highest-performing regenerated graphite sample, Gr-N2, were prepared using the slurry method to comprehensively evaluate and compare their electrochemical performance. For each sample, three cells were fabricated and tested to ensure consistent and reliable results. The slurry-based electrodes (Gr-N2 and Gr-C) exhibited initial delithiation capacities of 379 and 387 mA h ggr−1, respectively (Fig. S11†), which were higher than those of the CNT-based electrodes, which had initial capacities of 343 and 350 mA h ggr−1 for Gr-N2 and Gr-C, respectively. While the slurry-based electrodes demonstrated 91.4% and 97% capacity retention after 75 cycles, respectively (Fig. S12†), the CNT-based electrodes (Gr-N2 and Gr-C) retained 100% of their capacity after the same 75 cycles, resulting in the similar delithiation capacities between the CNT-based electrodes (343 and 350 mA h ggr−1 for Gr-N2 and Gr-C, respectively) and the slurry-based electrodes (363 and 376 mA h ggr−1 for Gr-N2 and Gr-C, respectively) after cycles. Table S10† provides the comparison of regeneration methods, energy consumption, environmental Impact, and electrochemical performance of all graphite samples.
4. Environmental impact of the graphite regeneration methods
LCA provides a comprehensive environmental evaluation that considers the life cycle stages of a subject. This avoids overlooking an environmental burden shift when comparing different treatments, such as pyrometallurgical and hydrometallurgical processes, which typically emit GHGs primarily during the core recycling process and upstream chemical production, respectively, although the downstream also plays a crucial role in the latter. Our LCA model evaluated the environmental performance of the three graphite regeneration methods in terms of the GWP. The process flow diagrams and calculation details are presented in Fig. S1–S3 and Tables S2–S4.†The LCA of the laboratory-scale experiments regenerating 1 g of graphite and those of lab-scale regeneration under ideal conditions and pilot-scale regeneration are presented in Table S11.† Gr-AcOH emits 137.9 kg CO2e per kg graphite, or approximately 1/4 of the GWP of Gr-KOH and Gr-N2 (all results were normalized to 1 kg of recycled graphite for ease of comparison). The poor performance of Gr-KOH and Gr-N2 was attributed to the electricity-demanding annealing reactors, which operated inefficiently at the gram scale.
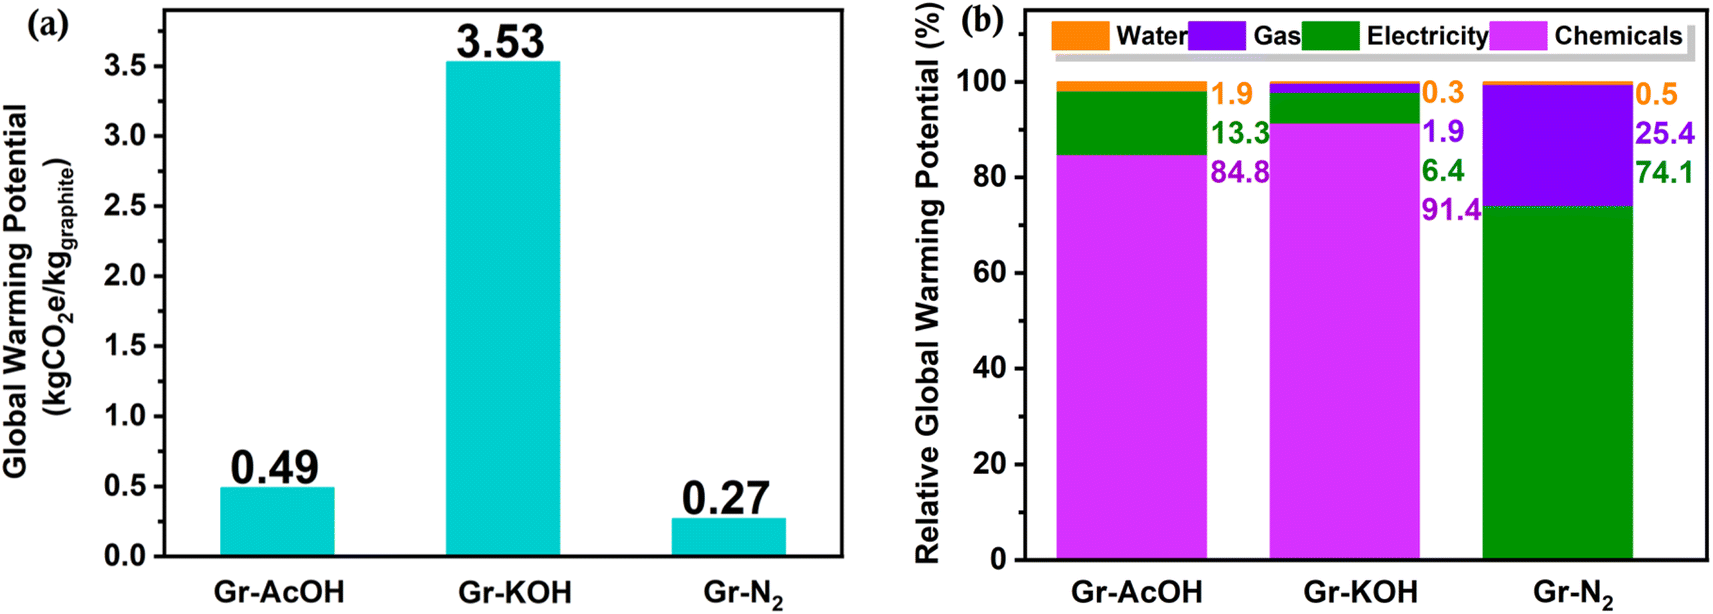
The LCA of pilot-scale 100 kg graphite regeneration are presented in Fig. 6a. Increasing the scale of graphite regeneration significantly reduced GHG emissions. The resulting GWP impacts of Gr-AcOH, Gr-KOH, and Gr-N2, were 0.49, 3.53, and 0.27 kg CO2e per kg graphite, respectively. The reduced emissions were attributed to more efficient electricity usage of the pilot-scale equipment, which was more than one order of magnitude lower when normalized with the treatment capacity per batch. The equipment specifications were based on the suggestion of Rey et al.37 In addition, from an environmental standpoint, we showed that the gas treatment method is the preferred strategy because it uses only deionized water to extract Li from graphite after thermal treatment and thus minimizes chemical usage; however, the acetic acid leaching process extracts almost all the Li from the graphite anode (98% of Li in Gr-W), whereas gas treatment only recovers water-soluble Li compounds from spent graphite (14.4% of Li in Gr-W). Additionally, the Gr-KOH process recovers 83.6% of Li in Gr-W, with some lithium remaining in the KOH solution.
 | ||
| Fig. 6 GWP of the predicted pilot-scale regeneration process (100 kg graphite per batch) estimated by LCA. (a) Global warming potential (GWP) of 1 kg of regenerated graphite using the three techniques examined in this study. (b) Relative contribution of GWP of materials and electricity. Details are shown in Tables S2–S4.† | ||
Fig. 6b shows the relative contributions of electricity, chemicals, gas, and water to the GWP of each regeneration method. The acid used for leaching (84.8%) and electricity for stirring and graphite drying (13.3%) dominate the impact of Gr-AcOH; however, although not considered in this study, acetic acid can be recycled and reused in future regenerative processes. The impact of Gr-KOH was similarly dominated by alkali use (91.4%) and electricity (6.4%). Graphite regeneration requires six times more KOH than acetic acid. The impact of Gr-N2 was dominated by electricity for annealing and drying (74.1%) and gas usage (25.4%). Gr-N2 employs a more straightforward heat treatment to effectively regenerate graphite, thereby avoiding the chemicals that dominate the impacts of Gr-AcOH and Gr-KOH.
Rey et al. compared nine different processes used to recycle graphite in spent LIBs modeled on openLCA software with Ecoinvent v3.9 Dataset.37 The GWP impact estimated in the present study was lower than this earlier study (between 0.53 and 9.76 kg CO2e per kg graphite). Notably, the gas treatment process at 800 °C avoided the use of acid or alkali in the regeneration process, but consumed more electricity than the other processes, resulting in a low GWP impact of 0.27 kg CO2e per kg graphite. This GWP value is considerably lower than that of graphite recovery process by the Fenton and flotation technique (48.41 kg CO2e per kg graphite), oxygen-free roasting process (6.82 kg CO2e per kg graphite), leaching and filtration (2.49 kg CO2e per kg graphite), and H2SO4 curing-leaching process (2.89 kg CO2e per kg graphite).37 The assessment was based on reported literature and some reasonable assumptions; however, the uncertainty, both in the assessment of the literature data and the energy usage of our own methods, is large. Moreover, the production of natural graphite exhibited a GWP 4.9–5.5 kg CO2e per kg graphite, according to Argonne National Laboratory's GREET model,38 and others.39 Furthermore, our study primarily aims to avoid the solid waste management concerns associated with the uncontrolled disposal of spent LIBs by reusing spent graphite, which constitutes ∼21% of these waste sources, for new LIB production. Complete Li extraction from spent anodes is expected to reduce Li dependency prevent excessive Li exposure, which is harmful to human health. Further reduction of the GWP of graphite regeneration by combining acetic acid leaching and heat treatment to achieve efficient Li extraction is the basis of our future work in this area. Other potential environmental impacts of Li regeneration, including acidification, eutrophication, ecotoxicity, human toxicity, resource depletion, and other commonly assessed indicators, are presented in Fig. S13.† Across all indicators, Gr-N2 was 28–84% better than Gr-AcOH, while Gr-AcOH was 42–93% better than Gr-KOH. Therefore, within the scope of this study, Gr-N2 was the environmentally preferred method and tabulated all details including the electrochemical performance and processing conditions in Table S10.†
5. Conclusions
This study implemented three different routes to recover and regenerate graphite in spent LIBs, namely acid (Gr-AcOH), alkali (Gr-KOH), and gas (Gr-N2) treatments, and evaluated the electrochemical performance of the regenerated graphite using graphite-CNT anodes free from binders and metal current collectors. The Gr-CNT anodes, reusing regenerated spent graphite extracted by each of the three strategies, exhibited similar performance to commercial graphite anodes in half-cell configurations. In particular, the coulombic efficiency improved to ∼96% after the first cycle, while Gr-AcOH, Gr-KOH, Gr-N2 samples maintained capacity retentions of 88.7%, 96.8%, and 98.4%, respectively, coulombic efficiencies of ∼99.9% after 150 cycles. Additionally, the Gr-AcOH, Gr-KOH, and Gr-N2 samples exhibited GWP values of 0.49, 3.53, and 0.27 kg CO2e/kg graphite, respectively. Production of the required chemicals is an environmental hotspot. Gr-N2 graphite regeneration avoids the use of chemicals while efficiently recovering the structure and anode performance of graphite and is therefore the preferred graphite regeneration strategy.Data availability
Data will be made available on request.Author contribution
Subramanian Natarajan: conceptualization, formal analysis, funding acquisition, investigation, methodology, validation, visualization, writing – original draft and writing – review and editing. Tomotaro-Mae: data curation, investigation. Heng Yi Teah: methodology, writing – review and editing. Hiroki Sakurai: formal analysis. Suguru Noda: conceptualization, funding acquisition, project administration, resources, supervision, validation, and writing – review and editing.Conflicts of interest
There are no conflicts to declare.Acknowledgements
S. Natarajan thanks the Japan Society for the Promotion of Science (JSPS) for awarding a Standard Postdoctoral Fellowship. The authors thank Mr Mikuriya for his support in dismantling the spent LIBs in a dry room. This study was supported by a Grant-in-Aid for JSPS Fellows (JP-P21369), a Grant-in-Aid for Scientific Research (A) (JP21H04633) from JSPS, Japan, ASPIRE (JPMJAP2313) from JST, and a grant from the Waseda Research Institute for Science and Engineering (WRISE), Waseda University. This work was performed using research equipment (C1033 and D1001) shared by the MEXT Project for promoting the public utilization of advanced research infrastructure (Program for supporting the construction of core facilities, Grant Number JPMXS0440500024).References
- A. Manthiram, ACS Cent. Sci., 2017, 3, 1063–1069 CrossRef CAS PubMed.
- M. Li, J. Lu, Z. Chen and K. Amine, Adv. Mater., 2018, 30, 1800561 CrossRef.
- N. Nitta, F. Wu, J. T. Lee and G. Yushin, Mater. Today, 2015, 18, 252–264 CrossRef CAS.
- R. Schmuch, R. Wagner, G. Hörpel, T. Placke and M. Winter, Nat. Energy, 2018, 3, 267–278 CrossRef CAS.
- V. Etacheri, R. Marom, R. Elazari, G. Salitra and D. Aurbach, Energy Environ. Sci., 2011, 4, 3243–3262 RSC.
- M. Company, Battery 2030: Resilient, sustainable, and circular, https://www.mckinsey.com/industries/automotive-and-assembly/our-insights/battery-2030-resilient-sustainable-and-circular, Data link accessed on 23rd July 2023.
- F. Wu and G. Yushin, Energy Environ. Sci., 2017, 10, 435–459 RSC.
- S. Natarajan and V. Aravindan, Adv. Energy Mater., 2018, 8, 1802303 CrossRef.
- S. Natarajan and V. Aravindan, ACS Energy Lett., 2018, 3, 2101–2103 CrossRef CAS.
- J. Asenbauer, T. Eisenmann, M. Kuenzel, A. Kazzazi, Z. Chen and D. Bresser, Sustain. Energy Fuels, 2020, 4, 5387–5416 RSC.
- S. Natarajan and V. Aravindan, Adv. Energy Mater., 2020, 10, 2002238 CrossRef CAS.
- S. Natarajan, M. L. Divya and V. Aravindan, J. Energy Chem., 2022, 71, 351–369 CrossRef CAS.
- F. B. INSIGHTS, Graphite Market Size, Share & COVID-19 Impact Analysis By Product, By Application, and Regional Forecast, 2021-2028 https://www.fortunebusinessinsights.com/graphite-market-105322, Data link accessed on 23rd July 2023.
- B. Niu, J. Xiao and Z. Xu, J. Hazard. Mater., 2022, 439, 129678 CrossRef CAS.
- A. Mayyas, D. Steward and M. Mann, Sustainable Mater. Technol., 2019, 19, e00087 CrossRef.
- Z. P. Cano, D. Banham, S. Ye, A. Hintennach, J. Lu, M. Fowler and Z. Chen, Nat. Energy, 2018, 3, 279–289 CrossRef.
- X. Ma, M. Chen, B. Chen, Z. Meng and Y. Wang, ACS Sustain. Chem. Eng., 2019, 7, 19732–19738 CrossRef.
- N. Cao, Y. Zhang, L. Chen, W. Chu, Y. Huang, Y. Jia and M. Wang, J. Power Sources, 2021, 483, 229163 CrossRef.
- Y. Li, W. Lv, H. Zhao, Y. Xie, D. Ruan and Z. Sun, Green Chem., 2022, 24, 9315–9328 RSC.
- J. Yang, E. Fan, J. Lin, F. Arshad, X. Zhang, H. Wang, F. Wu, R. Chen and L. Li, ACS Appl. Energy Mater., 2021, 4, 6261–6268 CrossRef.
- Q. Cheng, R. Yuge, K. Nakahara, N. Tamura and S. Miyamoto, J. Power Sources, 2015, 284, 258–263 CrossRef.
- B. Markey, M. H. Zhang, I. Robb, P. P. Xu, H. P. Gao, D. W. Zhang, J. Holoubek, D. Xia, Y. F. Zhao, J. C. Guo, M. Cai, Y. S. Meng and Z. Chen, J. Electrochem. Soc., 2020, 167, 160511 CrossRef.
- K. Hasegawa and S. Noda, J. Power Sources, 2016, 321, 155–162 CrossRef.
- K. Hori, Y. Yamada, T. Momma and S. Noda, Carbon, 2020, 161, 612–621 CrossRef.
- T. Mae, K. Kaneko, H. Sakurai and S. Noda, Carbon, 2024, 218, 118663 CrossRef.
- R. Arvidsson, A.-M. Tillman, B. A. Sandén, M. Janssen, A. Nordelöf, D. Kushnir and S. Molander, J. Ind. Ecol., 2018, 22, 1286–1294 CrossRef.
- I. S. Arvanitoyannis, in Waste Management for the Food Industries, ed. I. S. Arvanitoyannis, Academic Press, Amsterdam, 2008, pp. 97–132, DOI:10.1016/B978-012373654-3.50006-7.
- M. A. J. Huijbregts, Z. J. N. Steinmann, P. M. F. Elshout, G. Stam, F. Verones, M. Vieira, M. Zijp, A. Hollander and R. v. Zelm, Int. J. Life Cycle Assess., 2017, 22, 138–147 CrossRef.
- Y. Yang, X. Meng, H. Cao, X. Lin, C. Liu, Y. Sun, Y. Zhang and Z. Sun, Green Chem., 2018, 20, 3121–3133 RSC.
- J.-H. Shim and S. Lee, J. Power Sources, 2016, 324, 475–483 CrossRef CAS.
- H. Adenusi, G. A. Chass, S. Passerini, K. V. Tian and G. Chen, Adv. Energy Mater., 2023, 13, 2203307 CrossRef CAS.
- L. Wang, A. Menakath, F. Han, Y. Wang, P. Y. Zavalij, K. J. Gaskell, O. Borodin, D. Iuga, S. P. Brown, C. Wang, K. Xu and B. W. Eichhorn, Nat. Chem., 2019, 11, 789–796 CrossRef CAS.
- Y. Gao, C. Wang, J. Zhang, Q. Jing, B. Ma, Y. Chen and W. Zhang, ACS Sustain. Chem. Eng., 2020, 8, 9447–9455 CrossRef CAS.
- L. J. Krause, T. Brandt, V. L. Chevrier and L. D. Jensen, J. Electrochem. Soc., 2017, 164, A2277 CrossRef CAS.
- J. Zhang, X. Li, D. Song, Y. Miao, J. Song and L. Zhang, J. Power Sources, 2018, 390, 38–44 CrossRef CAS.
- J. Li, Y. He, Y. Fu, W. Xie, Y. Feng and K. Alejandro, Waste Manage., 2021, 126, 517–526 CrossRef CAS PubMed.
- I. Rey, C. Vallejo, G. Santiago, M. Iturrondobeitia and E. Lizundia, ACS Sustain. Chem. Eng., 2021, 9, 14488–14501 CrossRef CAS.
- A. N. Laboratory, GREET® Model: the Greenhouse Gases, Regulated Emissions, and Energy Use in Transportation Model, R&D GREET Life Cycle Analysis Model, Department of Energy, 2018, Data link accessed on 25th, August 2024 Search PubMed.
- Q. Q. Zhang, X. Z. Gong and X. C. Meng, Mater. Sci. Forum, 2018, 913, 1011–1017 Search PubMed.
Footnote |
| † Electronic supplementary information (ESI) available. See DOI: https://doi.org/10.1039/d4ta07618d |
| This journal is © The Royal Society of Chemistry 2025 |