Leveraging efficiency metrics for the optimization of CELMoDs™ as cereblon-based molecular glue degraders†
Lei
Jia‡
 a,
Jennifer R.
Riggs‡
 a,
Dahlia R.
Weiss
 b,
Brian L.
Claus
c,
Veerabahu
Shanmugasundaram
 d,
Stephen R.
Johnson
c and
Christoph W.
Zapf
 *a
*a
aBristol Myers Squibb, 10300 Campus Point Dr. Suite 100, San Diego, CA 92121, USA. E-mail: Christoph.Zapf@bms.com
bBristol Myers Squibb, 700 Bay Rd, Redwood City, CA 94063, USA
cBristol Myers Squibb, 3551 Lawrenceville Rd, Lawrence Township, NJ 08648, USA
dBristol Myers Squibb, 250 Water St, Cambridge, MA 02141, USA
First published on 3rd March 2025
Abstract
Efficiency metrics are useful in medicinal chemistry to track small molecule progress in lead optimization (LO). Molecular glue degraders are small molecules that mediate targeted protein degradation by chemically inducing proximity between an E3 ligase and a protein target. The potency and depth of protein degradation are important factors in identifying molecular glue drug candidates. We developed degradation efficiency metrics based on both potency and depth of degradation to track lead optimization objectives. We applied these efficiency metrics retrospectively to track optimization of a clinical molecular glue degrader series, resulting in the identification of Golcadomide (CC-99282). This work illustrates that efficiency metrics are beneficial for the identification of molecular glue drug candidates.
Targeted protein degradation can be accomplished by small molecules that act as heterobifunctional degraders or as molecular glue degraders leading to the induction of proximity between an E3 ligase and a protein target.1,2 In order to interact with both the E3 ligase and the target protein of interest (POI), heterobifunctional degraders are often characterized by molecular sizes larger than normal small molecule drugs since they feature binders to both the E3 ligase and the POI connected by a linker. Conversely, molecular glue degraders may have similar size and properties as traditional small molecule drugs.3 Both types of degraders are expected to work catalytically where a single molecule can mediate the degradation of multiple copies of the proteins of interest.4,5 This mode of action may lead to a “deeper” pharmacological response at an equivalent level of exposure compared to stoichiometric inhibition. In addition to a dose response measurement of potency (DC50 – effective concentration at which half-maximal degradation is achieved), another critical characterization of molecular degraders is the maximal depth of protein degradation (Dmax or sometimes referred to as Ymin, Fig. 1).6 In a degradation or cell proliferation dose response assay, Dmax is obtained at the drug concentration where maximum degradation or cell growth inhibition is achieved. In an extreme case, Dmax = 0 indicates that all target protein is effectively degraded, or cell proliferation is completely inhibited, relative to control.
 | ||
| Fig. 1 A representative dose response curve and definition of Dmax (sometimes to be called as Ymin) and DC50. The figure is for illustration purposes only. | ||
A retrospective analysis was performed as a proof of concept for utilizing efficiency metrics in a Cereblon E3 Ligase Modulating Drug (CELMoD) program. A rich internal dataset exists in our organization from medicinal chemistry programs targeting the zinc finger transcription factors IKZF1 (Ikaros) and IKZF3 (Aiolos), proteins critical for lymphoid development and differentiation. The program that identified the clinical compound Golcadomide (CC-99282) was selected for our analysis. At the outset, the program goal was to develop a compound with improved activity for high unmet medical need indications such as relapsed/refractory non-Hodgkin's lymphoma (R/R NHL). While early IKZF1/3 degraders such as lenalidomide have shown some modest clinical promise in R/R NHL, it was hypothesized that a deeper degrader of both IKZF1 and IKZF3 with preferential tissue distribution in lymph nodes would lead to superior efficacy, regardless of cereblon expression. This program successfully delivered Golcadomide which is now in phase III clinical trials for large B-cell lymphoma.7
Similar to traditional stoichiometric small molecule inhibitors, improving degradation potency by increasing the size or lipophilicity of cereblon-based molecular glue degraders may not be an appropriate medicinal chemistry design strategy as it could lead to promiscuous compounds with poor physicochemical properties and in vivo exposures.8 Analogous to stoichiometric inhibitors, the optimization of small molecule degraders may similarly benefit from efficiency metrics considerations balancing their potency with fundamental molecular properties such as size (number of heavy atoms or molecular weight) and lipophilicity (log![[thin space (1/6-em)]](https://www.rsc.org/images/entities/char_2009.gif) D, log
D, log![[thin space (1/6-em)]](https://www.rsc.org/images/entities/char_2009.gif) P or clog
P or clog![[thin space (1/6-em)]](https://www.rsc.org/images/entities/char_2009.gif) P) of drug molecules. Efficiency metrics can be extended from binding affinity to functional studies such as cell proliferation whose potency can be obtained from a dose response measurement as well.9–12 In order to leverage cell proliferation assays for tracking potency, compounds should be selective to avoid being misled by off-target activity. The cell proliferation readout from a promiscuous degrader may suggest increased potency due to undesired off-target degradation. Efficiency metrics such as ligand efficiency (LE) and lipophilic efficiency (LipE or LLE) have been an effective tool for medicinal chemistry to track the progress of small molecules toward a preferred profile by balancing potency with the size or lipophilicity, respectively, of the molecule in lead optimization (LO).11,13–16
P) of drug molecules. Efficiency metrics can be extended from binding affinity to functional studies such as cell proliferation whose potency can be obtained from a dose response measurement as well.9–12 In order to leverage cell proliferation assays for tracking potency, compounds should be selective to avoid being misled by off-target activity. The cell proliferation readout from a promiscuous degrader may suggest increased potency due to undesired off-target degradation. Efficiency metrics such as ligand efficiency (LE) and lipophilic efficiency (LipE or LLE) have been an effective tool for medicinal chemistry to track the progress of small molecules toward a preferred profile by balancing potency with the size or lipophilicity, respectively, of the molecule in lead optimization (LO).11,13–16
In this paper, we report efficiency metrics tailored for degraders to capture both potency and depth of degradation in a single score. This score can aid in the optimization of degraders with consideration of both DC50 and Dmax.
Legacy ligand efficiency (LE)17 is defined as
Legacy lipophilic ligand efficiency (LipE or LLE)20 is defined as
LipE = LLE = pIC50 − log![[thin space (1/6-em)]](https://www.rsc.org/images/entities/char_2009.gif) D D |
![[thin space (1/6-em)]](https://www.rsc.org/images/entities/char_2009.gif) D is the measured distribution coefficient in n-octanol and water at a given pH. The calculated partition coefficient in n-octanol and water clog
D is the measured distribution coefficient in n-octanol and water at a given pH. The calculated partition coefficient in n-octanol and water clog![[thin space (1/6-em)]](https://www.rsc.org/images/entities/char_2009.gif) P can be approximated as a surrogate value in the absence of a measured value.
P can be approximated as a surrogate value in the absence of a measured value.
For the degradation case, a composite degradation potency (CDP) term was defined to consider both DC50 and Dmax:
Ligand efficiency for degraders (LED) is then defined as
LipED = CDP − log![[thin space (1/6-em)]](https://www.rsc.org/images/entities/char_2009.gif) D D |
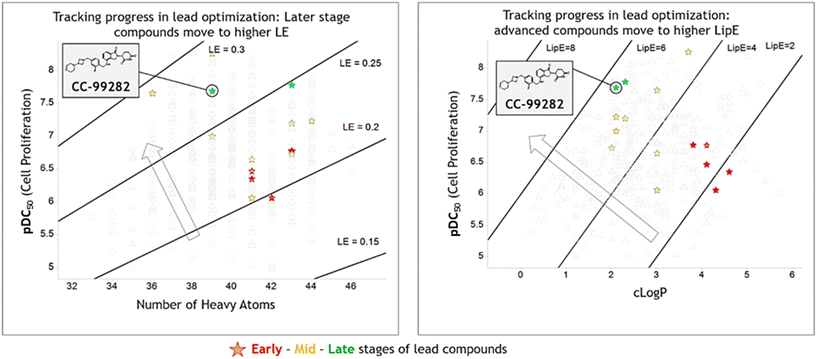
Legacy LE and LipE plots were generated to track LO progress (Fig. 2). Lead compounds in different LO stages demonstrate the effectiveness of LE and LipE. In the LE space, compounds are optimized toward high LE primarily through potency improvement. Throughout the Golcadomide program, the molecules were not optimized by significantly decreasing their size. Because of the high potency of the molecules, an attractive LE level can be reached without a need of further decreasing the size. LipE distinguishes later stage lead compounds more effectively than the LE in the Golcadomide program, as later stage compounds are typically more potent and better optimized for physicochemical properties compared to earlier lead molecules.
 | ||
| Fig. 2 LE and LipE plots of compounds in LO of CC-99282 series. Potency is from an anti-proliferation assay using Su-DHL-4 cell line. Arrow indicates the desired space on the plots. Lead compounds at different stages are highlighted with colored star shape. Detailed depiction of drug candidate CC-99282 can be found in Fig. S1.† | ||
The original definition of LE and LipE is based on binding affinity or potency and meant to represent the effectiveness of a drug candidate. In the degradation case, binding does not always lead to the degradation of targeted proteins and, ultimately, the inhibition of cell proliferation.21–24 Although not as common as using binding potency to compute efficiency metrics, there are cases of using potency from cell proliferation assays to compute efficiency metrics for non-degradation drugs.18,19 In our study, the cell proliferation assay was used as the endpoint of degradation to describe effectiveness of a drug candidate. Ultimately, the optimized Golcadomide degrader series had uniformly high degradation potency and depth as well as downstream inhibition of cell proliferation was better able to distinguish effective compounds.
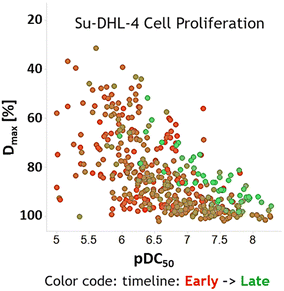
In protein degrader optimization, both potency DC50 and the depth of degradation Dmax are important and a focus of the optimization campaign of a discovery program. While the two are not necessarily correlated, in practice both are often optimized simultaneously, with stronger DC50 and Dmax correlation as LO moves toward late stage, when compounds become more potent and deeper degraders (Fig. 3). Potency/depth of degradation improvement is often a goal during the LO process of a drug discovery program while optimizing ADMET properties simultaneously. While potent and efficient cell proliferation inhibiting degraders were identified early in the program (red/brown data points), these compounds were unsuitable as drug candidates due to other sub-optimal properties. Continued SAR exploration resulted in later-stage compounds (green data points) which had improved properties across a number of critical in vitro and in vivo parameters. Legacy LE and LipE only capture the DC50 but not Dmax. Degrader specific efficiency metrics LED and LipED were created to consider both DC50 and Dmax.
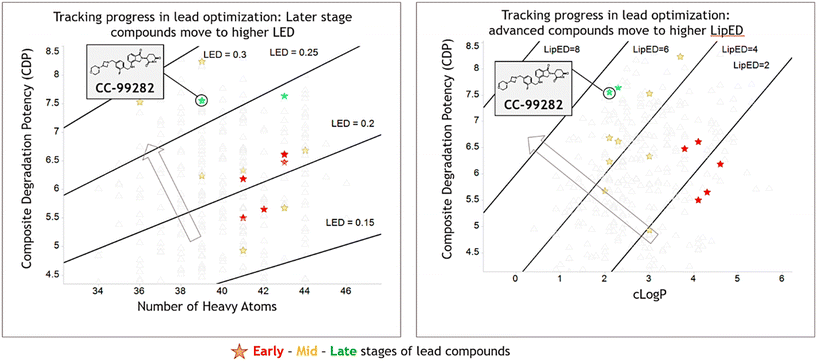
Fig. 4 shows the corresponding LED and LipED plots whereas Fig. 5 shows the evolution of the LED and LipED parameters over the time course of LO, with a trend of increasing LED and LipED for all compounds. Similar to the legacy metrics, LipED can more effectively distinguish later stage leads comparing to earlier stage leads than the LED parameter.
 | ||
| Fig. 4 LED and LipED plots of compounds in LO of CC-99282 series. Arrow indicates the desired space on the plots. Lead compounds at different stages are highlighted with colored star shape. | ||
 | ||
| Fig. 5 Time series plots of LED and LipED during the LO progress. Lead compounds at different stages are highlighted with colored star shape. | ||
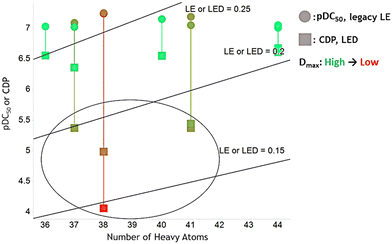
Since DC50 and Dmax do not correlate well for early to middle stage LO compounds, LipED can be used to more effectively differentiate strong degraders i.e. more potent compounds that also degrade the target protein more deeply, compared to the legacy LipE. To demonstrate LipED's effectiveness, 10 compounds were randomly selected with pDC50 between 7 and 7.5. They represent early to middle stage LO compounds with modest potency. Their degradation depth Dmax ranges between 5% and 50%, with 5% at the more thorough degradation and 50% at the least thorough degradation level. The 10 compounds' pDC50 or CDP were plotted vs. clog![[thin space (1/6-em)]](https://www.rsc.org/images/entities/char_2009.gif) P to form LipE and LipED plot together (Fig. 6). For the 5 compounds (green color) which have deep degradation (low Dmax), their LipE and LipED are similar. However, for the 5 compounds which have shallow degradation (high Dmax), LipED shows a significantly lower value comparing to LipE. Thus, LipED can more effectively rank compounds with consideration of both DC50 and Dmax comparing to LipE. LipED achieved this effectiveness by adding penalty to compounds which have a shallow level of degradation (high Dmax).
P to form LipE and LipED plot together (Fig. 6). For the 5 compounds (green color) which have deep degradation (low Dmax), their LipE and LipED are similar. However, for the 5 compounds which have shallow degradation (high Dmax), LipED shows a significantly lower value comparing to LipE. Thus, LipED can more effectively rank compounds with consideration of both DC50 and Dmax comparing to LipE. LipED achieved this effectiveness by adding penalty to compounds which have a shallow level of degradation (high Dmax).
The same trend on the LE/LED plot was observed (Fig. 7). Using the area under the curve (AUC) from dose response cell proliferation study in exchange of CDP to compute LED and LipED can also be an effective method in developing degraders as AUC also considers both potency and the depth of degradation.25,26
In summary, efficiency metrics such as LE and LipE, initially introduced for stoichiometric inhibitors, have proven to be simple and useful tools for tracking LO project progression and guiding compound design. These metrics are equally valuable for CELMoDs, however it is crucial to consider both DC50 and Dmax when optimizing a series of protein degraders, to identify compounds that are not only potent but also maximally effective. Recognizing that both of these parameters are important measures of activity, we envisioned a single potency description that accounts for both: the composite degradation potency. This comprehensive metric will provide a more holistic view of a degrader's effectiveness, thus facilitating better decision-making in the optimization process. Using this description, efficiency metrics can be calculated and utilized similar to a traditional inhibitor program. In the case of the Golcadomide LO program, we demonstrate that LipED scores can most effectively distinguish later stage lead compounds from earlier stage ones and thus track LO progression. While this present analysis is focused on CELMoDs, future work and subsequent analyses will have to demonstrate broader utility for targeted protein degrader modalities beyond cereblon-based molecular glues or heterobifunctional degrader molecules. With the rapid advance of molecular glue degradation as an exciting and clinically relevant modality,3,27,28 we expect efficiency metrics in this space to garner much interest and utilization in the field.
Abbreviations
| CELMoD | Cereblon E3 Ligase Modulating Drug |
| POI | Protein of interest |
| NHL | Non-Hodgkin's lymphoma |
| LO | Lead optimization |
| ADMET | Absorption, distribution, metabolism, excretion and toxicity |
| LE | Ligand efficiency |
| LipE or LLE | Lipophilic ligand efficiency |
| CDP | Composite degradation potency |
| SF | Scaling factor |
| LED | Ligand efficiency for degrader |
| LipED | Lipophilic ligand efficiency for degrader |
| HA | Number of heavy atoms |
| D max | Maximal depth of protein degradation |
| DC50 | Effective concentration at which half-maximal degradation is achieved |
| AUC | Area under the curve |
Data availability
Data supporting this article have been included as part of the ESI.†Author contributions
Conceptualization: LJ, JRR, DRW, BLC, VS, SRJ, CWZ. Data curation: LJ, JRR. Formal analysis: JRR, CWZ. Methodology: CWZ. Resources: BLC. Supervision: BLC, VS, SRJ, CWZ. Visualization: LJ. Writing – original draft: LJ, JRR, DRW, VS, CWZ. Writing – review & editing: LJ, JRR, DRW, BLC, VS, SRJ, CWZ.Conflicts of interest
The authors declare no competing financial interest.Acknowledgements
We would like to acknowledge the Golcadomide (CC-99282) project team for generating data in lead optimization.References
- M. Scheepstra, K. F. W. Hekking, L. van Hijfte and R. H. A. Folmer, Bivalent Ligands for Protein Degradation in Drug Discovery, Comput. Struct. Biotechnol. J., 2019, 160–176, DOI:10.1016/j.csbj.2019.01.006
.
- T. Ishida and A. Ciulli, E3 Ligase Ligands for PROTACs: How They Were Found and How to Discover New Ones, SLAS Discovery, 2021, 26(4), 484–502, DOI:10.1177/2472555220965528
.
- S. L. Schreiber, The Rise of Molecular Glues, Cell, 2021, 184(1), 3–9, DOI:10.1016/j.cell.2020.12.020
.
- B. Dale, M. Cheng, K.-S. Park, H. Ü. Kaniskan, Y. Xiong and J. Jin, Advancing Targeted Protein Degradation for Cancer Therapy, Nat. Rev. Cancer, 2021, 21(10), 638–654, DOI:10.1038/s41568-021-00365-x
.
- F. P. Rodriguez-Rivera and S. M. Levi, Unifying Catalysis Framework to Dissect Proteasomal Degradation Paradigms, ACS Cent. Sci., 2021, 7(7), 1117–1125, DOI:10.1021/acscentsci.1c00389
.
- K. M. Riching, S. Mahan, C. R. Corona, M. McDougall, J. D. Vasta, M. B. Robers, M. Urh and D. L. Daniels, Quantitative Live-Cell Kinetic Degradation and Mechanistic Profiling of PROTAC Mode of Action, ACS Chem. Biol., 2018, 13(9), 2758–2770, DOI:10.1021/acschembio.8b00692
.
- S. Carrancio, L. Groocock, P. Janardhanan, D. Jankeel, R. Galasso, C. Guarinos, R. K. Narla, M. Groza, J. Leisten, D. W. Pierce, M. Rolfe and A. Lopez-Girona, CC-99282 Is a Novel Cereblon (CRBN) E3 Ligase Modulator (CELMoD) Agent with Enhanced Tumoricidal Activity in Preclinical Models of Lymphoma, Blood, 2021, 138(Supplement 1), 1200, DOI:10.1182/BLOOD-2021–148068
.
- P. Agarwal, J. Huckle, J. Newman and D. L. Reid, Trends in Small Molecule Drug Properties: A Developability Molecule Assessment Perspective, Drug Discovery Today, 2022, 27(12), 103366, DOI:10.1016/J.DRUDIS.2022.103366
.
- T. Ryckmans, M. P. Edwards, V. A. Horne, A. M. Correia, D. R. Owen, L. R. Thompson, I. Tran, M. F. Tutt and T. Young, Rapid Assessment of a Novel Series of Selective CB2 Agonists Using Parallel Synthesis Protocols: A Lipophilic Efficiency (LipE) Analysis, Bioorg. Med. Chem. Lett., 2009, 19(15), 4406–4409, DOI:10.1016/J.BMCL.2009.05.062
.
- K. D. Freeman-Cook, R. L. Hoffman and T. W. Johnson, Lipophilic Efficiency: The Most Important Efficiency Metric in Medicinal Chemistry, Future Med. Chem., 2013, 5(2), 113–115, DOI:10.4155/fmc.12.208
.
- T. W. Johnson, R. A. Gallego and M. P. Edwards, Lipophilic Efficiency as an Important Metric in Drug Design, J. Med. Chem., 2018, 61(15), 6401–6420, DOI:10.1021/acs.jmedchem.8b00077
.
- I. Jabeen, K. Pleban, U. Rinner, P. Chiba and G. F. Ecker, Structure–Activity Relationships, Ligand Efficiency, and Lipophilic Efficiency Profiles of Benzophenone-Type Inhibitors of the Multidrug Transporter P-Glycoprotein, J. Med. Chem., 2012, 55, 3261–3273, DOI:10.1021/JM201705F
.
- A. L. Hopkins, C. R. Groom and A. Alex, Ligand Efficiency: A Useful Metric for Lead Selection, Drug Discovery Today, 2004, 9(10), 430–431, DOI:10.1016/S1359-6446(04)03069–7
.
- M. M. Cavalluzzi, G. F. Mangiatordi, O. Nicolotti and G. Lentini, Ligand Efficiency Metrics in Drug Discovery: The Pros and Cons from a Practical Perspective, Expert Opin. Drug Discovery, 2017, 12(11), 1087–1104 CrossRef CAS
.
- A. L. Hopkins, G. M. Keserü, P. D. Leeson, D. C. Rees and C. H. Reynolds, The Role of Ligand Efficiency Metrics in Drug Discovery, Nat. Rev. Drug Discovery, 2014, 13(2), 105–121, DOI:10.1038/nrd4163
.
- P. W. Kenny, The Nature of Ligand Efficiency, J. Cheminf., 2019, 11, 8, DOI:10.1186/s13321-019-0330-2
.
- I. D. Kuntz, K. Chen, K. A. Sharp and P. A. Kollman, The Maximal Affinity of Ligands, Proc. Natl. Acad. Sci., 1999, 96(18), 9997–10002, DOI:10.1073/pnas.96.18.9997
.
- T. T. Pham, M. Walden, C. Butler, R. Diaz-Gonzalez, G. Pérez-Moreno, G. Ceballos-Pérez, V. Gomez-Pérez, R. García-Hernández, H. Zecca, E. Krakoff, B. Kopec, O. Ichire, C. Mackenzie, M. Pitot, L. M. Ruiz, F. Gamarro, D. González-Pacanowska, M. Navarro and A. B. Dounay, Novel 1,2-Dihydroquinazolin-2-Ones: Design, Synthesis, and Biological Evaluation against Trypanosoma Brucei, Bioorg. Med. Chem. Lett., 2017, 27(16), 3629, DOI:10.1016/J.BMCL.2017.07.032
.
- C. Abad-Zapatero, Ligand Efficiency Indices for Effective Drug Discovery, Expert Opin. Drug Discovery, 2007, 2(4), 469–488, DOI:10.1517/17460441.2.4.469
.
- P. D. Leeson and B. Springthorpe, The Influence of Drug-like Concepts on Decision-Making in Medicinal Chemistry, Nat. Rev. Drug Discovery, 2007, 6(11), 881–890, DOI:10.1038/nrd2445
.
- R. P. Wurz, H. Rui, K. Dellamaggiore, S. Ghimire-Rijal, K. Choi, K. Smither, A. Amegadzie, N. Chen, X. Li, A. Banerjee, Q. Chen, D. Mohl and A. Vaish, Affinity and Cooperativity Modulate Ternary Complex Formation to Drive Targeted Protein Degradation, Nat. Commun., 2023, 14(1), 1–16, DOI:10.1038/s41467-023-39904-5
.
- N. Bai, K. M. Riching, A. Makaju, H. Wu, T. M. Acker, S. C. Ou, Y. Zhang, X. Shen, D. N. Bulloch, H. Rui, B. W. Gibson, D. L. Daniels, M. Urh, B. M. Rock and S. C. Humphreys, Modeling the CRL4A Ligase Complex to Predict Target Protein Ubiquitination Induced by Cereblon-Recruiting PROTACs, J. Biol. Chem., 2022, 298(4), 101653–101654, DOI:10.1016/J.JBC.2022.101653
.
- E. K. Schrader, K. G. Harstad and A. Matouschek, Targeting Proteins for Degradation, Nat. Chem. Biol., 2009, 5(11), 815, DOI:10.1038/NCHEMBIO.250
.
- D. Park, J. Izaguirre, R. Coffey and H. Xu, Modeling the Effect of Cooperativity in Ternary Complex Formation and Targeted Protein Degradation Mediated by Heterobifunctional Degraders, ACS Bio Med Chem Au, 2023, 3(1), 74–86, DOI:10.1021/acsbiomedchemau.2c00037
.
- R. Kurilov, B. Haibe-Kains and B. Brors, Assessment of Modelling Strategies for Drug Response Prediction in Cell Lines and Xenografts, Sci. Rep., 2020, 10(1), 1–11, DOI:10.1038/s41598-020-59656-2
.
- Y. Gao, B. Jiang, H. Kim, M. J. Berberich, J. Che, K. A. Donovan, J. M. Hatcher, F. Huerta, N. P. Kwiatkowski, Y. Liu, P. P. Liuni, R. J. Metivier, V. K. Murali, R. P. Nowak, T. Zhang, E. S. Fischer, N. S. Gray and L. H. Jones, Catalytic Degraders Effectively Address Kinase Site Mutations in EML4-ALK Oncogenic Fusions, J. Med. Chem., 2023, 66(8), 5524–5535, DOI:10.1021/acs.jmedchem.2c01864
.
-
J. R. Riggs, D. S. Mortensen, T. Clayton and C. W. Zapf, Escape from Protacs®: Recent Developments in Protein Degradation With Small-Molecule Glues, In 2021 Medicinal Chemistry Reviews, ed. J. J. Bronson, Medicinal Chemistry Division of the American Chemical Society, 2021, pp. 443–461 Search PubMed
.
- M. Konstantinidou and M. R. Arkin, Molecular Glues for Protein-Protein Interactions: Progressing toward a New Dream, Cell Chem. Biol., 2024, 31(6), 1064–1088, DOI:10.1016/j.chembiol.2024.04.002
.
Footnotes |
| † Electronic supplementary information (ESI) available. See DOI: https://doi.org/10.1039/d4md00870g |
| ‡ These authors contributed equally. |
| This journal is © The Royal Society of Chemistry 2025 |


