 Open Access Article
Creative Commons Attribution 3.0 Unported Licence
Catalytic depolymerisation of isolated lignins to fine chemicals using a Pt/alumina catalyst: part 1—impact of the lignin structure†
Florent P.
Bouxin
*a,
Ashley
McVeigh
a,
Fanny
Tran
b,
Nicholas J.
Westwood
b,
Michael C.
Jarvis
a and
S. David
Jackson
 a
a
aWestCHEM, School of Chemistry, Joseph Black Building, University of Glasgow, Glasgow, G12 8QQ, UK. E-mail: Florent.Bouxin@glasgow.ac.uk
bSchool of Chemistry and Biomedical Sciences Research Complex, Purdie Building, University of St Andrews and EaStCHEM, North Haugh, St Andrews, KY16 9ST, UK
First published on 20th November 2014
Abstract
Four lignin preparations with different contents of alkyl–aryl ether bonds were depolymerised using an alumina supported platinum catalyst. The results showed that the proportion of β-O-4 linkages is the crucial factor for both the yield and the nature of the monomeric products. Highly condensed lignin generated mainly non-alkylated phenolic products while uncondensed lignin generated mainly phenolic products retaining the 3-carbon side-chain. These phenolic products with the 3-carbon chain still attached were considerably less abundant than the maximum potential yield calculated from selective cleavage of alkyl–aryl ether bonds by thioacidolysis, demonstrating that the scope for improved yield remains. Although the catalytic conversion yield rose with an increasing content of labile ether linkages in the lignin structure, optimisation of the catalytic depolymerisation was increasingly required to minimize side reactions. Gel permeation chromatography showed that the products converged towards the same molecular weight distribution regardless of the starting material. The full potential of the highly uncondensed lignin was reached only after the minimisation of condensation reactions during the catalytic conversion.
1. Introduction
It is widely agreed that the economic viability of biofuel production will depend on adding value to the by-products. Amongst these, lignin, for long considered only as an energy resource, attracts the most interest. Several approaches for upgrading lignin have been described in recent reviews.1,2 Lignin can be converted to high-grade biofuel by pyrolysis and deoxygenation3–5 or converted to chemicals with a higher added value using heterogeneous catalysis.2 The attractiveness of lignin lies in its substituted aromatic structure which, after efficient depolymerisation, should lead to substituted aromatic compounds. However, this will heavily rely on a better understanding of the factors influencing the yield and distribution of products.Of the known approaches for lignin conversion using heterogeneous catalysis, Liquid Phase Reforming (LPR) and hydrodeoxygenation (HDO) have been the most studied. LPR of kraft lignin led to lower value products (guaiacol) in higher yields while HDO produced higher value, more substituted products (alkylphenolic compounds) in lower yields.6 Ethyl-substituted7 and propyl-substituted monomers8 have been obtained by catalytic hydrogenolysis of grass lignins, but the yield and distribution of products depended strongly on the lignin structure. Recently two lignin preparations with substantial uncondensed (alkyl–aryl ether) percentages were depolymerised using an alumina supported noble metal catalyst. Although no attempt to correlate the conversion yield to the lignin structure was made, the authors suggested that the presence of alkyl–aryl ether bonds was a key factor for the conversion of lignin to monomers.9 Complete cleavage of the alkyl–aryl ether bonds in a pure, uncondensed lignin model compound was achieved using a carbon supported bimetallic Zn/Pd catalyst in methanol at 150 °C under 300 psi of H2.10
In hardwood species, native lignins are held together mainly by alkyl–aryl ether bonds (up to 70% in some species).11 Unfortunately the pretreatment of lignin prior to depolymerisation often leads to significant depletion of this type of bond and generates C–C bonds that are harder to break.12,13 The resulting condensed lignin is less suitable for conversion to aromatic chemicals. Severe pretreatment conditions (high temperature and acidic medium) are the primary choice for second generation biofuel production but are well known to increase lignin condensation.14 The impact of the pretreatment on the catalytic conversion of the lignin to products with an added value has been reviewed.2 Nevertheless the structure of the lignin immediately before the catalytic conversion step is rarely taken into account. To the best of our knowledge, no attempt has been made to investigate the impact of the lignin structure on the yield and distribution of catalytically depolymerised products.
In this study four lignins with different degrees of condensation have been subjected to catalytic depolymerisation using an alumina supported platinum catalyst. The lignins were prepared by pretreatments with potential for the production of biofuels and co-products. The purpose of this study was to evaluate the impact of the lignin structure on its suitability for conversion to fine chemicals. The catalytic conversion was performed using a commercial benchmark catalyst, Pt/alumina. The main objective was to understand the yield and distribution of alkylphenolic products in relation to the initial degree of condensation of the lignin.
2. Results
2.1. Characterisation of the lignin preparations
| Sugar content | Elemental analysis (mass %) | ||||
|---|---|---|---|---|---|
| (g per 100 g of lignin) | C | H | N | O | |
| AFEX wheat straw | 1.1 (0.1) | 59.5 | 6.4 | 2.1 | 31.9 |
| Soda wheat straw | 2.6 (0.1) | 61.3 | 5.6 | 0.9 | 32.2 |
| Organosolv poplar | 0.4 (0.1) | 63.9 | 6.0 | 0.4 | 29.7 |
| Ammonia poplar | 0.5 (0.1) | 60.2 | 6.0 | 1.8 | 31.9 |
The elemental compositions are typical of lignins previously reported.16 The higher nitrogen content of both lignins from ammonia-based pretreatments (AFEX wheat straw and Ammonium Poplar) can be explained by incorporation of nitrogen from ammonia during the pretreatment step.
| Thioacidolysis | HSQC-NMR | |||||
|---|---|---|---|---|---|---|
| β-O-4 | S/G/H ratio | β-O-4 | β–β | β-5 | S/G/H ratio | |
| Soda wheat straw | 2.8 (0.3) | 0.51/0.49/0 | 3.7 | 1.9 | 0.4 | 0.46/0.40/0.13 |
| AFEX wheat straw | 16.8 (0.4) | 0.49/0.46/0.06 | 37.1 | 4.3 | 3.4 | 0.36/0.60/0.04 |
| Organosolv poplar | 9.2 (0.2) | 0.57/0.43/0 | 12.2 | 5.0 | 4.4 | 0.48/0.52/0 |
| Ammonia poplar | 28.9 (0.3) | 0.65/0.35/0 | 44.9 | 2.3 | 9.0 | 0.64/0.36/0 |
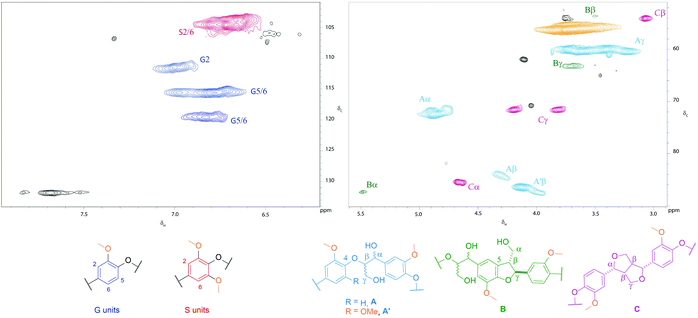
As shown in Table 2, the Poplar ammonia lignin showed the highest content of β-O-4 bonds (44.9%), compared with only 3.7% in the wheat straw soda lignin. The difference in the uncondensed fraction comes partly from the feedstock type but principally from the pretreatment conditions. It may be assumed that harsh alkaline conditions were responsible for the condensation of the wheat straw lignin. In comparison the lignin obtained by mild alkaline organosolv extraction of AFEX-pretreated wheat straw retained 37% of β-O-4 bonds, which can be explained by the relative lack of condensation during both the AFEX pretreatment19 and the subsequent lignin extraction step. After organosolv pretreatment of poplar, the proportion of β-O-4 linkages was reduced to 12%. This is expected since the acidic conditions combined with high temperature (180 °C) are known to cleave β-O-4 linkages leading to more condensed lignins.20 Similar temperatures were applied during the poplar percolation pretreatment but we have shown that the use of ammonium hydroxide, a weaker base than sodium hydroxide, limits lignin condensation.15
Monomer ratios were also obtained from the aromatic proton S2,6 and G2 of the 2D NMR (Fig. 1 and S1†). The 2D NMR experiment measured the total amount of guaiacyl and syringyl units, whereas thioacidolysis only took into account units linked by two β-O-4 bonds, which explains the differences in the monomer ratios. As shown in Table 2, the poplar ammonia lignin had a higher relative percentage of syringyl units than the poplar organosolv lignin. The high syringyl content of ammonia lignins has been observed previously and is attributed to mobilised syringyl lignins at particle surfaces.19 The selective extraction of this syringyl rich lignin is not fully understood but could be linked to thermal properties such as glass transition temperature, which depends on the syringyl/guaiacyl ratio.
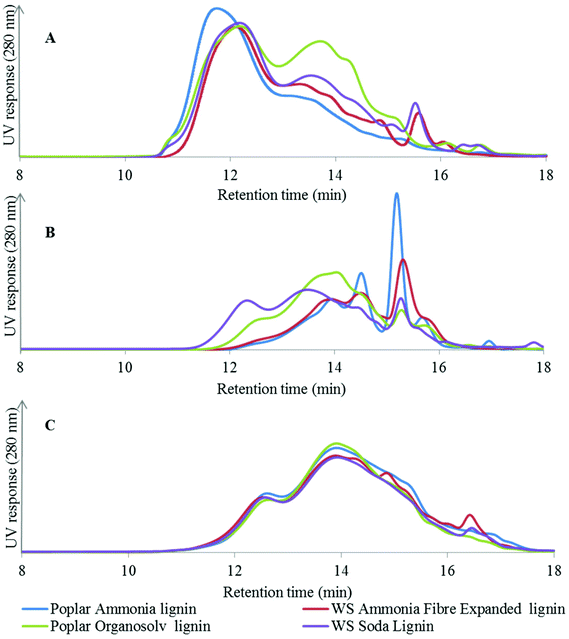
The GPC analysis of the AFEX and soda lignins from wheat straw (Fig. 2A) shows that both lignins exhibited similar MW profiles with the exception of the higher relative abundance of the low MW fraction eluting at 13–14 min from the soda lignin. In the case of the poplar lignins, the high-temperature organosolv pretreatment led to partial cleavage of the alky–aryl ether linkages and reduced the MW of the lignin, as shown by the higher relative intensity of the low MW fraction eluting at 13–14 min, whereas the higher molecular weight of the ammonia lignin suggested that in the alkaline medium the lignin was solubilised without any significant cleavage of the alkyl–aryl linkages.
2.2. Catalytic conversion of lignin preparations
Thus hydrogenolysis was more efficient than thioacidolysis for the depolymerisation of the highly condensed soda lignin. However, when the starting material was less condensed, e.g. the AFEX and ammonia lignins, hydrogenolysis was less efficient than thioacidolysis in breaking down the lignin to low molecular weight fragments.
As opposed to the GPC analysis, the quantification of the monomers gave significant differences. As shown in Table 3, the blank reaction without a catalyst showed the lowest overall yield of 3.5% and mainly generated guaiacol and syringol. In the presence of a catalyst, the overall yield increased up to 14% for the Poplar ammonia lignin, which was nearly three times the yield obtained for the soda wheat straw lignin. In previous studies, the hydrodeoxygenation of lignins using the same type of the catalyst was conducted at lower temperatures (200 °C) which, with other influences such as the lignin structure, could explain the lower yield obtained.6
| N° | Name | Ammonia poplara (no Cat) | Ammonia poplar | Organosolv poplar | Ammonia fibre expanded WS | Soda WS |
|---|---|---|---|---|---|---|
| a Blank reaction without a catalyst. b g per 100 g of lignin. | ||||||
| 1 | Methylphenol | n.d. | n.d. | n.d. | 0.06 | 0.08 |
| 2 | Guaiacol (G) | 0.45b | 0.45 | 0.46 | 0.68 | 0.79 |
| 3 | Catechol | 0.12 | 0.13 | 0.12 | 0.19 | 0.21 |
| 4 | MethylG | 0.10 | 0.20 | 0.30 | 0.37 | 0.30 |
| 5 | EthylG | 0.18 | 0.53 | 0.44 | 2.05 | 1.10 |
| 6 | Ethylcatechol | n.d. | n.d. | n.d. | 0.11 | 0.07 |
| 7 | PropylG | n.d. | 0.85 | 0.56 | 0.84 | 0.19 |
| 8 | PropyenylG | 0.15 | 0.85 | 0.28 | 0.63 | 0.08 |
| 9 | 3-MethoxypropaneG | n.d. | 0.47 | 0.12 | 0.53 | n.d. |
| 10 | 3-HydroxypropaneG | n.d. | 0.66 | 0.20 | 0.29 | 0.07 |
| 11 | Syringol (S) | 1.65 | 1.75 | 0.97 | 0.86 | 1.47 |
| 12 | MethylS | 0.21 | 0.56 | 0.46 | 0.23 | 0.29 |
| 13 | EthylS | 0.28 | 1.01 | 0.45 | 0.62 | 0.61 |
| 14 | PropylS | 0.08 | 2.68 | 1.14 | 0.75 | 0.28 |
| 15 | PropenylS | 0.26 | 1.70 | 0.52 | 0.60 | 0.08 |
| 16 | 3-MethoxypropaneS | n.d. | 0.86 | 0.22 | 0.41 | n.d. |
| 17 | 3-HydroxypropaneS | n.d. | 1.30 | 0.24 | 0.24 | 0.03 |
| 18 | n.d. | n.d. | 0.09 | 0.25 | 0.07 | |
| Total | 3.48 | 14.02 | 6.56 | 9.68 | 5.74 | |
In order to compare the catalytic depolymerisation yields with the degree of condensation as measured by wet chemical analysis (thioacidolysis) both sets of data were converted to μmol g−1 of lignin monomers taking into account the molecular weight of each product.
In thioacidolysis, the selective cleavage of β-O-4 bonds generates products with an intact propyl side chain.21 This approach may be envisaged as a model reaction for the conversion of uncondensed lignin to monomeric propylphenol compounds and compared with the catalytic reaction. As shown in Fig. 4, the catalytic conversion yield was higher than the thioacidolysis yield for highly condensed lignin (soda lignin). When the uncondensed fraction of the lignin was greater, the catalytic conversion yield increased but at a lower rate than the thioacidolysis yield. The thioacidolysis yields from the soda lignin were three times lower than that from the organosolv lignin, while the catalytic yields were the same. A number of potential side-reactions in the catalytic conversion of condensed lignins are not paralleled in thioacidolysis, such as a loss of the γ-carbon. Moreover, abnormal constituents such as ferulic acid, coniferaldehyde and benzaldehyde units lead to monomers that are not taken into account in the thioacidolysis yields. For example, wheat lignins are rich in ferulic acid which can undergo decarboxylation, explaining the abnormal amount of ethylguaiacol (see Table 3). Moreover, small quantities of guaiacol and syringol are produced even from condensed parts of the lignin structure. As shown in Fig. 5, guaiacol and syringol together accounted for 47% of the molar quantity of depolymerised products from soda lignin while they only accounted for 28%, 22% and 21% of the total molar fraction for the organosolv, AFEX and ammonia lignins, respectively. In contrast the relative proportion of propylphenolics increased from 12% to 62% of the total on going from the soda lignin to the ammonia lignin.
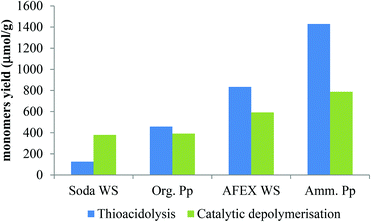 | ||
| Fig. 4 Overall yields of monomers from thioacidolysis and catalytic conversion of different lignin preparations [blue stick: thioacidolysis products; green stick: depolymerised products]. | ||
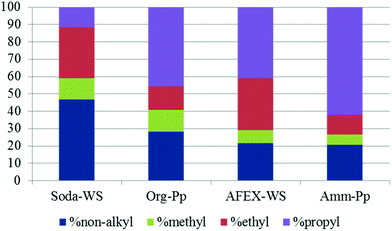 | ||
| Fig. 5 Relative molar proportion of catalytic depolymerisation products from different lignins [blue: non-alkyl; green: methyl; red: ethyl; purple: propyl]. | ||
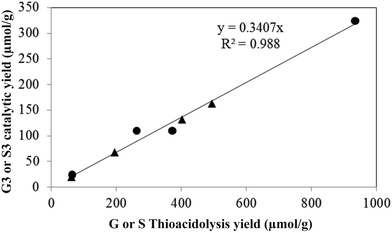
As the ethyl, methyl and non-alkylated phenolic compounds can come from the condensed fraction of the lignin, only the proportion of propylphenolic compounds generated can be directly correlated to the amount of β-O-4 linkages in the starting lignin material. As shown in Fig. 6, there is an excellent correlation between the thioacidolysis and catalytic depolymerisation yields of the products with 3-carbon side chains when either guaiacyl or syringyl units are considered. This observation suggests that both guaiacyl and syringyl units undergo the same type of complex reactions at the same rate. The catalytic depolymerisation yield of propylphenolic compounds was three times lower than its potential maximum yield as deduced from thioacidolysis.
3. Discussion
The results presented above show that the structure of the lignin greatly affects the nature and yield of monomeric depolymerised products. Consequently, the cost efficiency of the lignin isolation method – usually dominated by the efficiency of conversion of the associated cellulose to biofuel – must be balanced against the potential to generate products of higher added values.Compared to the analytical technique of thioacidolysis, the catalytic conversion was non-selective towards uncondensed linkages, giving rise to both cleavage and condensation. In consequence, the catalytic conversion was less efficient for depolymerising uncondensed lignins. In other words catalytic conversion of lignin to fine chemicals is the most promising when the starting lignin is uncondensed, but condensation of the lignin during the catalytic step then leads to the greatest unfulfilled potential. Lignin condensation during this step is as much an issue as during the isolation of the lignin. As shown in Fig. 7, competition between depolymerisation and condensation is the key problem in the conversion of lignin into fine chemicals.
This competition exists at all stages of the process, from feedstock pretreatment to catalytic depolymerisation. The ammonia percolation pretreatment, in which the lignin was continuously removed from the reaction vessel as soon as it became soluble, avoided condensation by limiting both depolymerisation and the simultaneous generation of unstable intermediates.15 During catalytic conversion, depolymerisation is the aim and the generation of unstable products cannot be avoided. The key effect of the hydrogenolysis was to reduce condensation of the products by fast stabilisation (hydrogenation) of reactive intermediates. However, the results showed that condensation still predominated during the catalytic reaction.
Further optimisation of the catalytic conversion of lignin to fine chemicals requires the condensation process to be prevented. For a decade it has been known that one of the condensation pathways is a nucleophilic attack on the benzylic position of the lignin structure (Fig. 8).22,23 This type of reaction predominates in acid catalysed organosolv reactions. During catalytic conversion, the slightly acidic alumina support may promote the acid-catalysed alkylation of the benzylic position, as has been previously reported for the condensation of benzylphenyl ether on zeolite HSZM-5 in aqueous medium.24
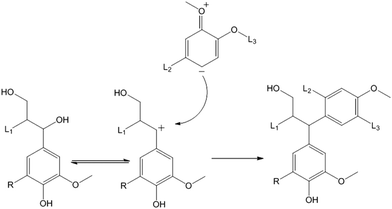 | ||
| Fig. 8 Condensation of the lignin via benzylic carbonium ion formation after heterolytic cleavage of the benzylic C–O bonds [L1, L2, L3 = lignin fragments; R = H or OMe]. | ||
In the case of bio-oil deoxygenation, a two-temperature process has been suggested with the aim of stabilizing the reactive species and thus avoiding condensation.25 A similar approach to stabilisation of lignin before hydrogenolysis will be considered in a future paper. Another explanation for the low conversion of lignin can be inferred from the blank reaction where no catalyst was added to the medium. GPC analysis of the ammonia lignin subjected to these conditions showed a similar molecular weight distribution to the catalytic products (data not shown), implying that condensation could also occur in solution. In that case, slow adsorption of lignin fragments on the catalyst could also be the limiting factor for lignin conversion. A similar observation motivated other authors to subject lignin to liquid phase reforming (LPR) followed by HDO.26 While the lignin products changed, the two step process did not improve the overall yield compared to LPR alone. In other words, LPR treated lignin, probably more condensed, was also less suitable for HDO conversion.
It can be expected that conversion of highly uncondensed lignins, such as AFEX or ammonia lignin, will require gentle and carefully optimised conditions to achieve selective cleavage of C–O bonds and generate high yields of fine aromatic chemicals. In the case of more condensed lignins such as soda or organosolv lignins, harsher conditions are required to cleave C–C bonds or other cracking approaches should be envisaged.
4. Conclusion
The lignin structure, in particular the abundance of β-O-4 linkages, had a major impact on the yield and distribution of products after catalytic depolymerisation. Increasing the degree of condensation in the initial lignin structure reduced the total yield of monomers and also reduced the proportion of monomers retaining the three-carbon alkyl side-chain, which have particular potential for conversion to fine chemicals. When the initial lignin structure was relatively uncondensed, condensation during the catalytic step reduced the yields of alkylated monomers. Optimisation of lignin breakdown, especially from highly uncondensed lignin, requires more selective cleavage methods to minimise condensation. It may be advantageous to adopt a multi-stage breakdown strategy with increasing severity of conditions at each stage.5. Experimental
5.1. Materials
Hybrid poplar sawdust was provided by a UK sawmill. The sawdust was sieved and particles of size ranging from 125 μm to 1080 μm were used. The dry matter content of the poplar sawdust was 92.6%. Ammonia fibre expanded (AFEX) wheat straw was obtained from Prof. Bruce Dale, Michigan State University. Protobind 1000 lignin (soda lignin) was purchased from Green Value (Switzerland).The alumina supported platinum catalyst was obtained from Johnson Matthey (reference number 1074). The catalyst was sieved between 250 and 425 μm, pre-reduced at 250 °C and stored under air. The platinum dispersion, as measured by carbon monoxide chemisorption, was 56%, while the catalyst had a BET surface area of 119 m2 g−1, a pore volume of 0.49 cm3 g−1 and an average pore diameter of 11 nm. All other reagents and solvents were purchased from Sigma-Aldrich and used without further purification.
5.2. Lignin preparation
Three of the four tested lignins were prepared in house, as described below.![[thin space (1/6-em)]](https://www.rsc.org/images/entities/char_2009.gif) :
:![[thin space (1/6-em)]](https://www.rsc.org/images/entities/char_2009.gif) 1. The percolated liquor was concentrated and acidified to pH 2. The precipitate was recovered by centrifugation and briefly hydrolysed with mild ethanolic acid to remove carbohydrate impurities. The lignin was then precipitated in three volumes of water (pH 2, HCl). The purified lignin was recovered by centrifugation, washed three times with deionised water and freeze dried.
1. The percolated liquor was concentrated and acidified to pH 2. The precipitate was recovered by centrifugation and briefly hydrolysed with mild ethanolic acid to remove carbohydrate impurities. The lignin was then precipitated in three volumes of water (pH 2, HCl). The purified lignin was recovered by centrifugation, washed three times with deionised water and freeze dried.
5.3. Catalytic conversion of the lignin
The catalytic depolymerisation reactions were conducted in a 300 ml 316 stainless steel Parr batch autoclave reactor equipped with a Parr model 4842 digital temperature controller ±2 °C. During a typical experiment 0.5 g of lignin was added to the autoclave along with 0.1 g 1% w/w Pt/Al2O3 and 100 ml methanol–water mix (50![[thin space (1/6-em)]](https://www.rsc.org/images/entities/char_2009.gif) :
:![[thin space (1/6-em)]](https://www.rsc.org/images/entities/char_2009.gif) 50 v/v). The reactor was purged with hydrogen and pressurised to 20 bar. The reaction was performed at 300 °C with mechanical stirring (1000 rpm) and stopped after 2 h (plus 30 min ramp time). The reaction mixture was filtered on a sintered glass (porosity 3) to remove the catalyst and insoluble products, and then the residue was washed with acetone to solubilise higher molecular weight lignin fragments. The fraction soluble in methanol–water was centrifuged to remove finely dispersed solids. An aliquot of the solution was then mixed with a known quantity of an internal standard, acidified to pH 3 and extracted with dichloromethane–dioxane (8/2 v/v). After evaporation of the solvent, the products were solubilised in 2 ml dichloromethane.
50 v/v). The reactor was purged with hydrogen and pressurised to 20 bar. The reaction was performed at 300 °C with mechanical stirring (1000 rpm) and stopped after 2 h (plus 30 min ramp time). The reaction mixture was filtered on a sintered glass (porosity 3) to remove the catalyst and insoluble products, and then the residue was washed with acetone to solubilise higher molecular weight lignin fragments. The fraction soluble in methanol–water was centrifuged to remove finely dispersed solids. An aliquot of the solution was then mixed with a known quantity of an internal standard, acidified to pH 3 and extracted with dichloromethane–dioxane (8/2 v/v). After evaporation of the solvent, the products were solubilised in 2 ml dichloromethane.
5.4. Analytical methods
Sugar analysis, gel permeation chromatography and thioacidolysis of lignins have been described in a previous paper.15 For GPC analysis of the catalytic conversion products, equal volumes of the methanol–water and acetone solubles were mixed together, evaporated to dryness, acetylated, and solubilised in THF before injection. GC/MS analysis of the catalytic conversion products was performed as follows. An aliquot (10 μl) of the products, extracted in dichloromethane, was added to 30 μl pyridine and 70 μl TMS. Qualitative and quantitative analyses were performed using a Shimadzu GC-MS-QP2010S coupled to a Shimadzu GC-2010 GC equipped with a ZB-5MS capillary column (30 m × 0.25 mm × 0.25 μm). The quantification of the products was measured on the TIC and based on reference compounds with hexadecane as an internal standard.NMR spectra were acquired on a Bruker Avance III 500 MHz spectrometer equipped with a BBFO + probe. The central DMSO solvent peak was used as the internal reference (δC 39.5, δH 2.49 ppm). The 1H,13C-HSQC experiment was acquired using the standard Bruker pulse sequence ‘hsqcetgpsp.3’ (phase-sensitive gradient-edited-2D HSQC using adiabatic pulses for inversion and refocusing). The composite pulse sequence ‘garp4’ was used for broadband decoupling during acquisition. 2048 Data points were acquired over 12 ppm spectral width (acquisition time 170 ms) in the F2 dimension using 24 scans with 1 s interscan delay and the d4 delay was set to 1.8 ms (1/4J, J = 140 Hz). Spectral width of 170 ppm, 256 increments were acquired in F1 dimension (acquisition time 5.6 ms) resulting in a total experimental time of 2 h. The spectrum was processed using squared cosine bell in both dimensions and LPfc linear prediction (32 coefficients) in F1. Volume integration of cross peaks in the HSQC spectra was carried out using MestReNova software.17
Acknowledgements
The research reported here was funded by BBSRC and a consortium of industry partners comprising the IBTI Club. The authors thank R. Spence and M. Beglan for expert technical assistance. Prof. Bruce Dale and Dr Rebecca Garlock Ong are thanked for generously providing the AFEX pretreated Wheat straw. The NMR component of this work (FT, NJW) was funded by the EPSRC grants EP/J018139/1 and EP/K00445X/1 and through the International Training Network SuBiCat.References
- J. E. Holladay, J. J. Bozell, J. F. White and D. Johnson, Top Value-Added Chemicals from Biomass-Volume II-Results of Screening for Potential Candidates from Biorefinery Lignin, Pacific Northwest National Laboratory (PNNL), Richland, WA, USA, 2007, http://www.pnl.gov/main/publications/external/technical_reports/PNNL-16983.pdf Search PubMed.
- J. Zakzeski, P. C. A. Bruijnincx, A. L. Jongerius and B. M. Weckhuysen, Chem. Rev., 2010, 110, 3552–3599 CrossRef CAS PubMed.
- T. Dickerson and J. Soria, Energies, 2013, 6, 514–538 CrossRef CAS PubMed.
- J. Sun, A. M. Karim, H. Zhang, L. Kovarik, X. S. Li, A. J. Hensley, J.-S. McEwen and Y. Wang, J. Catal., 2013, 306, 47–57 CrossRef CAS PubMed.
- M. V. Bykova, D. Y. Ermakov, S. A. Khromova, A. A. Smirnov, M. Y. Lebedev and V. Yakovlev, Catal. Today, 2014, 220–222, 21–31 CrossRef CAS PubMed.
- J. Zakzeski, A. L. Jongerius, P. C. A. Bruijnincx and B. M. Weckhuysen, ChemSusChem, 2012, 5, 1602–1609 CrossRef CAS PubMed.
- Y. Ye, Y. Zhang, J. Fan and J. Chang, Bioresour. Technol., 2014, 118, 648–651 CrossRef PubMed.
- Q. Song, F. Wang, J. Cai, Y. Wang, J. Zhang, W. Yu and J. Xu, Energy Environ. Sci., 2013, 6, 994–1007 CAS.
- D. D. Laskar, M. P. Tucker, X. Chen, G. L. Helms and B. Yang, Green Chem., 2014, 16, 897–910 RSC.
- T. H. Parsell, B. C. Owen, I. Klein, T. M. Jarrell, C. L. Marcum, L. J. Haupert, L. M. Amundson, H. I. Kenttaemaa, F. Ribeiro, J. T. Miller and M. M. Abu-Omar, Chem. Sci., 2013, 4, 806–813 RSC.
- J. Rencoret, A. Gutierrez, L. Nieto, J. Jimenez-Barbero, C. B. Faulds, H. Kim, J. Ralph, A. T. Martinez and J. C. del Rio, Plant Physiol., 2011, 155, 667–682 CrossRef CAS PubMed.
- J. Choi and O. Faix, J. Wood Sci., 2010, 56, 242–249 CrossRef CAS PubMed.
- R. El Hage, N. Brosse, P. Sannigrahi and A. Ragauskas, Polym. Degrad. Stab., 2010, 95, 997–1003 CrossRef CAS PubMed.
- J. Li, G. Henriksson and G. r. Gellerstedt, Bioresour. Technol., 2007, 98, 3061–3068 CrossRef CAS PubMed.
- F. P. Bouxin, S. David Jackson and M. C. Jarvis, Bioresour. Technol., 2014, 162, 236–242 CrossRef CAS PubMed.
- A. Lindner and G. Wegener, J. Wood Chem. Technol., 1988, 8, 323–340 CrossRef CAS.
- F. Tran, C. S. Lancefield, P. Kamer, T. Lebl and N. Westwood, Green Chem., 2014 10.1039/C4GC01012D.
- M. Sette, R. Wechselberger and C. Crestini, Chem. – Eur. J., 2011, 17, 9529–9535 CrossRef CAS PubMed.
- S. P. S. Chundawat, B. S. Donohoe, L. d. C. Sousa, T. Elder, U. P. Agarwal, F. Lu, J. Ralph, M. E. Himmel, V. Balan and B. E. Dale, Energy Environ. Sci., 2011, 4, 973–984 CAS.
- X. Pan, N. Gilkes, J. Kadla, K. Pye, S. Saka, D. Gregg, K. Ehara, D. Xie, D. Lam and J. Saddler, Biotechnol. Bioeng., 2006, 94, 851–861 CrossRef CAS PubMed.
- C. Lapierre, B. Pollet and C. Rolando, Res. Chem. Intermed., 1995, 21, 397–412 CrossRef CAS.
- K. Lundquist, Appl. Polym. Symp., 1976, 28, 1393–1407 CAS.
- S. Bauer, H. Sorek, V. D. Mitchell, A. B. Ibáñez and D. E. Wemmer, J. Agric. Food Chem., 2012, 60, 8203–8212 CrossRef CAS PubMed.
- J. He, L. Lu, C. Zhao, D. Mei and J. A. Lercher, J. Catal., 2014, 311, 41–51 CrossRef CAS PubMed.
- D. C. Elliott, Energy Fuels, 2007, 21, 1792–1815 CrossRef CAS.
- A. L. Jongerius, P. C. A. Bruijnincx and B. M. Weckhuysen, Green Chem., 2013, 15, 3049–3056 RSC.
- J. M. Lawther, R. C. Sun and W. B. Banks, J. Wood Chem. Technol., 1996, 16, 439–457 CrossRef CAS.
- X. Pan, J. F. Kadla, K. Ehara, N. Gilkes and J. N. Saddler, J. Agric. Food Chem., 2006, 54, 5806–5813 CrossRef CAS PubMed.
- F. P. Bouxin, S. David Jackson and M. C. Jarvis, Bioresour. Technol., 2014, 151, 441–444 CrossRef CAS PubMed.
Footnote |
| † Electronic supplementary information (ESI) available. See DOI: 10.1039/c4gc01678e |
| This journal is © The Royal Society of Chemistry 2015 |

