Target-assisted FRET signal amplification for ultrasensitive detection of microRNA
Bin
Wang
,
Zheng
You
and
Dahai
Ren
 *
*
State Key Laboratory of Precision Measurement Technology and Instruments, Department of Precision Instrument, Tsinghua University, Beijing, 100084, China. E-mail: rendh@tsinghua.edu.cn
First published on 10th January 2019
Abstract
MicroRNA (miRNA) is a type of noncoding RNA and plays a crucial role in gene expression regulation. Sensitive identification and detection of miRNA can offer vast information for transcriptome analysis and cancer studies. Conventional PCR and molecular hybridization techniques suffer from low specificity when used for miRNA detection due to the short nucleotide length of miRNA. The extremely low abundance of miRNA in real biological samples also sets higher demands for the sensitivity of detection methods. A novel method based on target-assisted fluorescence resonance energy transfer (FRET) signal amplification was proposed for the simple and ultrasensitive detection of miRNA. A hairpin fluorescence DNA probe could hybridize with target miRNA to expose the hybridization site for the primer. After being duplexed with the nanogold-labeled primer, the fluorescent dye in the DNA probe was quenched via the FRET mechanism. In the presence of a DNA polymerase, primer-activated strand displacement released the miRNA, and then the miRNA strand could recognize and function with another DNA probe. The recycling of target miRNA and a high quenching efficiency of nanogold greatly improved the sensitivity. The detection limit of the method (1.5 fM) was lower than that of the reported strategies using a target cycling reaction, allowing trace detection of miRNA in real samples. By making full use of miRNA sequences, the method could also recognize single-base mismatches and distinguish homologous miRNAs.
1. Introduction
MicroRNA (miRNA), a type of short noncoding RNA containing 21–23 nucleotides, has attracted huge attention due to its essential function in gene expression regulation and disease studies.1–4 MiRNA expression levels exhibit significant differences in the various developmental stages of cells, and abnormal miRNA expression is usually related to cancer diseases. Meanwhile, the abundance of miRNA in biological samples can be extremely low, for example, the concentration of miR-21 in blood collected from mice with growing tumors was less than 40 fM.5 Therefore, it is emergent and meaningful to study sensitive and practical miRNA detection strategies. Combined with single-cell analysis6–8 and circulating tumor cell research,9,10 miRNA detection techniques can also provide a new platform for cell heterogeneity studies. Conventional miRNA detection methods, such as reverse transcription PCR (RT-PCR),11,12 northern blots,13 and biosensors, all suffered from various drawbacks and limitations in practice. Due to the short length of miRNA, a special stem-loop primer11 or poly(A) tail elongation12 was used in the RT-PCR assay for miRNA quantification. However, the design of these primers was difficult and the accuracy was poor. Limited by unsatisfactory sensitivity, northern blots could not be applied to the analysis of trace miRNA in real samples. Many biosensors have been developed for miRNA detection, including surface-enhanced Raman scattering (SERS),14 electrochemistry,15,16 surface plasmon resonance,17 colorimetry,18,19 electrochemiluminescence,20 and quartz crystal microbalance.21 These hybridization-based methods also had shortcomings in terms of detection limits and costs.Recently, signal amplification strategies have been reported to improve the sensitivity of biosensors. Redox cycling-based catalytic methods,15,22–24 hybridization chain reaction (HCR) assay,25,26 exponential amplification reaction (EXPAR) assay,27,28 and enzyme-assisted target cycling assay19,29,30 were the main approaches. Miao et al. realized the ultrasensitive electrochemical detection of miRNA based on a redox cycling reaction with an iridium(III) complex as the catalyst.15 Jiang's group developed an enzyme-free and label-free fluorescence miRNA biosensor combining HCR-mediated cascade amplification and a DNAzyme-powered three-dimensional DNA walker.25 But redox cycling and HCR-based methods suffered from high complexity and a low signal-to-noise ratio due to the byproducts in the reaction. Liu et al. proposed a circular exponential amplification-based miRNA detection platform using graphene oxide as the quencher and protector.27 However, the amplification bias and nonspecific amplification were inevitable in the EXPAR assay. Yang's group reported on DNase I-assisted target recycling signal amplification for miRNA detection using polydopamine nanosphere-protected ssDNA probes.29 In the work, gold nanoparticles (AuNPs) were the favorite enhancers for signal amplification.15,24,31,32 As the popular metal nanomaterials, AuNPs can enhance the surrounding electromagnetic field via localized surface plasmons, leading to special optical properties for biosensing applications.33,34 AuNPs also show excellent quenching efficiency when used in fluorescence resonance energy transfer (FRET) assays.35–38 AuNPs have been used to amplify the signal of Raman scattering,39 fluorescence polarization,31 fluorescence intensity,40 and electrochemistry.15 However, to the best of our knowledge, analytical miRNA detection combining enzyme-assisted target cycling and AuNP-induced FRET has not been developed before. Compared with other target cycling-based methods using colorimetry19 or fluorescence enhancement,30 the remarkable quenching ability of AuNPs allows further improvement of detection sensitivity.
To achieve trace detection of miRNA with high sensitivity and specificity, we proposed a novel FRET signal amplification strategy based on a target cycling reaction. A fluorescent dye-labeled DNA probe was designed according to the sequence of target miRNA, which ensured that only the target could recognize and open the stem-loop probe. AuNP-labeled primers could hybridize with the DNA probes after the interaction between targets and probes, leading to fluorescence quenching via the FRET mechanism. Meanwhile, primers could activate the strand displacement with the specific enzyme and aqueous environment, freeing target miRNA from the duplex oligonucleotide. Thus, target miRNA was recyclable in the assay and continuously linked dyes to the surface of AuNPs. Fluorescence intensity was measured as the indicator of the miRNA content. The target cycling-based principle and splendid quenching effect of AuNPs lowered the detection limit to the fM level, which demonstrated the feasibility of the method in ultrasensitive miRNA detection in real biological samples. Detection of the miRNA expression level in exosomes was employed as an example. In addition, full use of miRNA sequence information made the hybridization between targets and DNA probes unique and sensitive, offering high selectivity and capacity to distinguish single-base mismatches.
2. Materials and methods
2.1 Reagents and apparatus
Cy5-labeled DNA probes, sulfhydrylated primers and miRNA strands were purified by HPLC (Ruibiotech, China); 7 nm nanogold particles were used (XFNANO, China). Phosphate-buffer solution (PBS, pH = 7.4), 10 mM Tris-HCl buffer (pH = 7.4), 50 mM NaCl, 10 mM MgCl2, and 1 mM dithiothreitol (DTT) were obtained from Macgene, China. Klenow fragments and dNTPs were obtained from Invitrogen, USA. A 384-well plate (Corning, USA), ultrafilter centrifuge tubes with a 100 kDa Ultracel-PL membrane (Millipore, USA), a centrifuge (Eppendorf, Germany), and Arium® pro Ultrapure Water Purification Systems (Sartorius, Germany) were used. Total Exosome Isolation Reagent was used to isolate exosomes from HeLa cell culture media and a TRIzol Plus RNA Purification Kit was used to isolate total RNA from the exosomes (Invitrogen, USA). A microplate reader (PerkinElmer, Envision, USA) was used to measure the fluorescence intensity and spectra of the samples. A transmission electron microscope (Hitachi H-7650, Japan) was used to obtain the micromorphology of AuNPs and exosomes.2.2 Modification of AuNPs with primers
The oligonucleotide sequences of the DNA probes, primers, and target miRNAs are listed in Table 1. All oligonucleotides were dissolved using ultrapure water, and the concentration was set as 100 μM. Thiol-labeled (-SH) primers may form disulfide bonds in aqueous solutions, so the possible disulfide bonds were reduced using tris(2-carboxyethyl)phosphine (TCEP) at first. 300 μL of the primer was mixed with 15 μL of TCEP (20 μM) in a 1.5 mL centrifuge tube. After reaction for 30 minutes at room temperature, the thiol groups were exposed for the subsequent modification of AuNPs.| Name and abbreviation | Sequences (5′ to 3′) |
|---|---|
| Sequences for miR-21-5p detection | |
| DNA probe | ATG TCA ACA TCA GTC TGA TAA GCT AAC TGA TGT TGG G-Cy5 |
| Primer | SH-(CH2)6-CCC AAC ATC A |
| miR-21-5p | UAG CUU AUC AGA CUG AUG UUG A |
| Control RNA1 | UAG CUU AUC AGA CUG AU![[C with combining low line]](https://www.rsc.org/images/entities/b_char_0043_0332.gif) UUG A UUG A |
| Control RNA2 | UAG CUU AUC AGA CUG A![[A with combining low line]](https://www.rsc.org/images/entities/b_char_0041_0332.gif) ![[C with combining low line]](https://www.rsc.org/images/entities/b_char_0043_0332.gif) UUG A UUG A |
| Control RNA3 | UAG CUU AU![[G with combining low line]](https://www.rsc.org/images/entities/b_char_0047_0332.gif) AGA CUG A AGA CUG A![[A with combining low line]](https://www.rsc.org/images/entities/b_char_0041_0332.gif) ![[C with combining low line]](https://www.rsc.org/images/entities/b_char_0043_0332.gif) UUG A UUG A |
| Sequences for miR-92a-3p detection | |
| DNA probe | ATT ACA GGC CGG GAC AAG TGC AAT AGG CCT GTA ATG G-Cy5 |
| Primer | SH-(CH2)6-CCA TTA CAG G |
| miR-92a-3p | UAU UGC ACU UGU CCC GGC CUG U |
Then, 500 μL of AuNP solution (1 μM) was pipetted into the tube and the tube was stored at 4 °C overnight without vibration. The molar ratio of primers to AuNPs was approximately 60 to ensure that at least one primer strand linked to the surface of each AuNP. Free primers that were not labeled on the AuNPs must be removed by ultrafiltration. The solution in the tube was transferred to an ultrafilter centrifuge tube with a 100 kDa Ultracel-PL membrane, and the ultrafilter tube was centrifuged at 4 °C and 5000g. The concentrated solution containing almost all the AuNPs was collected in another 1.5 mL tube and diluted to 5 μM using the Tris-HCl buffer. Here, the concentration of AuNPs was used to represent that of the primer-AuNP conjugates. The number of primers labeled on each AuNP was approximately 15, as calculated using the method reported in ref. 41.
2.3 miRNA detection procedures
The experimental procedure of miRNA detection was simple and fast. The reaction buffer solution contained 10 mM Tris-HCl, 10 mM MgCl2, 50 mM NaCl, and 1 mM DTT. Ten units of Klenow fragments, 5 nmol of dNTPs, 10 μL of primer-labeled AuNPs (5 μM), and 0.5 μL of DNA probe (100 μM) were added to 80 μL of reaction buffer. Then, 10 μL miRNA solutions with different concentrations or biological samples were added. After incubation for 2–4 h at 37 °C, the target cycling reaction was accomplished. The fluorescence intensity or spectrum was measured to study the feasibility and kinetics of the method. When the method was used for exosomal miRNA detection, small nuclear RNA (snRNA) RNU6-2 was chosen as the housekeeping gene for normalization. Reverse transcription PCR was conducted to quantify RNU6-2. For RNU6-2 detection, the sequences of the forward primer and reverse primer were CTCGCTTCGGCAGCACA and AACGCTTCACGAATTTGCGT (5′ → 3′), respectively.2.4 HeLa cell culture and siRNA treatment
HeLa cells were cultured using Dulbecco's Modified Eagle's Medium (DMEM) supplemented with 10% (v/v) exosome-depleted FBS (Macgene, China) in a humidified atmosphere of 5% CO2 at 37 °C. Since normal FBS contains many exosomes, exosome-depleted FBS can guarantee that the isolated exosomes originate from the HeLa cells of interest. We used HPV-18 E6 siRNA to treat HeLa cells to alter the miRNA expression level in exosomes secreted by the cells. The protocol of siRNA delivery to HeLa cells was the same as the procedure in our previous work.42 After siRNA treatment, HeLa cells were cultured with DMEM for 48 h before exosome isolation.2.5 Exosome, total RNA isolation, and TEM characterization
Exosome isolation from HeLa cell culture media and total RNA isolation from exosomes were conducted according to the instructions of manufacturers. AuNPs and isolated exosomes were observed using a transmission electron microscope at an accelerating voltage of 80 kV.3. Results and discussion
3.1 Principle and probe design
Fig. 1 illustrates the principle of the method based on target-assisted FRET signal amplification. At the beginning of the reaction, target miRNA recognized and opened the stem-loop structure of the DNA probe based on base-pairing hybridization. To ensure high hybridization efficiency, the loop region of the DNA probe was designed as the main portion of the recognition sequence. After miRNA hybridization, the exposed single-strand region labeled with Cy5 could function as the binding site for the primer. Here, it was important that the primer should be incapable of opening the stem-loop DNA probes with the absence of target miRNA. Otherwise, the decline in fluorescence intensity may not originate from the hybridization between miRNAs and DNA probes. Thus, the primer could not contain several bases (more than 4) in succession that were complementary to the loop sequence in the DNA probe. In addition, 2 or 3 bases were used as the spacer between the miRNA strand and the primer after hybridization to effectively initiate the strand displacement. Induced by Klenow fragments, synthesis of double-stranded oligonucleotides using DNA probes as the templates was accompanied by the separation of miRNAs, allowing target cycling in the reaction. Due to the lack of 5′–3′ exonuclease activity, Klenow fragments would not degrade the miRNA strands during the extension of DNA probes. Considering the restricted hybridization efficiency on the surface of AuNPs,41 the number of primers had to be significantly larger than the DNA probes in the system.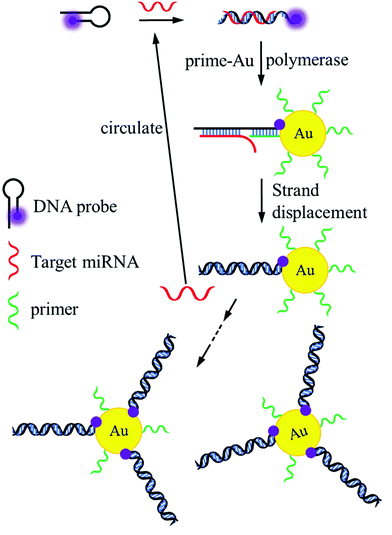 | ||
| Fig. 1 Schematic diagram of the ultrasensitive miRNA sensing platform using target cycling reaction and high quenching efficiency of AuNPs. | ||
As a result of the target cycling mechanism, Cy5 molecules labeled on the DNA probes were continually attached to the surface of AuNPs and quenched due to the FRET effect. The dependence between the fluorescence intensity of Cy5 and the target concentration was established as the standard for miRNA detection. Benefitting from the universal quenching ability of AuNPs, Cy5 can be changed to other fluorescent dyes in the method, such as Fluorescein, Rhodamine 6G, and Texas red. It also demonstrates the capacity of this method in the parallel detection of various miRNAs by using fluorophores with different emission wavelengths.
3.2 Characterization of the probe and feasibility experiments
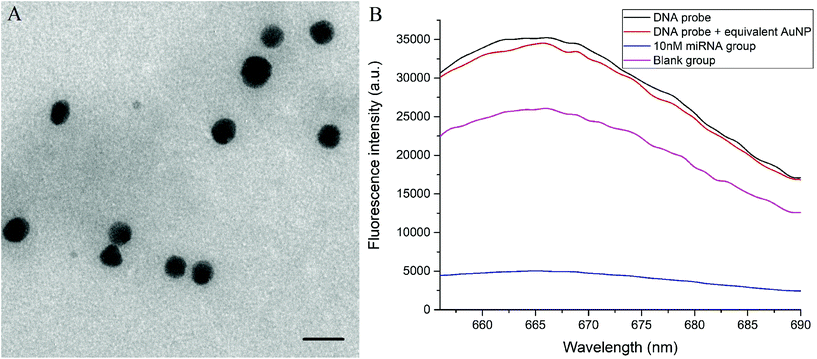
The TEM image of AuNPs is shown in Fig. 2A, and the average diameter of AuNPs was calculated as 6.8 nm using ImageJ software. Controlled experiments for miR-21-5p detection were conducted to validate the feasibility of the method. We set four groups under the same condition (37 °C), and the fluorescence spectra of all groups were recorded after reaction for 2 h (Fig. 2B). The group containing only DNA probes showed the highest fluorescence intensity. The blank group contained all of the reagents involved in the miRNA detection procedure, except for the target strands. It was interesting that the blank group exhibited an approximately 24% reduction of fluorescence intensity at the peak, compared with original DNA probes. The fluorescence decrease was mainly due to the relatively low thermostability of the stem-loop DNA structure at 37 °C.43,44 It was likely that several DNA probes exposed the binding sites for primers and were attached on the surface of each AuNP. The fluorescence reduction resulting from the unstable structure of DNA probes did not influence the detection of miRNA. The experimental group with complete reagents and 10 nM miRNA displayed a significant fluorescence quenching effect, which confirmed the validity of the detection principle. In addition, to eliminate the possible impact of the concentration of AuNPs on fluorescence intensity, the group with DNA probes and naked equivalent AuNPs was also tested. There was little difference between the spectra of DNA probes with and without naked AuNPs, indicating that the concentration of AuNPs was not a major factor in the detection strategy.3.3 Solution studies of method
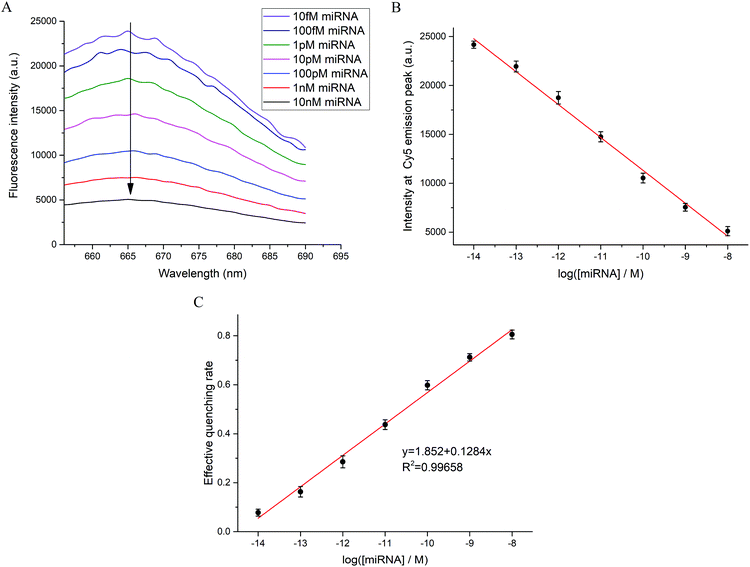
As shown in Fig. 3, solution studies were conducted to obtain the relationship between the fluorescence intensity of Cy5 and the concentration of miRNA. Here, miR-21-5p was chosen as the target. We measured the spectra of reaction systems with different target concentrations from 10 fM to 10 nM (Fig. 3A), and the results demonstrated that fluorescence intensity decreased greatly with increasing target concentrations as expected. We established the relationship between the maximum fluorescence intensity and the logarithm of target concentration (Fig. 3B), which indicated a significant negative linear correlation. To generally display the dependency, the concept of the effective quenching rate was introduced. Considering the fluorescence reduction in the blank group without targets (Fig. 2B), the percentage of the fluorescence decrease in contrast to the blank group was treated as the effective quenching rate. The effective quenching rate could range from 0 to 1 according to its definition. The effective quenching rate also showed a fine linear relationship with the target concentration, and the correlation coefficient was 0.99658 (Fig. 3C). Solution studies further illustrated the practicability of the method for miRNA detection.3.4 Specificity of the method and determination of the detection limit
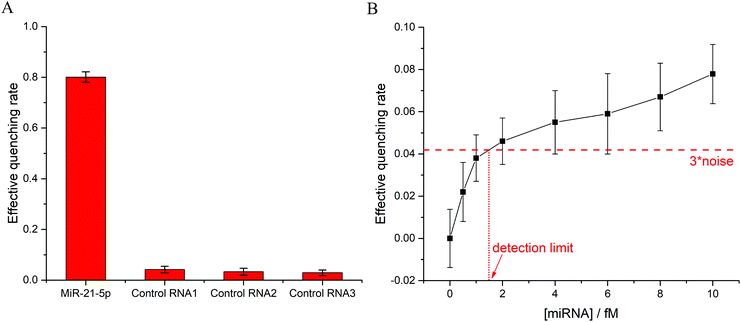
The specificity of the method was investigated using RNA strands with similar sequences as a contrast to target miRNA. Three types of control RNA strands contained one, two, and three mismatched bases with the DNA probe, respectively (Table 1). MiRNA detection was performed using the target miR-21-5p and control RNAs, the result of which is shown in Fig. 4A. All groups with control RNAs exhibited extremely low effective quenching rates, while the group with target strands displayed an approximately 80% decrease in fluorescence intensity. Therefore, the proposed method, which utilized the whole sequence information of target miRNA, possessed the capacity to identify single-base mismatches and distinguish homologous miRNAs with similar sequences.To determine the detection limit of the method, gradient experiments at low concentrations were conducted. As shown in Fig. 4B, the detection limit was calculated as 1.5 fM based on the 3σ principle, which was superior or comparable to that of the reported methods (Table 2). The remarkable detection limit enabled the method to detect low-abundance miRNA in real biological samples.
| Technique | Detection limit | References |
|---|---|---|
| Electrochemiluminescence | 1.1 nM | Shamsi et al.20 |
| Surface plasmon resonance | 1 nM | Loo et al.17 |
| Quartz crystal microbalance | 400 pM | Palaniappan et al.21 |
| Fluorescence polarization | 8.5 pM | He et al.45 |
| Fluorometric | 0.4 pM | Hong et al.46 |
| SERS | 0.17 fM | Li et al.47 |
| Colorimetry | 3.7 fM | Miao et al.19 |
| Target cycling-based FRET | 1.5 fM | This work |
3.5 Kinetic studies of the method
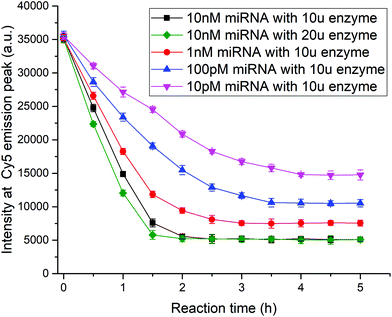
To optimize the experimental parameters, kinetic studies of the method were performed. As the Klenow fragment is a proteolytic product of the E. coli DNA polymerase working at 37 °C, we cannot accelerate the reaction rate by increasing the temperature. Here, two factors, the target concentration and enzyme content, were researched to explore how to shorten the detection time. When the fluorescence intensity no longer changed, the reaction was considered to have reached saturation, and the miRNA detection was complete. As shown in Fig. 5, as the target concentration increased from 10 pM to 10 nM, the reaction time was shortened from 4 h to 2 h using 10 units of enzymes. The results revealed that the target cycling-based reaction was highly parallel in aqueous solution. The comparison between the black and green curves with different amounts of enzymes showed that the increase in enzyme concentration could accelerate the reaction, but the function was slight and limited. After balancing the detection time and costs of reagents, 10 units of Klenow fragments were used in the testing procedure.3.6 Detection of exosomal miRNAs using the method
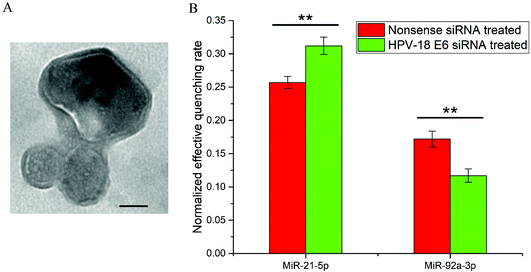
The exosome, a type of extracellular vesicle, plays an important role in intercellular communication and tumor metastasis.48–50 Exosomes contain cell-specific proteins, lipids and nucleic acids. The amount and type of exosomal miRNA are associated with the development of cancers.51 Here, we used the method to detect the content of miRNAs inside exosomes secreted by HeLa cells. From the TEM image of exosomes isolated from cell-culture media (Fig. 6A), the diameters of exosomes were in the range of 40–100 nm. The size and morphology of exosomes were in agreement with the past research.51 In contrast, HeLa cells were treated with nonsense siRNA or HPV-18 E6 siRNA before exosome isolation. Total RNA solution isolated from exosomes was used as the biological samples for miRNA detection. Changes in the expression level of exosomal miRNAs (miR-21-5p and miR-92a-3p) after siRNA treatment were studied, and the involved sequences are represented in Table 1. As shown in Fig. 6B, upregulation of miR-21-5p and downregulation of miR-92a-3p in exosomes were observed upon E6 silencing, which was consistent with the reported results based on deep sequencing studies and qRT-PCR analyses.524. Conclusion
In summary, a novel strategy based on target-assisted FRET signal amplification for the ultrasensitive detection of miRNA has been presented and analyzed. In the method, target miRNAs bridged Cy5-labeled DNA probes and primers on the surface of AuNPs, quenching the fluorescence of Cy5. Induced by strand displacement, recycling of miRNA significantly amplified the FRET signal. Using AuNPs as the remarkable quencher in the target cycling system, the detection limit was lowered to 1.5 fM with a linear range from 10 fM to 10 nM. Based on the concentration gradient and specificity studies, the method was applied in exosomal miRNA detection. The results demonstrated the feasibility and superiority of the method for low-abundance miRNA detection in real samples. The conception of target cycling for signal amplification can be employed in other techniques, such as the detection of DNA, mRNA, and enzyme activities. In future work, the method can be used to realize digital miRNA quantification and single-cell miRNA analysis, combined with droplet microfluidics. It also has great potential in intracellular miRNA detection without cell lysis after further improvement and optimization. Benefitting from its outstanding sensitivity and specificity, the method may make great contributions to miRNA research and cancer diagnosis.Conflicts of interest
There are no conflicts to declare.Acknowledgements
This work is supported by the National Natural Science Foundation of China (No. 61071002), the National Program for Significant Scientific Instruments Development of China (No. 2011YQ030134), the Funds of the State Key Laboratory of China, the Scientific Research Foundation for Returned Overseas Chinese Scholars and the Funds for Beijing Laboratory of Biomedical Detection Technology and Instrument. The authors would thank the support of Beijing Innovation Center for Future Chips.References
- R. C. Lee, R. L. Feinbaum and V. Ambros, Cell, 1993, 75, 843–854 CrossRef CAS PubMed.
- D. P. Bartel, Cell, 2004, 116, 281–297 CrossRef CAS PubMed.
- G. A. Calin and C. M. Croce, Nat. Rev. Cancer, 2006, 6, 857–866 CrossRef CAS PubMed.
- M. Acunzo, G. Romano, D. Wernicke and C. M. Croce, Adv. Biol. Regul., 2015, 57, 1–9 CrossRef CAS PubMed.
- R. Tavallaie, J. McCarroll, M. Le Grand, N. Ariotti, W. Schuhmann, E. Bakker, R. D. Tilley, D. B. Hibbert, M. Kavallaris and J. J. Gooding, Nat. Nanotechnol., 2018, 13, 1066–1071 CrossRef CAS PubMed.
- D. Ren, Y. Xia, B. Wang and Z. You, Anal. Chem., 2016, 88, 4318–4327 CrossRef CAS PubMed.
- Y. Liu, D. Ren, X. Ling, W. Liang, J. Li, Z. You, Y. Yalikun and Y. Tanaka, Sensors, 2018, 18, 3672 CrossRef PubMed.
- S. Guo, W. N. Lin, Y. Hu, G. Sun, D.-T. Phan and C.-H. Chen, Lab Chip, 2018, 18, 1914 RSC.
- D. Madhavan, M. Zucknick, M. Wallwiener, K. Cuk, C. Modugno, M. Scharpff, S. Schott, J. Heil, A. Turchinovich and R. Yang, Clin. Cancer Res., 2012, 18, 5972–5982 CrossRef CAS PubMed.
- Y. Gou, Y. Jia, P. Wang and C. Sun, Sensors, 2018, 18, 1762 CrossRef PubMed.
- C. Chen, D. A. Ridzon, A. J. Broomer, Z. Zhou, D. H. Lee, J. T. Nguyen, M. Barbisin, N. L. Xu, V. R. Mahuvakar and M. R. Andersen, Nucleic Acids Res., 2005, 33, e179 CrossRef PubMed.
- R. Shi and V. L. Chiang, BioTechniques, 2005, 39, 519–525 CrossRef CAS PubMed.
- M. Schwarzkopf and N. A. Pierce, Nucleic Acids Res., 2016, 44, e129 Search PubMed.
- J. Su, D. Wang, L. Nörbel, J. Shen, Z. Zhao, Y. Dou, T. Peng, J. Shi, S. Mathur and C. Fan, Anal. Chem., 2017, 89, 2531–2538 CrossRef CAS PubMed.
- X. Miao, W. Wang, T. Kang, J. Liu, K.-K. Shiu, C.-H. Leung and D.-L. Ma, Biosens. Bioelectron., 2016, 86, 454–458 CrossRef CAS PubMed.
- N. Fu, Y. Hu, S. Shi, S. Ren, W. Liu, S. Su, B. Zhao, L. Weng and L. Wang, Analyst, 2018, 143, 1705–1712 RSC.
- J. F. Loo, S. Wang, F. Peng, J. He, L. He, Y. Guo, D. Gu, H. Kwok, S. Wu and H. Ho, Analyst, 2015, 140, 4566–4575 RSC.
- M. Oishi and S. Sugiyama, Small, 2016, 12, 5153–5158 CrossRef CAS PubMed.
- P. Miao, Y. Tang, Z. Mao and Y. Liu, Part. Part. Syst. Charact., 2017, 34, 1600405 CrossRef.
- M. H. Shamsi, K. Choi, A. H. Ng, M. D. Chamberlain and A. R. Wheeler, Biosens. Bioelectron., 2016, 77, 845–852 CrossRef CAS PubMed.
- A. Palaniappan, J. A. Cheema, D. Rajwar, G. Ammanath, L. Xiaohu, L. S. Koon, W. Yi, U. H. Yildiz and B. Liedberg, Analyst, 2015, 140, 7912–7917 RSC.
- P. Zhang, X. Wu, R. Yuan and Y. Chai, Anal. Chem., 2015, 87, 3202–3207 CrossRef CAS PubMed.
- B. Zhang, B. Liu, G. Chen and D. Tang, Biosens. Bioelectron., 2015, 64, 6–12 CrossRef CAS PubMed.
- L. Liu, N. Xia, H. Liu, X. Kang, X. Liu, C. Xue and X. He, Biosens. Bioelectron., 2014, 53, 399–405 CrossRef CAS PubMed.
- R. Wang, L. Wang, X. Xu and W. Jiang, Sens. Actuators, B, 2018, 268, 287–292 CrossRef CAS.
- Q. Xue, C. Liu, X. Li, L. Dai and H. Wang, Bioconjugate Chem., 2018, 29, 1399–1405 CrossRef CAS PubMed.
- H. Liu, L. Li, Q. Wang, L. Duan and B. Tang, Anal. Chem., 2014, 86, 5487–5493 CrossRef CAS PubMed.
- Q. Xue, Y. Kong, H. Wang and W. Jiang, Chem. Commun., 2017, 53, 10772–10775 RSC.
- Y. Xie, X. Lin, Y. Huang, R. Pan, Z. Zhu, L. Zhou and C. J. Yang, Chem. Commun., 2015, 51, 2156–2158 RSC.
- J. Ge, D.-M. Bai, Y.-L. Hu, Q.-Y. Cai, K. Xing, L. Zhang and Z.-H. Li, Microchim. Acta, 2018, 185, 105 CrossRef PubMed.
- B. Wang, D. Ren, Z. You, Y. Yalikun and Y. Tanaka, Analyst, 2018, 143, 3560–3569 RSC.
- D. Ren, J. Wang, B. Wang and Z. You, Biosens. Bioelectron., 2016, 79, 802–809 CrossRef CAS PubMed.
- K. A. Willets and R. P. Van Duyne, Annu. Rev. Phys. Chem., 2007, 58, 267–297 CrossRef CAS PubMed.
- K. M. Mayer and J. H. Hafner, Chem. Rev., 2011, 111, 3828–3857 CrossRef CAS PubMed.
- C. Yun, A. Javier, T. Jennings, M. Fisher, S. Hira, S. Peterson, B. Hopkins, N. Reich and G. Strouse, J. Am. Chem. Soc., 2005, 127, 3115–3119 CrossRef CAS PubMed.
- T. Jennings, M. Singh and G. Strouse, J. Am. Chem. Soc., 2006, 128, 5462–5467 CrossRef CAS PubMed.
- M. P. Singh and G. F. Strouse, J. Am. Chem. Soc., 2010, 132, 9383–9391 CrossRef CAS PubMed.
- D. Ren, J. Wang and Z. You, RSC Adv., 2014, 4, 54907–54918 RSC.
- H. Zhang, X. Ma, Y. Liu, N. Duan, S. Wu, Z. Wang and B. Xu, Biosens. Bioelectron., 2015, 74, 872–877 CrossRef CAS PubMed.
- G. Acuna, F. Möller, P. Holzmeister, S. Beater, B. Lalkens and P. Tinnefeld, Science, 2012, 338, 506–510 CrossRef CAS PubMed.
- L. M. Demers, C. A. Mirkin, R. C. Mucic, R. A. Reynolds, R. L. Letsinger, R. Elghanian and G. Viswanadham, Anal. Chem., 2000, 72, 5535–5541 CrossRef CAS PubMed.
- B. Wang, Z. Chen, D. Ren and Z. You, Sens. Actuators, B, 2019, 279, 342–350 CrossRef CAS.
- G. Bonnet, S. Tyagi, A. Libchaber and F. R. Kramer, Proc. Natl. Acad. Sci. U. S. A., 1999, 96, 6171–6176 CrossRef CAS.
- L. Wang, C. J. Yang, C. D. Medley, S. A. Benner and W. Tan, J. Am. Chem. Soc., 2005, 127, 15664–15665 CrossRef CAS PubMed.
- Y.-C. He, B.-C. Yin, L. Jiang and B.-C. Ye, Chem. Commun., 2014, 50, 6236–6239 RSC.
- C. Hong, A. Baek, S. S. Hah, W. Jung and D.-E. Kim, Anal. Chem., 2016, 88, 2999–3003 CrossRef CAS PubMed.
- X. Li, S. Ye and X. Luo, Chem. Commun., 2016, 52, 10269–10272 RSC.
- M. Colombo, G. Raposo and C. Théry, Annu. Rev. Cell Dev. Biol., 2014, 30, 255–289 CrossRef CAS PubMed.
- B.-T. Pan and R. M. Johnstone, Cell, 1983, 33, 967–978 CrossRef CAS PubMed.
- H. Valadi, K. Ekström, A. Bossios, M. Sjöstrand, J. J. Lee and J. O. Lötvall, Nat. Cell Biol., 2007, 9, 654–659 CrossRef CAS PubMed.
- J. Zhang, S. Li, L. Li, M. Li, C. Guo, J. Yao and S. Mi, Genomics, Proteomics Bioinf., 2015, 13, 17–24 CrossRef CAS PubMed.
- A. Honegger, D. Schilling, S. Bastian, J. Sponagel, V. Kuryshev, H. Sültmann, M. Scheffner, K. Hoppe-Seyler and F. Hoppe-Seyler, PLoS Pathog., 2015, 11, e1004712 CrossRef PubMed.
| This journal is © The Royal Society of Chemistry 2019 |

