 Open Access Article
Detailed kinetics of substituted phenolic species in pyrolysis bio-oils†
Matteo
Pelucchi
 ,
Carlo
Cavallotti
,
Alberto
Cuoci
,
Tiziano
Faravelli
,
Alessio
Frassoldati
* and
Eliseo
Ranzi
,
Carlo
Cavallotti
,
Alberto
Cuoci
,
Tiziano
Faravelli
,
Alessio
Frassoldati
* and
Eliseo
Ranzi
CRECK Modeling Lab, Department of Chemistry, Materials, and Chemical Engineering, Politecnico di Milano, Italy. E-mail: alessio.frassoldati@polimi.it
First published on 12th December 2018
Abstract
Fast biomass pyrolysis is an effective and promising process to obtain high yields of bio-oils, whose upgrading provides valuable fuels for energy application or chemicals for industry. The growing interest in the use of bio-oils in combustion devices to produce energy motivates this study, in which we present the first comprehensive kinetic model to describe systematically the pyrolysis and combustion of substituted phenolic species, considered as reference components in bio-oil surrogate mixtures. In fact, bio-oils are complex liquid mixtures, containing a large variety of oxygenated organic species. Within these species, substituted phenolic compounds are one of the most significant fractions (∼20–30 wt%). A reliable characterization of the combustion properties and pollution potential of bio-oils strongly depends on the accurate knowledge of their combustion chemistry. While some experimental and kinetic modeling studies on pyrolysis and combustion of phenol, anisole, and catechol are available in the literature, only limited efforts have been devoted to the understanding of the decomposition and oxidation kinetics of guaiacol (2-methoxyphenol) and vanillin (4-hydroxy-3-methoxybenzaldehyde). Accurate theoretical calculations of bond dissociation energies have been performed to assess proximity effects originating from multiple substitutions on the aromatic ring. Based on these evaluations and on previous studies, rate rules and reference kinetic parameters are proposed for major pyrolysis and combustion reaction classes. Satisfactory comparisons of model predictions with experimental data of pyrolysis and combustion of anisole, catechol, guaiacol, and vanillin hierarchically support the development and the reliability of the proposed kinetic model. This work provides a valuable basis for further developments and strongly motivates additional experimental, theoretical, and kinetic modelling efforts in the area of reference components for bio-oil surrogates.
1. Introduction
Lignocellulosic biomass is a promising option for reducing global dependence on fossil fuels. A process of actual industrial interest is the fast pyrolysis of biomass, i.e. a thermal treatment in the absence of oxygen producing liquid fuels, together with some residual char and a fuel gas.1 Although many fundamental challenges still need to be addressed concerning biomass pyrolysis to produce biofuels,2 fast pyrolysis, carried out at temperatures of ∼750–800 K and very short reaction times, gives yields up to 75–80 wt% of liquid fuels, as discussed in a recent review.3 These positive performances allow the integration of fast pyrolysis units into refinery processes,4 making the full implementation of biomass feedstocks for large scale production of fuel and chemicals a viable solution to reduce CO2 and greenhouse gas emissions. Thermal conversion of biomass and product upgrade have been discussed at many levels, from mechanistic models of pyrolysis reactions up to the industrial scale. From a process perspective, Van den Bosch et al.5 presented a thorough technical and economic assessment of an integrated biorefinery to produce phenolic monomers and dimers from lignin. Saidi et al.6 addressed catalyst design matters, highlighting catalyst components and operating conditions favoring the production of higher value hydrocarbons from high oxygen content bio-oils, through hydrodeoxygenation (HDO). More recently, Zaimes et al.7 reported a life cycle assessment of energy consumption and greenhouse gas (GHG) emission of a multistage torrefaction and pyrolysis system to produce bio-oil for transport applications. Compared to single stage fast pyrolysis with HDO, for example, the proposed approach yields 80% reduction in GHG emissions and a significantly higher energy return on investment index.However, the sustainability of bio-oil use for energy production strongly relies on an accurate characterization of bio-oils' physico-chemical and combustion properties such as flame stability, ignition propensity, and pollutant formation potential, thereof requiring the development of reliable kinetic models for their pyrolysis and combustion.
The main objective of this paper is the systematic extension of the CRECK kinetic model to describe the pyrolysis and combustion of reference phenolic compounds of interest for bio-oils, specifically defining reaction classes and rate rules. To this aim, the paper is structured as reported in the following.
Section 2 discusses the relevant properties of pyrolysis bio-oils and the challenges in the kinetic modelling of complex liquid fuel mixtures. A particular focus is devoted to the formulation of appropriate surrogate fuel mixtures (section 2.1) and to the kinetic framework (CRECK kinetic model) developed in this work. Section 3 discusses the theoretical calculation of bond dissociation energies (BDEs), focusing on the effect of multiple substitutions on vicinal bonds. This analysis provides a solid basis for the definition of key reaction pathways of relevance for the different aromatic compounds and for the generalization of their reference kinetic parameters as reported in section 4. Most importantly, the discussion focuses on peculiar pathways in pyrolysis and combustion kinetics of oxygenated aromatic compounds. Experimental results for anisole, guaiacol, catechol and vanillin are compared with model predictions in section 5. Reaction flux and sensitivity analyses highlight relevant pathways and serve as a basis for further investigations and developments, as summarized in section 6.
2. Kinetic modelling of pyrolysis bio-oils
Aiming to provide a broader view of the general context, section 2.1 briefly discusses the relevant properties of bio-oils and the challenges involved in the characterization of complex liquid fuel mixtures. Section 2.2 defines the kinetics framework in which the pyrolysis and combustion chemistry of the species investigated in this study are implemented.2.1 Bio-oil properties, characterization and surrogate mixture formulation
Lehto et al.3 discussed the relevant physical properties (density, viscosity, surface tension, heating value, etc.) and chemical composition of fast pyrolysis bio-oils. Bio-oils have typically ∼5–20 times higher volumetric energy density than the original biomass allowing the development of a sustainable market and the production of valuable and renewable liquid fuels apart from the user end.8 Bio-oils are entirely different from petroleum fuels with regard to both their physical properties and chemical composition. They are a dark-brown acidic liquid (pH ∼2–3) with high water and solid content. Typical heating values are less than a half of those of hydrocarbon fuels. Moreover, some of the peculiar properties of bio-oils, compared to fossil fuels, greatly impact combustion technologies in terms of burner design, flame stability, emissions, and material compatibility. Fast pyrolysis bio-oils are non-flammable, non-distillable, and possess only limited volatility. They contain both a tar and an aqueous fraction (15–30% water), which make them immiscible with conventional liquid hydrocarbon fuels. The aqueous fraction contains low molecular weight (LMW) oxygenated compounds, whereas the tar fraction is constituted by high molecular weight (HMW), water-insoluble lignin fragments (pyrolytic lignin).9 Besides water, bio-oils are composed of complex mixtures of hundreds of organic compounds such as phenolic components, acids, aldehydes, ketones, alcohols, esters, anhydrosugars, furans, and nitrogen containing compounds, as well as large anhydro-oligosaccharides and lignin-derived oligomers.10,11 Oxygenated compounds represent between 50 and 60 wt% of the products.As bio-oil constituents are mostly derived from the pyrolysis reactions of cellulose, hemicellulose, and lignin, their composition depends not only on that of original biomass, but also on the operating conditions of the thermal degradation process.12–14 The dominant products from fast pyrolysis of cellulose were extensively investigated by Broadbelt and co-workers based on detailed mechanistic models.15,16 More recently, the same research group addressed the development of a mechanistic model of hemicellulose pyrolysis based on the reaction classes approach and continuous distribution kinetics.17 Similarly, relevant products from lignin pyrolysis were described by Faravelli et al.18 Those previous studies further confirm the presence of large amounts of phenolic species in the liquid fraction.
As it is typical for complex liquid fuels, kinetic modelling requires the definition of a limited number of reference species accounted for in surrogate fuel formulation. Surrogate mixtures for bio-oils typically include a relevant amount of phenol and more complex phenolic components, such as guaiacol, catechol, and vanillin.19Table 1 reports a surrogate mixture of pyrolysis bio-oil as recently proposed within the “Residue2Heat” research program.8 Vanillin, covering ∼18% in weight, contains three oxygenated functionalities, namely: hydroxyl, methoxy, and aldehydic moieties. For this reason, vanillin is one of the most interesting representatives of the phenolic fractions derived from lignin pyrolysis. Moreover, vanillin is currently one of the molecular phenolic compounds manufactured on an industrial scale from biomass. Thus, it also has the potential to become a key building block for the chemical industry and for the synthesis of bio-based polymers.20 A surrogate mixture of acetic acid, levoglucosan, vanillin, and furanone was also used to perform a thermodynamic analysis of the steam reforming of the aqueous fraction of a pine bio-oil.21
| Component | wt% |
|---|---|
| Water | 22 |
| Acetic acid | 3.9 |
| Ethylene glycol | 5.46 |
| Glycol aldehyde | 5.46 |
| Vanillin | 17.94 |
| Lignin, alkali | 7.8 |
| Levoglucosan | 29.64 |
| 2,5-Dimethylfuran | 5.46 |
| Oleic acid | 2.34 |
2.2 General structure of the kinetic model
This work focuses on the extension of the CRECK kinetic model to phenolic species and vanillin. This kinetic model has been continuously and iteratively developed for about 45 years of research activity at Politecnico di Milano.22 It can describe the pyrolysis and combustion of a large variety of hydrocarbon and oxygenated fuels from syngas up to heavy biodiesel components (i.e. methyl esters), already including many of the species of interest for bio-oils.12,23 Its hierarchical and modular structure, schematically reported in Fig. 1, allows specific kinetic subsets to be easily coupled to describe the formation of pollutants such as NOx24 and soot25,26 to the main fuel mechanism.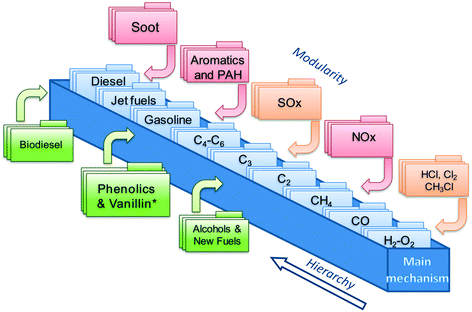 | ||
| Fig. 1 Schematic view of the CRECK kinetic model highlighting the hierarchical and modular nature as well as the “Phenolics and Vanillin” module from the present study. | ||
The iterative development is typically carried out by means of extensive comparisons with experimental data, covering a wide range of operating conditions (T = 500–2300 K, p = 1–100 atm) of interest for real combustion applications (i.e. internal combustion engines, gas turbines, and industrial burners). A complete overview was recently provided by Ranzi et al.,27 together with reduced kinetic models for CFD applications. The extension of the CRECK kinetic model is hierarchically carried out herein moving from the pyrolysis and combustion of catechol (1,2-dihydroxybenzene), to guaiacol (2-metoxyphenol), up to vanillin (4-hydroxy-3-methoxy-benzaldehyde). Rate rules and reference kinetic parameters for this extension are systematically derived from the kinetics of simplest species such as phenol28 and anisole29 and from fundamental theoretical calculations of bond dissociation energies allowing a wiser definition of kinetic parameters based on analogy. Anisole, for example, was extensively used as a very simple surrogate of lignin decomposition products,29,30 because of the methoxy substitution on the aromatic ring. An interesting application of the use of detailed kinetics to explain and interpret experimental measurements of soot formation is provided in the recent study of Atiku et al.,31 where anisole is assumed as a reference species to describe gas phase products released from wood combustion.
Furutani et al.32 theoretically investigated the pyrolysis behaviour of phenol-type monolignol compounds released from the primary heterogeneous pyrolysis of lignin. They observed that all these phenol compounds convert to phenol by side-chain cleavage at high temperatures, whereas the dominant channel below 1000 K produces cyclopentadiene species.33
As already discussed in several papers,34–36 guaiacol is one of the predominant species generated from lignin pyrolysis. The main products of guaiacol pyrolysis at 400–600 °C are phenolic compounds, such as phenol, catechol, and cresol, together with salicylaldehyde (2-hydroxy-benzaldehyde) and benzofuran.37–39 The pyrolysis mechanism of guaiacol was recently investigated using the CBS-QB3 method to determine high-pressure limiting rate constants for several pyrolysis channels.40 Huang et al.41,42 and Liu et al.43,44 also investigated some important reaction pathways in guaiacol pyrolysis based on B3LYP/6-31G++ (d,p) calculations, also explaining the formation of catechol, a relevant precursor of polycyclic-aromatic hydrocarbon (PAH) components. Very recently Zhang et al.45 investigated the anti-knock potential of several substituted phenols, including guaiacol, further highlighting the current interest in this class of compounds for combustion applications, even beyond bio-oils.
Several experimental studies focus on the pyrolysis and oxidation of catechol in laminar flow reactors identifying and quantifying major and minor species, including a large detail on the formation of heavy PAHs.46,47 In contrast, as highlighted by Verma and Kishore,48 very limited activities have been devoted to the investigation of vanillin pyrolysis and combustion. Although two theoretical studies on the pyrolysis of vanillin have been reported in the literature,43,49 Shin et al.50 presented the only experimental data available to date in the temperature range of 500–800 °C. Three sets of lumped products were distinguished: primary (vanillin and its ionization fragments), secondary (guaiacol, catechol, etc.), and tertiary (phenol, benzene, etc.) components.
Based on these literature studies as well as on previous activities on anisole, catechol, and guaiacol,51,52 this paper further discusses the kinetic mechanism of phenolic species and develops a prototype kinetic model of vanillin pyrolysis and oxidation. This kinetic model constitutes a first useful step to characterize the oxidation and combustion behavior of bio-oil surrogate mixtures.
3. Assessment of bond dissociation energies (BDEs)
This section firstly discusses the theoretical methods adopted to determine accurate bond dissociation energies for substituted phenolic species. Results are compared with previous evaluations from the literature and generalized to gain insights into proximity effects. This analysis provides the basis for the successive development of the kinetic model.3.1 Calculation methods
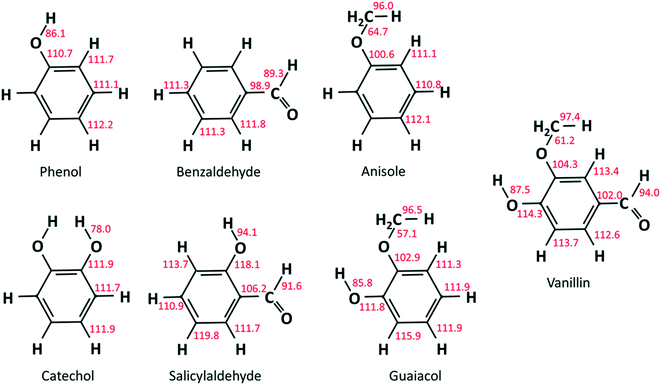
As already discussed in recent studies,51,53 the insertion of different functional groups on an aromatic ring strongly affects the bond dissociation energies of vicinal bonds. As reported in Fig. 2, bond dissociation energies were calculated for vanillin and for a series of mono- and bi-substituted aromatic compounds to systematically investigate such effects. Starting from phenol and catechol, the insertion of an additional hydroxyl function in the ortho position decreases the O–H bond dissociation energies by about 8 kcal mol−1. Strong effects are also observed when comparing the BDEs of the –CHO group in salicylaldehyde (2-hydroxybenzaldehyde) and benzaldehyde, or of the O–CH3 group in guaiacol and anisole (methoxybenzene).Cavallotti et al.51 analyzed the BDEs of catechol and guaiacol finding satisfactory agreement with the BDEs proposed by Ince et al.53 This latter study53 provided the thermodynamic properties of several substituted aromatics together with those of their radicals, generating a database of key thermochemical properties using the G4 method, with bond additivity corrections (BAC). The G4 method typically provides thermochemical properties with a 2σ uncertainty of ∼1.1 kcal mol−1, which clearly improves the ∼2.5 kcal mol−1 uncertainty of the CBS-QB3 method.54 The method adopted here is expected to provide BDEs with an even lower uncertainty.55 The M06-2X method is adopted with a 6-311+G(d,p) basis set to optimize geometries and to map rovibrational properties. This method provides higher quality geometries than G4, which, to that aim, implements the B3LYp functional. In fact, the M06-2X functional is able to account for non-bonding interactions, of particular relevance in aromatic systems. Minimum energy geometries were determined through a stochastic sampling of the dihedral coordinates of the rotating moieties. About 10 stochastic simulations were sufficient to get converged results.
Single point energies were calculated at the M06-2X geometries with the CCSD(T) method56 using the aug-cc-pVTZ basis set.57 This CCSD(T) energy was corrected for basis set effects by adding the difference between energies computed at the density fitting (DF) MP2 level using the aug-cc-pVQZ and aug-cc-pVTZ basis sets:58
| E = ECCSD(T)/aug-cc-pVTZ + EDF−MP2/aug-cc-pVQZ − EDF−MP2/aug-cc-pVTZ | (1) |
Because of the size of molecules and radicals involved in this investigation (up to 9 heavy atoms), the adopted method approaches the maximum level of accuracy achievable at a reasonable computational cost. The coupled cluster calculations of vanillin BDEs took about two weeks on a last generation workstation (20 cores, 128 GB RAM, solid-state disks).
3.2 Results and proximity effects
Results from our calculations of vanillin BDEs are compared in Fig. 3 with the values proposed by Shin et al.50 and by Verma and Kishore.48 The two studies presented B3LYP calculations, with the only difference lying in the selected basis set. Shin et al.50 used a Dunning cc-pVDZ basis set, whereas Verma and Kishore48 used Pople's 6-311G(d,p). Due to the large differences in the C–O bond energy (64.7 kcal mol−1 and 57 kcal mol−1) reported by these authors, we also computed DFT level energies using the M06-2X functional and the 6-311G(d,p) basis set (Fig. 3) to assess these previous controversial evaluations. In terms of general agreement, our determination better agrees with the results from Shin et al.50 Starting from the C–O bond (B1), we computed a BDE of 63 kcal mol−1 at the DFT level and 61.2 kcal mol−1 at the higher level discussed in section 3.1. Generally, M06-2X level BDEs agree with higher level BDEs within 2 kcal mol−1. However, large discrepancies are also observed with the work of Shin et al.50 mainly for bonds B5 and B6 in Fig. 3 (∼5 kcal and ∼10 kcal mol−1). Such errors are typical of B3LYP energy estimations, which may fail to properly compute the correlation energy for some systems. A better agreement is observed with the BDEs estimated by Ince et al.53 for the different bonds in catechol, guaiacol, and salicylaldehyde. The two calculations agree within ∼0.5–1.5 kcal mol−1, as expected from the accuracy of both methods.51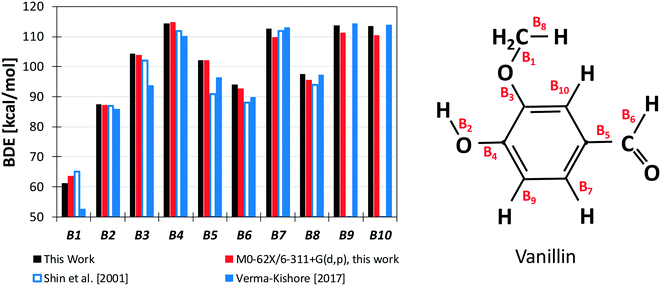 | ||
| Fig. 3 BDEs of vanillin [kcal mol−1]. Comparison of literature48,50 and predicted values. | ||
However, the BDEs in vanillin clearly indicate that the breaking of the B1 bond with the formation of methyl and phenoxy radicals largely the favors the radical chain initiation reaction of vanillin. Moreover, the lower dissociation energies of H atoms in B2 and B6 reveal the preferred H-abstraction sites producing fuel radicals (see section 4.2).
Fig. 4a compares the BDEs of the hydroxyl group, in vanillin, phenol, catechol, salicylaldehyde and guaiacol. Catechol has the lowest BDE for the (B2) O–H bond (78 kcal mol−1), whereas salicylaldehyde presents the maximum value (94.1 kcal mol−1). Similarly, salicylaldehyde has the highest BDE within the B4 bonds (118.1 kcal mol−1). This value is well above the corresponding value in phenol (110.7 kcal mol−1).
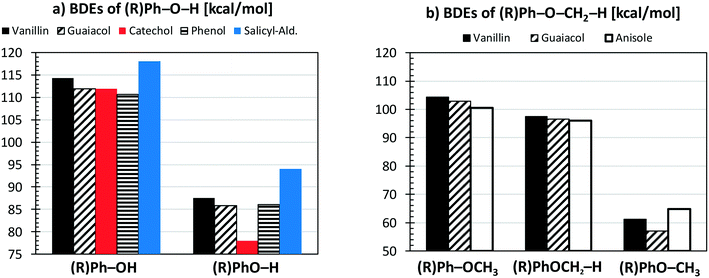 | ||
| Fig. 4 Comparison of vanillin BDEs [kcal mol−1] with respect to different aromatic compounds. Panel a) hydroxyl group; panel b) methoxy group. | ||
Fig. 4b compares the BDEs related to the methoxy group in vanillin, guaiacol, and anisole. The O–CH3 bond (B1) is always the weakest one, with a dissociation energy ranging from 57.1 kcal mol−1 in guaiacol to 64.7 kcal mol−1 in anisole. More similar values are observed for B3 and B8 bonds. The primary C–H bond in the methyl group has a BDE of 96.0–97.4 kcal mol−1, whereas the BDE of the (R)Ph–OCH3 bond is 100.6–104.3 kcal mol−1. Finally, C–H bonds on the aromatic ring maintain similar values of 111.1–113.7 kcal mol−1, with an exception made for the para-position with respect to the OH group of salicylaldehyde (119.8 kcal mol−1) and of guaiacol (115.9 kcal mol−1).
Because of the additional OH group, a systematic increase of the BDE is observed for C–H bonds forming phenyl-like radicals for all phenolic species. In the case of salicylaldehyde, the BDE of the C–H bond in the ortho position to the hydroxyl moiety increases by ∼2 kcal mol−1 (111.1–113.7 kcal mol−1). A similar variation for the analogous position is observed for guaiacol, with a BDE of 115.9 kcal mol−1. Moreover, a larger increase of ∼7 kcal mol−1 is observed in salicylaldehyde (119.8 kcal mol−1) for the previously mentioned C–H bond. Due to these strong bond energies, the formation of phenyl-like radicals, through H-abstraction reactions is largely less favored.
4. Kinetic model
The CRECK model adopted in this work (498 species and 13![[thin space (1/6-em)]](https://www.rsc.org/images/entities/char_2009.gif) 775 reactions) implements a C0–C3 core subset obtained by coupling the H2/O2 and C1/C2 from Metcalfe et al.,59C3 from Burke et al.,60 and heavier fuels from Ranzi et al.27,61 The formation and oxidation of large PAHs is also accounted for according to the recent work of Warumporn et al.26 The thermochemical properties were adopted, when available, from the ATcT database of Ruscic62 or from Burcat's database,63 and from the BDE calculations for phenolic species discussed in section 3. The complete kinetic model in the CHEMKIN format, with thermodynamic properties, is available in the ESI,† together with the nomenclature of relevant species from the pyrolysis and oxidation of phenolic components (Table S1†). Numerical simulations have been carried out using the OpenSMOKE++ framework.64
775 reactions) implements a C0–C3 core subset obtained by coupling the H2/O2 and C1/C2 from Metcalfe et al.,59C3 from Burke et al.,60 and heavier fuels from Ranzi et al.27,61 The formation and oxidation of large PAHs is also accounted for according to the recent work of Warumporn et al.26 The thermochemical properties were adopted, when available, from the ATcT database of Ruscic62 or from Burcat's database,63 and from the BDE calculations for phenolic species discussed in section 3. The complete kinetic model in the CHEMKIN format, with thermodynamic properties, is available in the ESI,† together with the nomenclature of relevant species from the pyrolysis and oxidation of phenolic components (Table S1†). Numerical simulations have been carried out using the OpenSMOKE++ framework.64
Fig. 5 schematically shows the kinetic mechanism of guaiacol decomposition. The major reaction classes are chain initiation and H-abstraction reactions, together with ipso-addition reactions. Catechol is mainly formed through the successive H-abstraction reaction of the phenoxy-phenol radical formed in the chain initiation reaction. As theoretically investigated by Huang et al.,41 salicylaldehyde is the favored decomposition product of H-abstraction reactions of guaiacol, through a fast dehydrogenation of the intermediate radicals. Anisole, phenol, and cresol are the products of ipso-addition reactions. The BDEs shown in Fig. 2 are very useful for defining not only the activation energies of the chain initiation reactions but also the relative importance of competitive H-abstraction pathways.
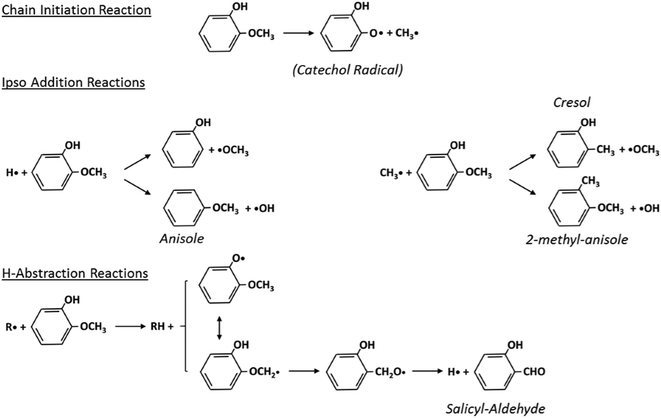 | ||
| Fig. 5 Kinetic mechanism of guaiacol decomposition41 and major reaction classes. | ||
4.1 Chain initiation reactions
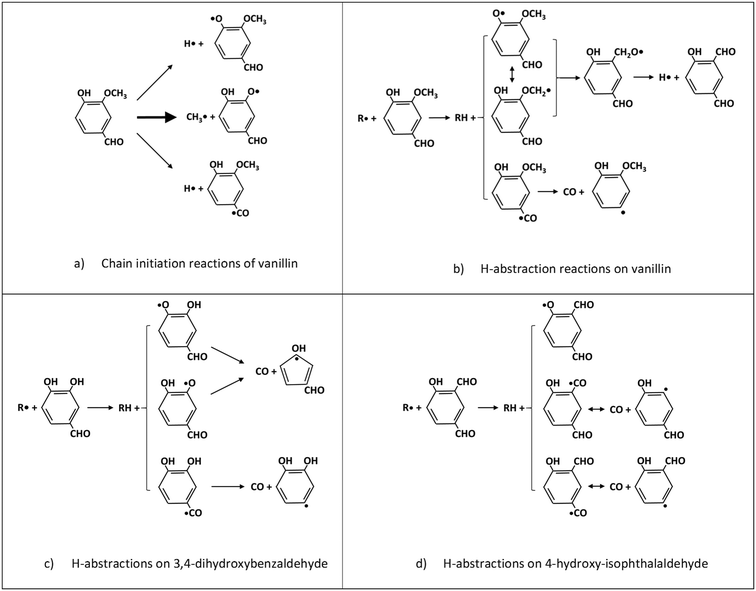
The BDEs of C–C, C–O, and C–H presented in section 2 are used to estimate unimolecular decomposition reactions, responsible for radical chain initiation. Based on the microscopic reversibility principle, it is practical to evaluate the rate constant of initiation reactions from the rate constant of reverse radical recombination reactions. In fact, when the activation energy of the recombination reactions is assigned at the high-pressure limit, the BDE allows the activation energy of the reverse dissociation reaction to be derived. Favored initiation reactions are the ones involving the lower BDEs. Fig. 6a shows the three favored dissociation reactions for vanillin. Indeed, the remaining homolysis channels would involve much larger activation energies and are therefore disregarded. The favored and dominant substituted phenoxy radical (C7H5O3) can either abstract a hydrogen forming 3,4-dihydroxybenzaldehyde, or decompose losing CO and forming cyclopentadienylic radicals. Table 2 reports the high-pressure limit rate constants adopted for the main chain initiation reactions, according to the BDEs shown in Fig. 2. The limited variability of frequency factors (1 ÷ 3 × 10¹⁵ s−1) for similar chain initiation pathways is mainly justified by an improved agreement with macroscopic experimental targets.52![[thin space (1/6-em)]](https://www.rsc.org/images/entities/char_2009.gif) exp(−Ea/RT). Activation energies (Ea) in cal mol−1
exp(−Ea/RT). Activation energies (Ea) in cal mol−1
| Reaction | Rate constant k(T) [s−1] |
|---|---|
| Phenol ↔ H + C6H5O | 1.0 × 10¹⁵ exp(−86![[thin space (1/6-em)]](https://www.rsc.org/images/entities/char_2009.gif) 100/RT) 100/RT) |
| Catechol ↔ H + C6H5O2 | 2.0 × 10¹⁵ exp(−78![[thin space (1/6-em)]](https://www.rsc.org/images/entities/char_2009.gif) 000/RT) 000/RT) |
| Benzaldehyde ↔ H + C6H5CO | 3.0 × 10¹⁵ exp(−89![[thin space (1/6-em)]](https://www.rsc.org/images/entities/char_2009.gif) 300/RT) 300/RT) |
| Anisole ↔ CH3 + C6H5O | 3.0 × 10¹⁵ exp(−64![[thin space (1/6-em)]](https://www.rsc.org/images/entities/char_2009.gif) 700/RT) 700/RT) |
| Salicylaldehyde ↔ H + OHC6H5CO | 3.0 × 10¹⁵ exp(−91![[thin space (1/6-em)]](https://www.rsc.org/images/entities/char_2009.gif) 600/RT) 600/RT) |
| Guaiacol ↔ CH3 + C6H5O2 | 2.0 × 10¹⁵ exp(−58![[thin space (1/6-em)]](https://www.rsc.org/images/entities/char_2009.gif) 000/RT) 000/RT) |
| Vanillin ↔ CH3 + C7H5O3 | 1.0 × 10¹⁵ exp(−61![[thin space (1/6-em)]](https://www.rsc.org/images/entities/char_2009.gif) 200/RT) 200/RT) |
4.2 H-abstraction reactions
H-abstraction reactions are relevant in defining system reactivity and selectivity to products. Rate constants of the generic reaction: R˙ + R′H ↔ R′˙ + R H depend on the properties of the abstracting radical and the type of hydrogen to be abstracted.65 H-atoms can be removed mainly based on the strength of the corresponding C–H bond. Rate rules for the different R˙ abstracting radicals are expressed in the modified Arrhenius form: | (2) |
3,4-Dihydroxybenzaldehyde is an important primary intermediate formed from the H-abstraction of the phenoxy radical produced by the favored vanillin initiation reaction (Fig. 6a and c). 4-Hydroxy-isophthalaldehyde is another important intermediate formed from the successive decomposition of the 2-methoxy-3-phenoxy-benzaldehyde radical, which is the preferred intermediate from H-abstraction reactions on vanillin (Fig. 6b and d). For this reason, Fig. 6c and d illustrate the dominant H-abstraction reactions involving these species, together with the fate of major intermediates.
4.3 Ipso-addition reactions
Ipso-addition reactions of H to catechol can sequentially form phenol and benzene, whereas anisole and phenol are the primary products of ipso-additions on guaiacol. Similarly, vanillin can form guaiacol and salicylaldehyde, together with 3-methoxy-benzaldehyde. The rate constants of this reaction class conveniently rely on the reference reactions and kinetic parameters reported in Table 3.| Reaction | k fwd(T) [cm3 mol−1 s−1] | k back(T) [cm3 mol−1 s−1] |
|---|---|---|
| H + toluene ↔ CH3 + benzene | 1.2 × 10¹³ exp(−5100/RT) | 1.2 × 10¹² exp(−15![[thin space (1/6-em)]](https://www.rsc.org/images/entities/char_2009.gif) 200/RT) 200/RT) |
| H + phenol ↔ OH + benzene | 1.2 × 10¹³ exp(−7000/RT) | 4.7 × 10¹² exp(−8600/RT) |
| H + cresol ↔ CH3 + phenol | 1.5 × 10¹³ exp(−5000/RT) | 0.4 × 10¹² exp(−15![[thin space (1/6-em)]](https://www.rsc.org/images/entities/char_2009.gif) 300/RT) 300/RT) |
| H + anisole ↔ CH3O + benzene | 1.2 × 10¹³ exp(−5500/RT) | 1.3 × 10¹² exp(−18![[thin space (1/6-em)]](https://www.rsc.org/images/entities/char_2009.gif) 000/RT) 000/RT) |
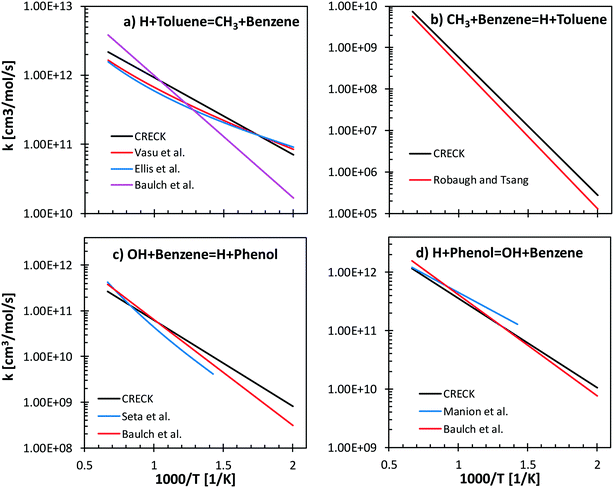
Reverse reactions are estimated by fitting the rate constants using Gibbs free energy in the temperature range (500–2000 K). Literature values of forward and backward reactions for H + toluene ↔ CH3 + benzene66–69 and for OH + benzene ↔ H + phenol70,71 are compared with the proposed rate rules27,72 in Fig. 7. Concerning H/CH3 substitution in toluene, the literature values agree within a factor of 2.5 ÷ 5 in the temperature range 500–1500 K for the forward reaction (Fig. 7a). In particular, only a factor of 1.3 difference is observed between our proposed reference kinetic parameter and that from Vasu et al.68 and Ellis et al.67 Concerning the reverse reaction (Fig. 7b), good agreement is found between the proposed values and those from the shock tube measurements by Robaugh and Tsang.69 It should be underlined that the work of Robaugh and Tsang69 is the only experimental investigation concerning this pathway reported in the literature at present. Additional investigations would be beneficial to further constrain the rate parameters for substituted aromatic species.
Seta et al.70 investigated both theoretically and experimentally the OH + benzene (Fig. 7c) system in the temperature range 700–1900 K. Energy barriers of both the H-abstraction and the ipso-addition channels were adjusted to match the experimental measurements of the total rate constant. The rate rules adopted in our model agree within a factor of 1–3 with the data of Seta and co-workers and with recommendations by Baulch et al.66 Similar trends are observed for the reverse rate constant (Fig. 7d), where the largest discrepancy is observed with respect to the parameters from the experimental study of Manion and Louw.71
From the above discussion, Table 4 summarizes the main ipso-addition reactions included in the kinetic mechanism of substituted aromatics and phenolic components.
| Reaction | k(T) [cm3 mol−1 s−1] |
|---|---|
| H + catechol ↔ OH + phenol | 2.0 ×10¹³ exp(−5000/RT) |
| H + guaiacol ↔ OH + anisole | 1.0 × 10¹³ exp(−6000/RT) |
| H + guaiacol ↔ CH3O + phenol | 3.0 × 10¹² exp(−6000/RT) |
| H + benzaldehyde ↔ HCO + benzene | 1.2 × 10¹³ exp(−5000/RT) |
| H + salicyl-ald. ↔ OH + benzaldehyde | 1.0 × 10¹³ exp(−5000/RT) |
| H + salicyl-ald. ↔ HCO + phenol | 1.0 × 10¹³ exp(−5000/RT) |
| H + vanillin ↔ CH3O + salicyl-ald. | 1.0 × 10¹³ exp(−5000/RT) |
| H + vanillin ↔ HCO + guaiacol | 1.2 × 10¹³ exp(−5000/RT) |
| OH + cresol ↔ CH3 + catechol | 2.0 × 10¹³ exp(−5500/RT) |
| OH + guaiacol ↔ CH3O + catechol | 3.0 × 10¹³ exp(−5000/RT) |
| OH + vanillin ↔ CH3O + C7H6O3 | 1.5 × 10¹³ exp(−6000/RT) |
| CH3 + guaiacol ↔ CH3O + cresol | 1.5 × 10¹² exp(−15![[thin space (1/6-em)]](https://www.rsc.org/images/entities/char_2009.gif) 000/RT) 000/RT) |
4.4 Molecular reactions
Molecular reactions are generally very important for the decomposition of oxygenated species. The weakening of vicinal bonds derived from the insertion of an oxygenated functional group strongly affects fuel unimolecular decompositions, activating concerted molecular pathways that can compete with conventional radical pathways (section 4.1). The dehydration reaction of alcohols and glycol already provides some reference kinetic parameters.73Fig. 8 shows the molecular decomposition of catechol to form butadiene and two CO molecules, via hydroxyl H migration to a neighboring C–H group.74 The high pressure limit rate constant for this channel is k(T) = 5.0 × 10¹¹ exp(−67![[thin space (1/6-em)]](https://www.rsc.org/images/entities/char_2009.gif) 000/RT) [s−1]. Additional molecular reaction channels might be active under the conditions of interest; therefore further theoretical investigations and crosschecking with experimental evidence are necessary.
000/RT) [s−1]. Additional molecular reaction channels might be active under the conditions of interest; therefore further theoretical investigations and crosschecking with experimental evidence are necessary.
 | ||
| Fig. 8 Molecular reaction for catechol decomposition.74 | ||
4.5 Successive reactions of aromatic species and PAH formation
Saggese et al.28 already discussed the successive reactions of phenol and aromatic species to form polycyclic aromatic hydrocarbons (PAHs) and soot. Successive reactions of PAH species to form soot particles are discussed and reported elsewhere,25,26 whereas the reactions of PAHs are considered in the gas-phase mechanism reported in the ESI.† Moreover, the modular structure of the CRECK model described in section 2.2 allows the effective inclusion of the soot formation and oxidation mechanism.25,265. Results and discussion
This section compares model predictions with experimental measurements of pyrolysis and combustion of substituted phenolic species from anisole up to vanillin, whose kinetic mechanism is the ultimate goal of this study. Kinetic analysis allows the understanding of specific features and key reaction pathways.5.1 Anisole, catechol, and guaiacol
Fig. 9 shows the comparisons between model predictions and the experimental data recently reported by Wagnon et al.75 They refer to anisole oxidation experiments carried out in an Orleans jet stirred reactor (JSR) at 675–1275 K and atmospheric pressure, under lean (φ = 0.5) and fuel rich (φ = 2.0) conditions. Model predictions are reasonably within the experimental uncertainties, and the quality of the agreement is similar to that already discussed by Wagnon and co-workers. Moreover, several deviations, particularly those of benzene and cresol, show opposite trends with respect to the comparisons with the experimental data obtained in the JSR performed in Nancy,30 as already discussed in ref. 52.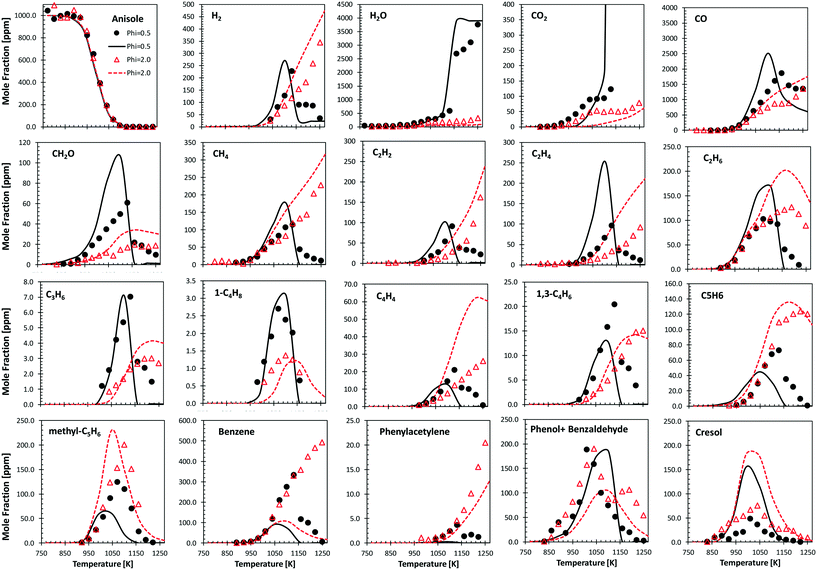 | ||
| Fig. 9 Anisole atmospheric pressure oxidation in an Orleans JSR.75 0.1% anisole/O2/N2 mixtures under rich (φ = 2.0, triangles) and lean conditions (φ = 0.5, circles). Comparisons between experimental data (symbols) and model predictions (lines). | ||
Zabeti et al.76 investigated anisole pyrolysis behind shock-heated waves, comparing their experimental results with a previous version of the CRECK model. Comparisons with the present version are reported in Fig. 10, showing improved agreement in terms of fuel conversion, CO, and ethylene yields for both the investigated cases. Benzene is still underpredicted by a factor of ∼2, further confirming the observation reported in Fig. 9, which remains in conflict with the measurements of Nowakowska et al.30
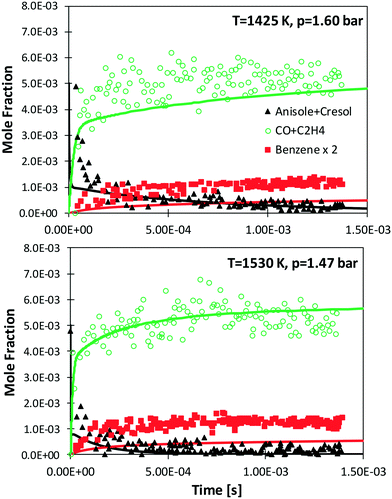 | ||
| Fig. 10 Measured (symbols)76 and simulated (lines) species profiles of main species during the shock-tube pyrolysis of 0.5% anisole, 1% Ar in Ne. | ||
Following the discussion above, catechol, salicylaldehyde, and cresol are primary products from guaiacol, whereas phenol formation is mostly due to successive reactions of intermediate species. Fig. 11 shows a comparison with low temperature pyrolysis data.77 The kinetic model is able to correctly predict the relative selectivity to different products (i.e. moles/moles of converted guaiacol), in particular the dominant formation of catechol. The model also predicts a high initial formation of salicylaldehyde, not detected experimentally. By means of analogy with anisole, it is possible to unravel the quantitative importance of aldehyde formation from substituted oxygenated aromatics by looking at Fig. 9. At the onset of anisole reactivity in the JSR experiments (T ∼950 K), benzaldehyde and phenol are the primary intermediates as confirmed by their rising concentration for very low fuel conversions. In the same way it is reasonable to expect a similar pathway arising from the methoxy functional group in guaiacol. The yields of phenol and cresol correctly reproduce the experimental data. Moreover, these selectivities clearly show the sequential formation of cresol, as the primary decomposition product, and that of phenol, as the secondary product.
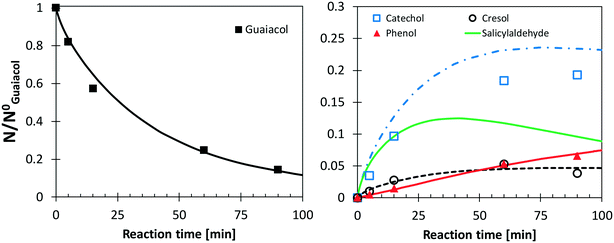 | ||
| Fig. 11 Yields and selectivities of major products in guaiacol pyrolysis at 656 K. Experimental data (symbols)77 and model predictions (lines). | ||
Fig. 12 shows a very detailed comparison of the major and minor products in catechol pyrolysis and oxidation with oxygen ratios ranging from pure pyrolysis up to near stoichiometric oxidation (φ = 0.92).47 Experiments were conducted at a residence time of 0.3 s and T = 500–1000 °C. Catechol pyrolysis and fuel-rich oxidation produce a range of light hydrocarbons as well as several aromatic species. The kinetic model overestimates slightly (∼20 K) the onset of reactivity for pyrolysis conditions and for the leanest case (φ = 0.22). A general satisfactory agreement is shown for the different decomposition products. The effect of increasing oxygen content is correctly captured. An interesting feature is gained by looking at the agreement of butadiene profiles. Under these conditions, butadiene is in fact mostly produced by the molecular reaction briefly discussed above (section 3.4).
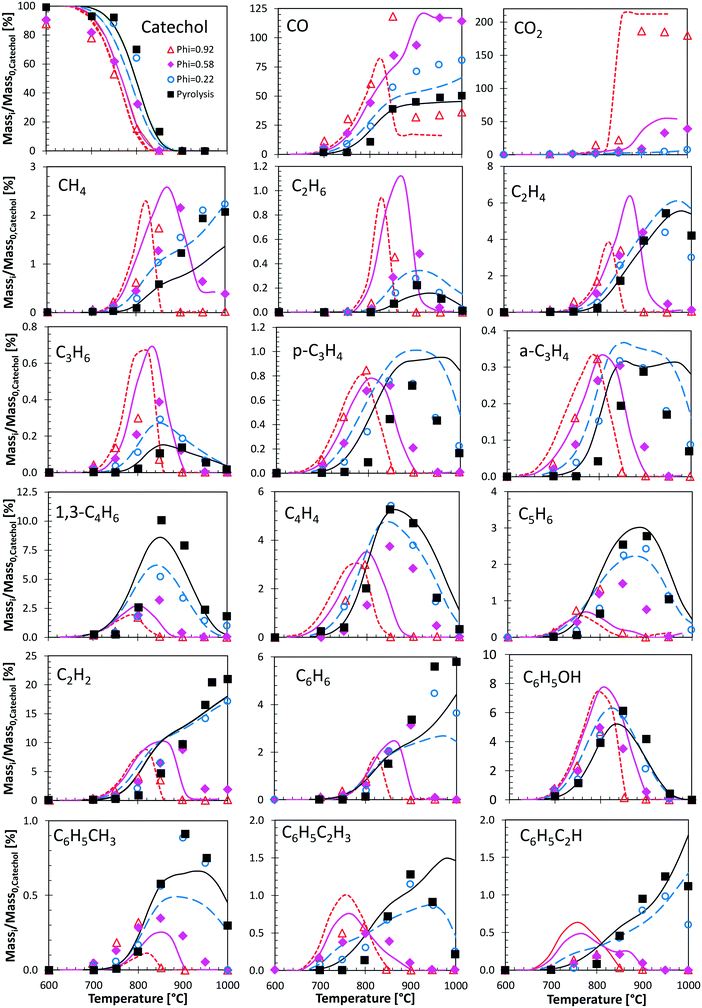 | ||
| Fig. 12 Catechol pyrolysis and oxidation at p = 1 atm and τ = 0.3 seconds. Species yields vs. temperature. Comparison between model predictions (lines) and experimental data (symbols).47 | ||
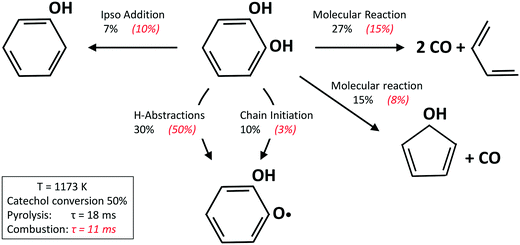
Fig. 13 shows a simplified analysis of major reaction fluxes, for both pyrolysis and combustion (φ = 0.92) conditions at 1173 K and 50% catechol conversion. Catechol decomposition proceeds mainly through H-abstraction reactions, which are more relevant under oxidative conditions due to the dominant role of hydroxyl radicals. Together with the molecular reaction to form butadiene,74 2,4-cyclopentadien-1-ol is an additional product of molecular pathways. The adopted rate parameters are the same as those of the analogous reaction of phenol to form cyclopentadiene and CO.28Fig. 14 shows that the model also correctly captures the large production of aromatic species and the growth of PAHs up to 7 rings. Particular attention was experimentally devoted to the study of the interactions between catechol and unsaturated species, such as propyne78 and butadiene,79 mainly to highlight the relevant formation of PAHs.
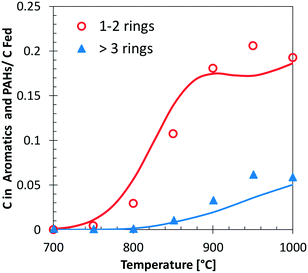 | ||
| Fig. 14 Carbon (C) in 1–2 ring aromatics and heavier PAHs from catechol pyrolysis at p = 1 atm and τ = 0.3 s. Comparison between model predictions (lines) and experimental data (symbols with dashed lines).47 | ||
5.2 Vanillin
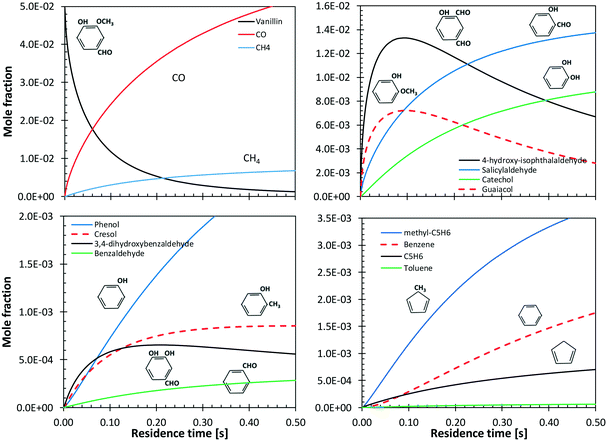
Shin et al.50 studied the gas-phase pyrolysis of vanillin, providing temporal profiles of lumped products at temperatures between 500 and 800 °C. Although the paper discusses the composition of intermediate components, only lumped primary (vanillin and its ionization fragments), secondary, and tertiary products were presented. The secondary component contains single ring oxygenated compounds that are formed directly from the decomposition of vanillin. The third lumped component constitutes the remaining portion of the reacting mixture. At high temperature and relatively long residence time, the third component is composed mostly of aromatic compounds, including benzofuran, naphthalene, and heavier PAHs.Fig. 15 shows a comparison with model predictions. The kinetic model correctly captures the overall reactivity as a function of temperature and the relative yields of lumped secondary and tertiary products, within plausible experimental uncertainty. Fig. 16 shows a more exhaustive detail of primary and secondary intermediates at 873 K, highlighting the importance of 4-hydroxy-isophthalaldehyde together with salicylaldehyde and catechol.
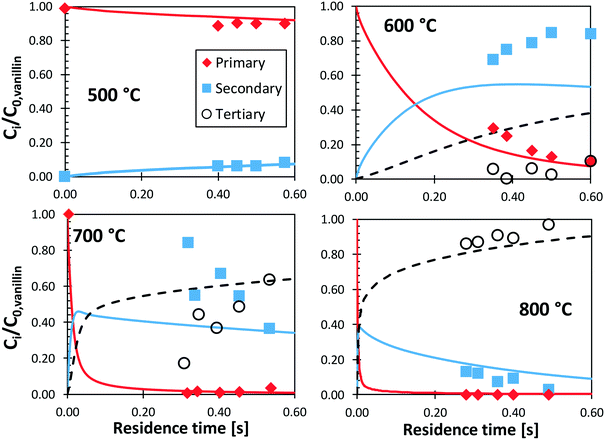 | ||
| Fig. 15 Vanillin pyrolysis. Molar yields of vanillin, secondary, and tertiary (dashed) lumped products vs. residence time. Comparison between model predictions (lines) and experimental data (symbols).50 | ||
In order to better explore the role of the different reaction classes in the vanillin pyrolysis mechanism, Fig. 17 shows the sensitivity analysis of phenol (panel a) and guaiacol (panel b) formation at 973 K and 50% vanillin conversion. The three most sensitive reactions of phenol formation are the ipso-addition of catechol and salicylaldehyde, as well as the chain initiation reaction of guaiacol, which favors the radical pool and thus the fuel conversion process. The above reactions have positive sensitivity coefficients; therefore they favor the formation of phenol. In contrast, the H recombination to form catechol, and the H-abstraction reactions by H radicals from vanillin and intermediate products have negative sensitivity coefficients. Panel b) shows that the guaiacol initiation reaction has the most negative sensitivity coefficient, whereas its formation occurs through the ipso-addition reaction of vanillin, as well as via the H-abstraction on vanillin and the successive H-abstractions of the formed phenyl radical of guaiacol.
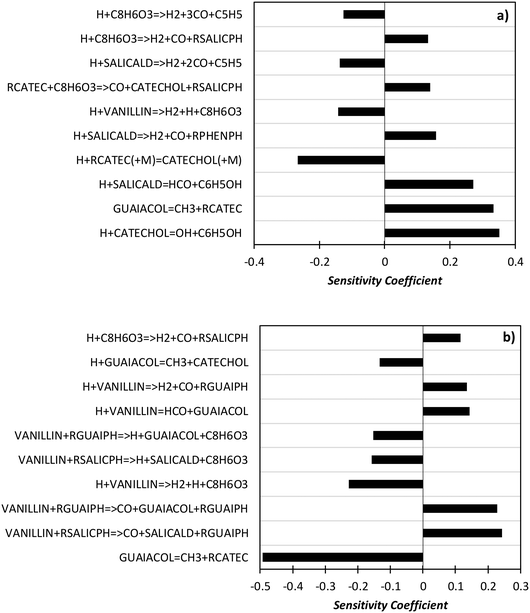 | ||
| Fig. 17 Sensitivity analysis of phenol (panel a) and guaiacol (panel b) at 973 K and 50% vanillin conversion. | ||
Benzene and aromatic components are formed in larger amounts at high severity, i.e. high temperatures and long residence times. Fig. 18 shows a continuous rise of benzene and naphthalene formation, and highlights a maximum in styrene mole fractions, because of the successive condensation reactions and growth of aromatic species, through the HACA mechanism.80
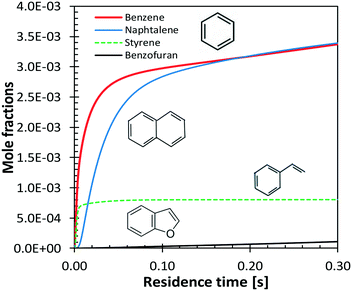 | ||
| Fig. 18 Vanillin pyrolysis. Successive formation of benzene, styrene, naphthalene, and benzofuran, at 1073 K. | ||
6. Conclusions
This paper presents and discusses accurate evaluations of bond dissociation energies of vanillin and substituted aromatic species, highlighting the effect of multiple substitutions and proximity effects on aromatic rings. Based on the theoretically determined BDEs of these oxygenated components, an explorative lumped kinetic scheme describing the pyrolysis and oxidation of vanillin has been hierarchically developed starting from catechol, anisole, and guaiacol. A reasonable number of theoretical and kinetic studies on phenolic components have been presented in the literature. However, to our knowledge, this model is the first one aiming at describing the pyrolysis and combustion behavior of vanillin and phenolic species with multiple substitutions, often adopted as reference components in surrogate mixtures of bio-oils from fast pyrolysis of biomass. Comparisons with experimental data support the reliability of the present model.Although this kinetic mechanism constitutes the first valuable basis for further modelling efforts, and for more fundamental estimates of rate constants in the area of bio-oils, it is evident that further improvements are strongly limited by the scarcity of experimental data, whose acquisition constitutes at present the major priority. In particular, while anisole is attracting growing interest, measurements are strongly encouraged for other reference bio-oils components such as guaiacol, catechol and vanillin. Moreover, experimental data for phenol would be of paramount importance not only because of its relevance as an intermediate in the combustion of oxygenated aromatics with multiple substitutions and for anisole itself, but also in benzene chemistry and therefore in PAH growth and oxidation.
The definition of reaction classes and rate rules here presented would in fact benefit from further experimental evidence such as speciation measurements, of relevance in assessing selectivity to different products. These data could also highlight the possible existence of new and specific pathways, such as additional molecular reactions typically relevant in oxygenated fuels. Ignition delay time and laminar flame speed measurements would be also needed to better characterize the overall reactivity of bio-oils, paving the way for their use in energy systems.
The modular and hierarchical structure of the CRECK model permits the primary reactions of phenolic species to be easily coupled with the formation of pollutant and soot precursors like PAHs, both under pyrolysis and combustion conditions. This is of paramount importance in the case of phenolic compounds, where the significant presence of the aromatic ring in the fuel structure makes these species highly prone to form soot. This is another aspect which will require specific experimental activities.
The gas phase kinetic model is useful to describe the combustion properties of bio-oils in terms of reactivity of evaporated compounds, auto ignition behaviour, flame propagation and pollutant formation. This work simply focuses on the chemical kinetics of the phenolic fraction of the surrogate mixture, but the characterization of its physical properties is also necessary, as it strongly influences the behavior of bio-oil droplet evaporation and combustion. In particular, density, viscosity, and surface tension are important parameters that affect the pump design and atomization quality, thus directly impacting the combustion efficiency and emissions. Finally, a further difficulty is that the initial combustion of volatile compounds, which readily evaporate from the bio-oil droplet, favors polymerization and pyrolysis reactions of heavier compounds in the liquid phase. Therefore, reactions in the condensed phase will also have to be addressed in future studies.
Conflicts of interest
There are no conflicts to declare.Acknowledgements
The authors gratefully acknowledge the financial support for this research provided by the European Union under the Horizon 2020 research and innovation programme (Residue2Heat project, G.A. No 654650).References
- A. V. Bridgwater, Biomass Bioenergy, 2012, 38, 68–94 CrossRef CAS
.
- M. S. Mettler, D. G. Vlachos and P. J. Dauenhauer, Energy Environ. Sci., 2012, 5, 7797–7809 RSC
.
- J. Lehto, A. Oasmaa, Y. Solantausta, M. Kytö and D. Chiaramonti, Appl. Energy, 2014, 116, 178–190 CrossRef CAS
.
- J. A. Melero, J. Iglesias and A. Garcia, Energy Environ. Sci., 2012, 5, 7393–7420 RSC
.
- S. Van den Bosch, W. Schutyser, R. Vanholme, T. Driessen, S.-F. Koelewijn, T. Renders, B. De Meester, W. Huijgen, W. Dehaen and C. Courtin, Energy Environ. Sci., 2015, 8, 1748–1763 RSC
.
- M. Saidi, F. Samimi, D. Karimipourfard, T. Nimmanwudipong, B. C. Gates and M. R. Rahimpour, Energy Environ. Sci., 2014, 7, 103–129 RSC
.
- G. G. Zaimes, A. W. Beck, R. R. Janupala, D. E. Resasco, S. P. Crossley, L. L. Lobban and V. Khanna, Energy Environ. Sci., 2017, 10, 1034–1050 RSC
.
-
https://www.residue2heat.eu/, H2020 Research and Innovation Action, Grant Agreement 654650, 2016–2019
.
- A. Oasmaa and S. Czernik, Energy Fuels, 1999, 13, 914–921 CrossRef CAS
.
- M. R. Djokic, T. Dijkmans, G. Yildiz, W. Prins and K. M. Van Geem, J. Chromatogr. A, 2012, 1257, 131–140 CrossRef CAS PubMed
.
- W. Charusiri and N. Numcharoenpinij, Biomass Bioenergy, 2017, 106, 127–136 CrossRef CAS
.
- E. Ranzi, A. Cuoci, T. Faravelli, A. Frassoldati, G. Migliavacca, S. Pierucci and S. Sommariva, Energy Fuels, 2008, 22, 4292–4300 CrossRef CAS
.
- E. Ranzi, P. E. A. Debiagi and A. Frassoldati, ACS Sustainable Chem. Eng., 2017, 5, 2867–2881 CrossRef CAS
.
- E. Ranzi, P. E. A. Debiagi and A. Frassoldati, ACS Sustainable Chem. Eng., 2017, 5, 2882–2896 CrossRef CAS
.
- R. Vinu and L. J. Broadbelt, Energy Environ. Sci., 2012, 5, 9808–9826 RSC
.
- X. Zhou, H. B. Mayes, L. J. Broadbelt, M. W. Nolte and B. H. Shanks, AIChE J., 2016, 62, 766–777 CrossRef CAS
.
- X. Zhou, W. Li, R. Mabon and L. J. Broadbelt, Energy Environ. Sci., 2018, 11(5), 1240–1260 RSC
.
- T. Faravelli, A. Frassoldati, G. Migliavacca and E. Ranzi, Biomass Bioenergy, 2010, 34, 290–301 CrossRef CAS
.
- K. Onarheim, Y. Solantausta and J. Lehto, Energy Fuels, 2014, 29, 205–217 CrossRef
.
- M. Fache, B. Boutevin and S. Caillol, ACS Sustainable Chem. Eng., 2015, 4, 35–46 CrossRef
.
- R. M. Zin, A. Ross, J. Jones and V. Dupont, Bioresour. Technol., 2015, 176, 257–266 CrossRef PubMed
.
- M. Dente, E. Ranzi and A. Goossens, Comput. Chem. Eng., 1979, 3, 61–75 CrossRef CAS
.
- C. Cavallotti, M. Pelucchi and A. Frassoldati, Proc. Combust. Inst., 2018 DOI:10.1016/j.proci.2018.06.137
, in press.
- A. Frassoldati, T. Faravelli and E. Ranzi, Combust. Flame, 2003, 135, 97–112 CrossRef CAS
.
- C. Saggese, S. Ferrario, J. Camacho, A. Cuoci, A. Frassoldati, E. Ranzi, H. Wang and T. Faravelli, Combust. Flame, 2015, 162, 3356–3369 CrossRef CAS
.
- P. Warumporn, E. Ranzi, M. Pelucchi, A. Frassoldati, A. Cuoci, A. Parente and T. Faravelli, Proc. Combust. Inst., 2018 DOI:10.1016/j.proci.2018.06.104
, in press.
- E. Ranzi, A. Frassoldati, A. Stagni, M. Pelucchi, A. Cuoci and T. Faravelli, Int. J. Chem. Kinet., 2014, 46, 512–542 CrossRef CAS
.
- C. Saggese, A. Frassoldati, A. Cuoci, T. Faravelli and E. Ranzi, Combust. Flame, 2013, 160, 1168–1190 CrossRef CAS
.
- E. B. Hemings, G. Bozzano, M. Dente and E. Ranzi, Chem. Eng. Trans., 2011, 24, 61–66 Search PubMed
.
- M. Nowakowska, O. Herbinet, A. Dufour and P.-A. Glaude, Combust. Flame, 2014, 161, 1474–1488 CrossRef CAS
.
- F. Atiku, A. Lea-Langton, K. Bartle, J. Jones, A. Williams, I. Burns and G. Humphries, Energy Fuels, 2017, 31, 1935–1944 CrossRef CAS
.
- Y. Furutani, Y. Dohara, S. Kudo, J.-i. Hayashi and K. Norinaga, J. Phys. Chem. A, 2018, 122, 822–831 CrossRef CAS PubMed
.
- L. Khachatryan, J. Adounkpe, Z. Maskos and B. Dellinger, Environ. Sci. Technol., 2006, 40, 5071–5076 CrossRef CAS PubMed
.
- T. Hosoya, H. Kawamoto and S. Saka, J. Anal. Appl. Pyrolysis, 2007, 78, 328–336 CrossRef CAS
.
- T. Nakamura, H. Kawamoto and S. Saka, J. Anal. Appl. Pyrolysis, 2008, 81, 173–182 CrossRef CAS
.
- I. Brodin, E. Sjöholm and G. Gellerstedt, J. Anal. Appl. Pyrolysis, 2010, 87, 70–77 CrossRef CAS
.
- E. Dorrestijn and P. Mulder, J. Chem. Soc., Perkin Trans. 2, 1999, 777–780 RSC
.
- T. Hosoya, H. Kawamoto and S. Saka, J. Anal. Appl. Pyrolysis, 2009, 84, 79–83 CrossRef CAS
.
- M. Asmadi, H. Kawamoto and S. Saka, J. Anal. Appl. Pyrolysis, 2011, 92, 88–98 CrossRef CAS
.
- Y. Furutani, Y. Dohara, S. Kudo, J.-i. Hayashi and K. Norinaga, J. Phys. Chem. A, 2017, 121, 8495–8503 CrossRef CAS PubMed
.
- J. Huang, X. Li, D. Wu, H. Tong and W. Li, J. Renewable Sustainable Energy, 2013, 5, 043112 CrossRef
.
- J.-b. Huang, L. Chao, L.-r. REN, T. Hong, W.-m. LI and D. Wu, J. Fuel Chem. Technol., 2013, 41, 657–666 CrossRef CAS
.
- C. Liu, Y. Deng, S. Wu, H. Mou, J. Liang and M. Lei, J. Anal. Appl. Pyrolysis, 2016, 118, 123–129 CrossRef CAS
.
- C. Liu, Y. Zhang and X. Huang, Fuel Process. Technol., 2014, 123, 159–165 CrossRef CAS
.
- P. Zhang, N. W. Yee, S. V. Filip, C. E. Hetrick, B. Yang and W. H. Green, Phys. Chem. Chem. Phys., 2018, 20(16), 10637–10649 RSC
.
- E. B. Ledesma, N. D. Marsh, A. K. Sandrowitz and M. J. Wornat, Energy Fuels, 2002, 16, 1331–1336 CrossRef CAS
.
- S. Thomas, E. B. Ledesma and M. J. Wornat, Fuel, 2007, 86, 2581–2595 CrossRef CAS
.
- A. M. Verma and N. Kishore, New J. Chem., 2017, 41, 8845–8859 RSC
.
- M. Wang, C. Liu, X. Xu and Q. Li, Chem. Phys. Lett., 2016, 654, 41–45 CrossRef CAS
.
- E.-J. Shin, M. R. Nimlos and R. J. Evans, Fuel, 2001, 80, 1689–1696 CrossRef CAS
.
- C. Cavallotti, A. Cuoci, T. Faravelli, A. Frassoldati, M. Pelucchi and E. Ranzi, Chem. Eng. Trans., 2018, 65, 79–84 Search PubMed
.
- M. Pelucchi, T. Faravelli, A. Frassoldati, E. Ranzi, S. Gorogantu, G. B. Marin and K. Van Geem, Chem. Eng. Trans., 2018, 65, 127–132 Search PubMed
.
- A. Ince, H. H. Carstensen, M. Sabbe, M. F. Reyniers and G. B. Marin, AIChE J., 2017, 63, 2089–2106 CrossRef CAS
.
- J. M. Simmie and K. P. Somers, J. Phys. Chem. A, 2015, 119, 7235–7246 CrossRef CAS PubMed
.
- S. J. Klippenstein, Proc. Combust. Inst., 2017, 36, 77–111 CrossRef CAS
.
- M. Urban, J. Noga, S. J. Cole and R. J. Bartlett, J. Chem. Phys., 1985, 83, 4041–4046 CrossRef CAS
.
- R. A. Kendall, T. H. Dunning Jr and R. J. Harrison, J. Chem. Phys., 1992, 96, 6796–6806 CrossRef CAS
.
- H.-J. Werner, T. B. Adler and F. R. Manby, J. Chem. Phys., 2007, 126, 164102 CrossRef PubMed
.
- W. K. Metcalfe, S. M. Burke, S. S. Ahmed and H. J. Curran, Int. J. Chem. Kinet., 2013, 45, 638–675 CrossRef CAS
.
- S. M. Burke, U. Burke, R. Mc Donagh, O. Mathieu, I. Osorio, C. Keesee, A. Morones, E. L. Petersen, W. Wang and T. A. DeVerter, Combust. Flame, 2015, 162, 296–314 CrossRef CAS
.
- E. Ranzi, A. Frassoldati, R. Grana, A. Cuoci, T. Faravelli, A. Kelley and C. Law, Prog. Energy Combust. Sci., 2012, 38, 468–501 CrossRef CAS
.
- B. Ruscic, Int. J. Quantum Chem., 2014, 114, 1097–1101 CrossRef CAS
.
-
A. Burcat and B. Ruscic, Third millenium ideal gas and condensed phase thermochemical database for combustion with updates from active thermochemical tables, Argonne National Laboratory Argonne, IL, 2005 Search PubMed
.
- A. Cuoci, A. Frassoldati, T. Faravelli and E. Ranzi, Comput. Phys. Commun., 2015, 192, 237–264 CrossRef CAS
.
- E. Ranzi, M. Dente, T. Faravelli and G. Pennati, Combust. Sci. Technol., 1993, 95, 1–50 CrossRef
.
- D. Baulch, C. Cobos, R. Cox, P. Frank, G. Hayman, T. Just, J. Kerr, T. Murrells, M. Pilling and J. Troe, J. Phys. Chem. Ref. Data, 1994, 23, 847–848 CrossRef CAS
.
- C. Ellis, M. S. Scott and R. W. Walker, Combust. Flame, 2003, 132, 291–304 CrossRef CAS
.
- S. S. Vasu, D. F. Davidson and R. K. Hanson, J. Propul. Power, 2010, 26, 776–783 CrossRef CAS
.
- D. Robaugh and W. Tsang, J. Phys. Chem., 1986, 90, 4159–4163 CrossRef CAS
.
- T. Seta, M. Nakajima and A. Miyoshi, J. Phys. Chem. A, 2006, 110, 5081–5090 CrossRef CAS PubMed
.
- J. A. Manion and R. Louw, J. Phys. Chem., 1990, 94, 4127–4134 CrossRef CAS
.
- M. Pelucchi, C. Cavallotti, T. Faravelli and S. Klippenstein, Phys. Chem. Chem. Phys., 2018, 20(16), 10607–10627 RSC
.
-
H.-H. Carstensen and A. M. Dean, in Computational modeling in lignocellulosic biofuel production, ACS Publications, 2010, pp. 201–243 Search PubMed
.
- M. Altarawneh, B. Z. Dlugogorski, E. M. Kennedy and J. C. Mackie, J. Phys. Chem. A, 2009, 114, 1060–1067 CrossRef PubMed
.
- S. W. Wagnon, S. Thion, E. J. Nilsson, M. Mehl, Z. Serinyel, K. Zhang, P. Dagaut, A. A. Konnov, G. Dayma and W. J. Pitz, Combust. Flame, 2018, 189, 325–336 CrossRef CAS
.
- S. Zabeti, M. Aghsaee, M. Fikri, O. Welz and C. Schulz, Proceedings of the Combustion Institute, 2017, 36, 4525–4532 CrossRef CAS
.
- J. R. Lawson and M. Klein, Ind. Eng. Chem. Fundam., 1985, 24, 203–208 CrossRef CAS
.
- N. B. Poddar, S. Thomas and M. J. Wornat, Proc. Combust. Inst., 2011, 33, 541–548 CrossRef CAS
.
- S. Thomas and M. J. Wornat, Proc. Combust. Inst., 2009, 32, 615–622 CrossRef CAS
.
- M. Frenklach and H. Wang, Symp. (Int.) Combust., [Proc.], 1991, 23, 1559–1566 CrossRef
.
Footnote |
| † Electronic supplementary information (ESI) available. See DOI: 10.1039/c8re00198g |
| This journal is © The Royal Society of Chemistry 2019 |

