 Open Access Article
Determination of the concentration range for 267 proteins from 21 lots of commercial human plasma using highly multiplexed multiple reaction monitoring mass spectrometry†
Claudia
Gaither‡
a,
Robert
Popp‡
a,
Yassene
Mohammed
 bc and
Christoph H.
Borchers
 *bdefg
aMRM Proteomics Inc., 141 Avenue du Président-Kennedy, SB-5100, C.P. #26, Montreal, QC H2X 3X8, Canada
bUniversity of Victoria – Genome British Columbia Proteomics Centre, University of Victoria, Victoria, British Columbia V8Z 7X8, Canada
cCenter for Proteomics and Metabolomics, Leiden University Medical Center, Albinusdreef 2, Leiden, 2333 ZA, The Netherlands
dDepartment of Biochemistry and Microbiology, University of Victoria, Victoria, British Columbia, V8P 5C2, Canada
eSegal Cancer Proteomics Centre, Lady Davis Institute, Jewish General Hospital, McGill University, Montreal, Quebec H3 T 1E2, Canada. E-mail: christoph.borchers@mcgill.ca
fGerald Bronfman Department of Oncology, Jewish General Hospital, McGill University, Montreal, Quebec H3 T 1E2, Canada
gDepartment of Data Intensive Science and Engineering, Skolkovo Institute of Science and Technology, Skolkovo Innovation Center, Nobel St., Moscow 143026, Russia
First published on 7th April 2020
Abstract
Multiple reaction monitoring (MRM) is a key tool for biomarker validation and the translation of potential biomarkers into the clinic. To demonstrate the applicability of MRM towards achieving this goal, we set out to determine the concentration ranges of 267 plasma proteins, including 61 FDA-approved/LDT developed biomarkers, in 21 commercial human plasma lots, as well as to assess accuracy and precision. Each target protein was quantified by calculating the area ratio of the endogenous tryptic target peptide to its stable isotope-labelled internal standard equivalent and compared to a standard curve. This highly multiplexed approach utilized a standard-flow UHPLC system linked to a triple quadrupole. All samples were analyzed across three separate days and assessed for robustness and accuracy. The standard curves and quality control samples showed excellent performance, with >93% of standards and QCs meeting the acceptance criteria. A total of 248 proteins were able to be quantified in at least one sample on at least one of the three days, with 111 proteins being quantified in all 21 samples on all three days. The protein concentrations across all proteins covered six orders of magnitude. Furthermore, excellent three-day precision was demonstrated with 86% of CVs falling below 15%. Overall, the protein concentration differences ranged from 1.1-fold for metalloproteinase inhibitor 2, to 69-fold for serum amyloid A-1/A-2.
Introduction
Over the past few decades, mass spectrometry-based proteomics has become an invaluable tool for unraveling the molecular blueprint of biology and disease, and to begin to understand their underlying complexity. Bottom-up discovery proteomics approaches using high resolution mass spectrometers in an untargeted fashion are commonly used to assess disease-associated proteins for up- or down-regulation, or for modifications such as post-translational modifications (PTMs).1 The identified proteins have the potential to be used as biomarkers for a variety of applications – including disease prognosis, diagnosis, and status, as companion diagnostics to determine eligibility for certain treatments, or for drug monitoring. After a potential biomarker or set of potential biomarkers has been identified, the biomarker candidates are transferred to a clinically compatible assay platform, followed by analytical and clinical validation. This transfer is required to overcome the limitations of the discovery platforms which include difficulty in standardizing measurements, the complexity of the workflow and data analysis which requires significant expertise, and low sample throughput.The most common methodologies for biomarker validation and routine diagnostic use in clinical laboratories are the enzyme-linked immunosorbent assay (ELISA) and immunohistochemistry (IHC).2
Although robust, sensitive, amenable to automation, relatively easy to implement and perform once developed and validated, ELISAs rely heavily on the specificity of the antibody. Cross-reactivity of the antibodies with non-target antigens can result in protein overestimation and antigen recognition can be affected by unexpected or unknown PTM patterns that can result in an underestimation of protein expression.3 Moreover, ELISAs are susceptible to the Hook effect, which results in the underestimation of protein concentrations in samples with high protein concentrations.4 In addition, interferences by auto-antibodies have been reported.5
A powerful mass spectrometry-based technique, very suitable for studies designed to validate protein biomarkers, is multiple reaction monitoring (MRM), also called selected reaction monitoring (SRM). This is due to its high multiplexing capability (i.e., 10s to hundreds of proteins per run), its accuracy and precision when using stable isotope-labelled standard (SIS) peptides, its linear responses over several orders of magnitude, as well as low sample consumption. Furthermore, MRM achieves nearly absolute specificity due to the combination of peptide-specific retention time, fragment ion ratios, and mass-to-charge (m/z) information.6,7
MRM has been used for protein quantitation in various sample backgrounds, including human plasma,8 mouse plasma and tissues,9,10 and dried blood spots,11 among others. In addition to targeting non-modified peptides, MRM has been successfully applied to quantifying modified peptides either directly, e.g. phosphorylated12 or glycosylated13 peptides, or after enzymatic removal of these modifications.14,15 Moreover, the enrichment of peptides prior to MRM analysis (immuno-MRM) can be used to increase sensitivity, if necessary.16,17
An important requirement for biomarker validation studies is the ability to achieve reproducible results between sample batches and between laboratories, and this has been demonstrated in many multi-laboratory studies using MRM.18–20 The use of standardized procedures and reagents, however, is required to achieve high reproducibility, which highlights the importance of commercially available reagent kits so that the research community can achieve transferable results. Our goal, therefore, was to address the need for standardization by developing easy-to-use MRM assay kits21 which had been rigorously validated following the Clinical Proteomic Tumor Analysis Consortium (CPTAC) guidelines.22
To expand upon previous work which resulted in a MRM panel for the quantitation of 76 human plasma proteins,21 the University of Victoria – Genome BC Proteomics Centre increased the number of protein targets to 267. Each of the 267 target proteins is quantified based on a unique tryptic peptide utilizing synthetic light and isotope-labelled standard peptides. The proteins cover a wide range of potential disease biomarkers, including neurodegenerative disease, renal disease, cancer, eye disease, bone disease, blood disorders, pregnancy complications, diabetes and autoimmune disorders among others. Of the 267 protein targets, 61 are FDA-approved protein biomarkers23 and 67 are putative biomarkers for cardiovascular disease.24 Upon rigorous assay validation and interference screening following CPTAC guidelines, the MRM assays were turned into a kit and used for this study.
The kit consists of two lyophilized peptide mixtures, pre-weighed trypsin, and bovine serum albumin (BSA), as well as information on retention times, transitions, and optimized MS parameters for the following instruments: Agilent 6490/6495, Sciex 6500 Q-TRAP, and Thermo Q-Exactive. The first peptide mixture consists of 267 light (natural isotopic abundance, NAT) peptides that had been characterized for purity and concentration by capillary zone electrophoresis (CZE) and amino acid analysis (AAA). These peptides have been extensively screened for interferences during assay validation and are used to generate calibration curves with digested BSA as the background matrix. BSA background as a surrogate matrix for the generation of calibration curves has previously been shown to result in comparable accuracies as calibration curves generated in plasma.25 The second peptide mixture consists of the analogous 267 SIS peptides. These are spiked into both the plasma samples and the samples used to generate the calibration curve, and act as normalizers for ionization efficiency differences as well as any chromatographic variations between samples.
Here we show the human plasma panel performance as determined by quantifying target proteins from 21 lots of commercial human plasma from BioIVT (formerly known as Bioreclamation IVT).
Experimental
Materials
![[thin space (1/6-em)]](https://www.rsc.org/images/entities/char_2009.gif) :
:![[thin space (1/6-em)]](https://www.rsc.org/images/entities/char_2009.gif) 1 (protein to enzyme, w/w) ratio, and samples were incubated overnight (18 hours) at 37 °C for proteolytic cleavage. The next day, the samples were acidified to a final concentration of 1.0% FA (pH ≤ 2) to quench the digestion reaction, leading to a final peptide mixture with an estimated concentration of 1 μg μL−1. Samples were kept on ice until analyzed on the same day.
1 (protein to enzyme, w/w) ratio, and samples were incubated overnight (18 hours) at 37 °C for proteolytic cleavage. The next day, the samples were acidified to a final concentration of 1.0% FA (pH ≤ 2) to quench the digestion reaction, leading to a final peptide mixture with an estimated concentration of 1 μg μL−1. Samples were kept on ice until analyzed on the same day.
![[thin space (1/6-em)]](https://www.rsc.org/images/entities/char_2009.gif) :
:![[thin space (1/6-em)]](https://www.rsc.org/images/entities/char_2009.gif) 1
1![[thin space (1/6-em)]](https://www.rsc.org/images/entities/char_2009.gif) :
:![[thin space (1/6-em)]](https://www.rsc.org/images/entities/char_2009.gif) 1 (v/v/v). All plasma and QC samples were spiked with the same amount of the SIS peptide mixture as the standards. Plasma samples, QC samples, and standards were then concentrated by solid-phase extraction (SPE) using an Oasis HLB μElution plate. Briefly, the SPE plate was conditioned with 600 μL MeOH, equilibrated with 600 μL of 0.1% aqueous FA followed by loading the plasma sample digests, QC samples, and standards. The wells were washed three times with 600 μL of H2O, and the bound peptides were eluted with 55 μL of 70% ACN/0.1% FA. After the SPE step, the concentrated eluate was evaporated using a speed vacuum concentrator and then stored at −80 °C. Plasma samples, standards and QC samples were then resolubilized and analyzed on the Agilent 6495B.
1 (v/v/v). All plasma and QC samples were spiked with the same amount of the SIS peptide mixture as the standards. Plasma samples, QC samples, and standards were then concentrated by solid-phase extraction (SPE) using an Oasis HLB μElution plate. Briefly, the SPE plate was conditioned with 600 μL MeOH, equilibrated with 600 μL of 0.1% aqueous FA followed by loading the plasma sample digests, QC samples, and standards. The wells were washed three times with 600 μL of H2O, and the bound peptides were eluted with 55 μL of 70% ACN/0.1% FA. After the SPE step, the concentrated eluate was evaporated using a speed vacuum concentrator and then stored at −80 °C. Plasma samples, standards and QC samples were then resolubilized and analyzed on the Agilent 6495B.
MS analysis was performed on an Agilent 6495B triple quadrupole instrument operated in the positive ion mode. MRM data were acquired at 3.5 kV and 300 V capillary voltage and nozzle voltage, respectively. The sheath gas flow was set to 11 L min−1 at a temperature of 250 °C, and the drying gas flow was set to 15 L min−1 at a temperature of 150 °C, with the nebulizer gas pressure at 30 psi. The collision cell accelerator voltage was set to 5 V, and unit mass resolution was used in the first and third quadrupole mass analyzers. The high energy dynode (HED) multiplier was set to −20 kV for improved ion detection efficiency and signal-to-noise ratios. A single transition per peptide target was monitored over 700 ms cycles and 90 s detection windows were used for the quantitative analysis.
Results and discussion
Performance of calibration curves and QCs
Three sets of standard curves were generated to determine the precision and accuracy in the standards used for the calibration curve, the QC samples, and the 21 different plasma lots. The calibration curves and QC samples were evaluated following the acceptance criteria described in the previous section (at least 5/8 calibration curve standards, and at least 66% of all QC samples were within ±20% of the theoretical concentration, i.e. the expected concentration based on our calculations). As presented in Table 1, more than 93% of all standards and QC samples acquired during the three-day study met the target criteria.| Day | Accepted curve standards (%) | Accepted QC samples (%) |
|---|---|---|
| 1 | 94.4% | 95.0% |
| 2 | 95.5% | 93.9% |
| 3 | 96.5% | 94.1% |
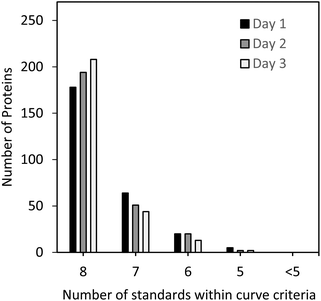
The standard curves for all 267 peptides met the criteria shown above and were within ±20% of the theoretical value for a minimum of 5 out of 8 standard levels. As can be seen in Fig. 2, the majority of the three sets of standard curves were generated with 8 out of 8 standard points, followed by 7, 6, and 5 points, demonstrating the linear performance of the selected peptides for MRM analysis over several orders of magnitude and giving high confidence in the protein quantitation results.
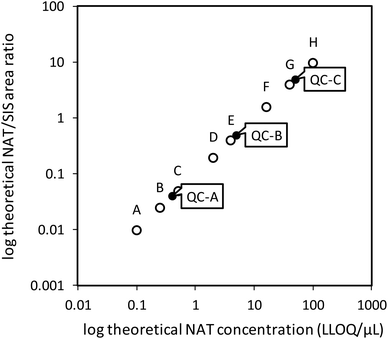
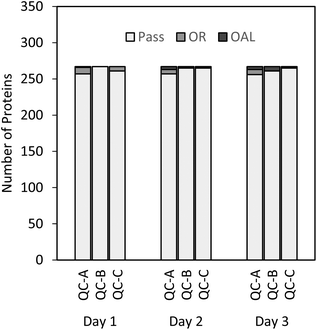
As shown in Fig. 3, all three QC levels performed as expected and fell within acceptable limits for the majority of proteins. The few rejected QCs were either outside the linear range (OR) or outside the acceptable limits (OAL). Thus, in a curve where standards A (1× LLOQ) and B (2.5× LLOQ) were rejected, QC-A (4× LLOQ) was automatically rejected and denoted “OR”. The lowest point on curve (LPOC), or LLOQ for that particular curve, became standard C (5×). In this case, the curve itself was deemed to be acceptable if the other two QC samples (QC-B and QC-C) passed the acceptance criteria. The OAL annotation was used for QC samples that fell outside the ±20% acceptance criterion, and fewer than 1% of the QC samples were OAL. This suggests proper performance of the calibration curve and QC samples for most peptides, thus providing high confidence in the quantitative results of the plasma samples analyzed.
Protein quantitation in 21 lots of commercial human plasma
Quantitation of all 267 proteins was attempted for all 21 sample lots (10 male, 10 female, 1 pooled sample; see ESI Table 2†) using the three standard curves prepared on days 1 to 3. All standard curves were generated with five to eight standards, as shown in Fig. 2. Each standard curve possessed an LLOQ and a ULOQ, as determined by the lowest and highest passing standards, respectively. In total, 248 proteins were quantifiable (within the linear range) in at least one sample on at least one day, and 157 proteins were quantifiable in at least one sample on all three days. A total of 111 proteins were quantifiable in all 21 samples on all three days. Notably, no protein in any sample was found to be above the ULOQ, and 110 proteins were below the LLOQ in all samples. Sixty of these proteins are thought to be associated with diseases such as neuropathy, lung cancer, epilepsy, rheumatoid arthritis, cardiomyopathy, among others, according to UniProt.28 Hence, despite not all proteins being quantifiable across all samples, their analysis is still relevant, for instance when assessing different diseases which might result in up-regulation of some of the proteins.The number of proteins quantified between different samples and between different days of analysis was found to be very consistent (see Fig. 4), with a median of 145 proteins quantified, and a standard deviation of 15.8. Furthermore, the overlap of the quantifiable proteins per sample was considerable with on average 84% of the proteins being quantified across all three days (see ESI Fig. 1†). Interestingly, two samples (BRH1447341, day 3, and BRH1447347, day 1), showed elevated numbers of proteins quantified on one of the three days. A possible explanation for this phenomenon could be a slight heterogeneity in the sample aliquots, for example, caused by plasma clots. This is supported by the observation that the QC samples and standard curves across all three days are very similar, thus ruling out LLOQ shifts of the calibration curves between days as the cause of the elevated numbers of proteins. This highlights the importance of adhering to strict sample preparation protocols to ensure as little variation as possible.
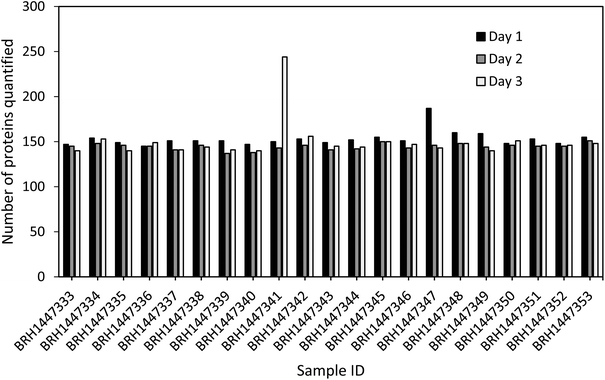 | ||
| Fig. 4 Number of proteins with quantifiable endogenous concentrations as well as standard curves and QC samples within the acceptance criteria in 21 plasma samples across three days. | ||
Overall, the data demonstrated the high reproducibility of the MRM approach for highly multiplexed protein quantitation.
Fig. 5 shows the distribution of % CVs calculated for all the proteins that were quantifiable in the plasma samples on each of the three days (a total of 2793 CVs were calculated for the 21 samples analyzed). More than 86% of the CVs were below 15% CV, with the majority falling below 10% CV. Furthermore, 6% of the CVs were between 15–20%, 4.6% were between 20–30%, and only 3.4% of the CVs were >30%. This shows the quality and precision of the selected peptides and demonstrates their suitability for reliable measurements and quantitative analysis in a variety of samples, which could easily be transferred to a clinical setting.
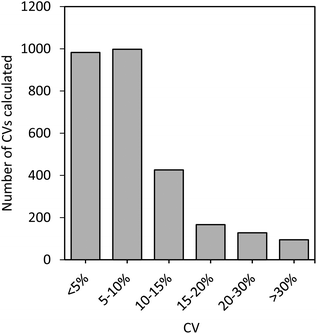 | ||
| Fig. 5 Distribution of % CVs calculated for all sample protein concentrations determined on all three days. | ||
Concentration range
Fig. 6A shows the average protein concentrations for each protein that could be quantified in three replicate analyses in at least one of the 21 plasma samples. The concentration ranges across all plasma samples were very similar, and covered approximately six orders of magnitude, from ∼1 fmol μL−1 for P-selectin, to 747 pmol μL−1 for human serum albumin, which falls within the normal accepted concentration range for serum albumin.32 Furthermore, the concentrations for the proteins quantified in all 21 samples across all three days (111 proteins) were very comparable, ranging from 4.13 fmol μL−1 to 747 pmol μL−1. This demonstrates the suitability of MRM for quantitation of proteins that vary in concentration by many orders of magnitude.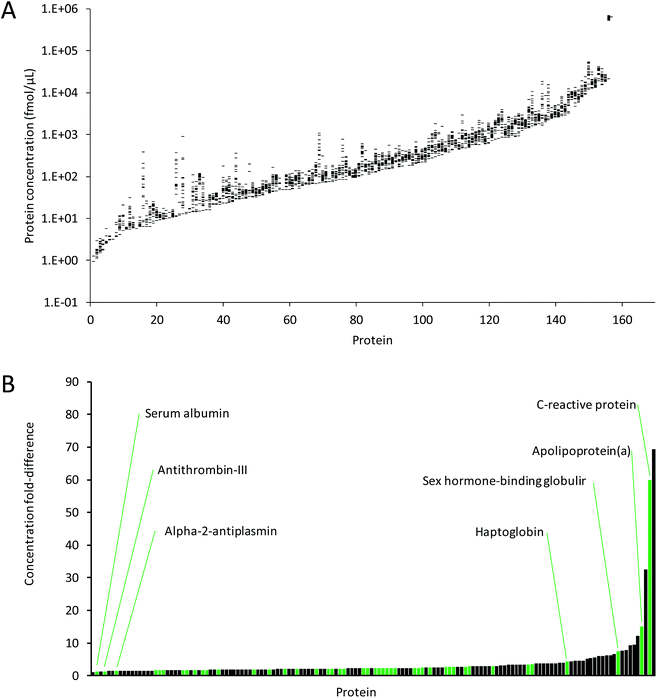 | ||
| Fig. 6 (A) Ranges of average concentrations for the proteins quantified across three days in the 21 plasma samples. Proteins are sorted by minimum concentration across all samples. (B) Concentration ranges (i.e. fold-differences) between samples for proteins with quantifiable protein concentrations in at least 5 samples (144 proteins). Green bars show the FDA-approved and LDT biomarkers, as listed by Anderson et al.23 | ||
Plasma protein concentration measurements using traditional ELISA methods versus modern LC-MS/MS techniques have been compared previously. Strong correlation was found between the two methods when measuring plasma PCSK9 in 30 human plasma samples.33 Although discrepancies between ELISA and LC-MS/MS have been documented in the past, further investigation has revealed that the strong dependence of ELISAs on the antibody specificity can become a hinderance. For example, the discrepancy found between ELISA and LC-MS/MS assay results on a PEGylated scaffold protein in post-dose monkey samples was shown to be due to ELISA measuring only the active circulating drug (target-binding), whereas the LC-MS/MS method measured the total circulating drug.34 The bias observed in ELISA results supports that LC-MS/MS could in many instances reveal a more accurate picture, as reviewed previously.35 Thus, we believe that a direct comparison between ELISA and our LC-MRM-MS methods would be of limited value.
Of the 267 proteins, 144 proteins were quantified in at least 5 of the 21 samples, and differences in protein concentrations were determined (Fig. 6B). Of these 144 proteins, 48 are FDA-approved/laboratory developed test (LDT) biomarkers, as listed by Anderson et al.23 Depending on the protein, these concentration ranges were as low as 1.1-fold for metalloproteinase inhibitor 2, to 69-fold for serum amyloid A-1/A-2 (see ESI Table 3† for details). The highest fold-difference observed for these FDA-approved biomarkers was 60-fold for C-reactive protein. The data show that although most protein abundances between samples are greatly conserved, some proteins show significant differences. For instance, C-reactive protein and serum amyloid A, both recognized as acute phase proteins, are known to increase in concentration by several hundred-fold or more in response to inflammation.36,37 The differences in protein abundances between samples highlight the importance of, ideally, establishing patient-specific baseline measurements in preventative medicine and disease monitoring rather than establishing a baseline for a cohort of patients. Furthermore, it highlights the suitability of MRM-MS based methods for their multiplexing capabilities across multiple orders of magnitude.
Data assessment for statistically significant differences
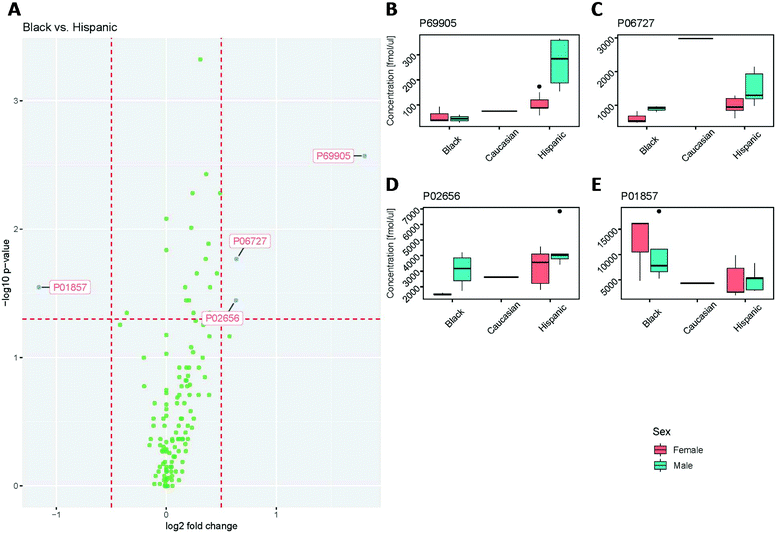
The protein concentrations determined for all samples were further assessed for statistically significant differences between male and female, as well as ethnicity (Hispanic, Black and Caucasian). It is important to note that only one sample was from a Caucasian donor.Upon statistical analysis, the concentrations for the majority of proteins showed no significant differences between Black and Hispanic groups (Fig. 7A). All but four of the values were within the ±0.5-fold change. The hemoglobin subunit alpha (P69905), Apolipoprotein A-IV (P06727) and Apolipoprotein C-III (P02656) concentrations were found to be significantly higher in the Hispanic group than in the Black subject, while the immunoglobulin heavy constant gamma 1 (P01857) was significantly lower in the Hispanic group than in the Black subject.
The plasma concentrations for hemoglobin subunit alpha (P69905) were found to be comparable between female and male in the samples from Black subjects. In contrast, the samples from male subjects with a Hispanic background showed 3-fold higher average levels than the female Hispanic samples, and approximately 6-fold higher average levels than the samples from Black subjects (Fig. 7B). Furthermore, male subjects showed slightly elevated concentrations compared to female subjects in both the Hispanic and Black groups for Apolipoprotein A-IV (P06727; Fig. 7C) and Apolipoprotein C-III (P02656; Fig. 7D). Immunoglobulin heavy constant gamma 1 (P01857), however, was found to have a higher concentration in Black subjects compared to Hispanic subjects (Fig. 7E). It is important to note, however, that the spread of P01857 concentrations in all groups was wide, which reflects a natural spread of IgG and the function of the immune system. Here, as we do not have any additional information on the medical history of these samples, it is hard to reach any definitive conclusion about why P01857 is elevated in one group and not another. Nonetheless, this demonstrates the ability of the assay to capture and measure the elevation of immunoglobulin heavy constant gamma 1 levels, which could potentially be used to monitor the function of the immune system.
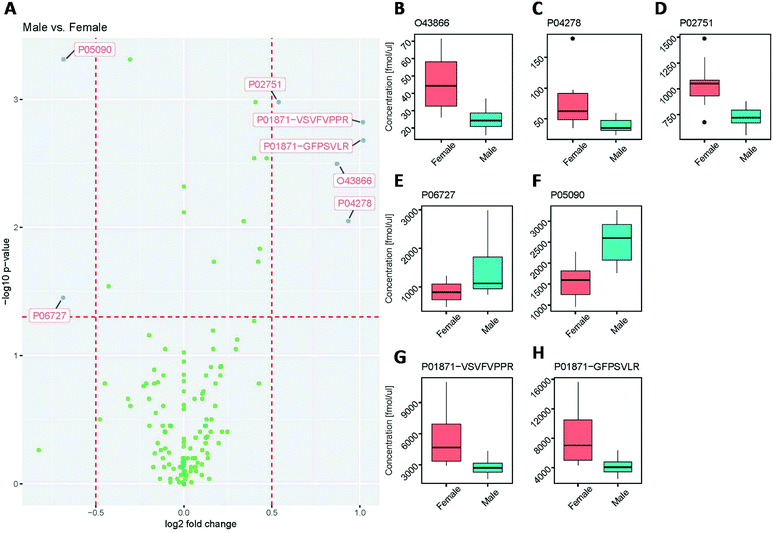
A similar trend was seen when assessing the protein concentration differences between male and female groups (Fig. 8).
While the majority of concentration values showed no statistically significant differences (Fig. 8A), the proteins CD5 antigen-like (O43866; Fig. 8B), sex hormone-binding globulin (P04278; Fig. 8C), fibronectin (P02751; Fig. 8D), and immunoglobulin heavy constant mu (P01871; Fig. 8G and H) were significantly higher in females than in males. This observation for immunoglobulin heavy constant mu agrees with previously reported data by Oyeyinka et al.38
Interestingly, the two different tryptic peptides (VSVFVPPR and GFPSVLR) used as surrogates to quantify immunoglobulin heavy constant mu (P01871), showed the same fold difference, demonstrating the validity of this approach to assess quantitative differences between samples. Despite the fact that both peptides were used to quantify the same protein and showed a statistically significant difference between female and male samples, the absolute concentration values between the two peptides differed by a factor of approximately 1.5, suggesting different release efficiencies and/or degradation behaviour of these peptides.39 The excellent correlation of the quantitative results (with an R2 value of 0.997, see ESI Fig. 2†), however, indicates that the concentrations determined are highly reproducible and therefore valid for protein quantitation. Furthermore, the concentrations of the proteins Apolipoprotein A-IV (P06727; Fig. 8E) and Apolipoprotein D (P05090; Fig. 8F) were significantly lower in females than in males.
Additionally, hierarchical clustering showed no obvious clusters (Fig. 9 and ESI “Gaither_Popp_Borchers_Figure_9_data.csv”†), further supporting the lack of statistically significant differences in the majority of protein concentrations between samples, although sub-clusters for male and female within the Black and Hispanic groups were observed.
 | ||
| Fig. 9 Hierarchical clustering results for the patient samples analyzed, using ethnic background and sex as groups to be compared. | ||
Taken together, the data suggest that there are no significant concentration differences in all of the human plasma samples analyzed, supporting the idea that determining protein concentration references ranges for groups of patients, such as patients considered “healthy”, is a valid approach. Previous studies using subsets of these assays on samples from cancer and control patients demonstrated the ability to capture a protein signature reflecting the two groups.40
Conclusion
The PeptiQuant 267-protein MRM kit has been successfully used for determining the protein concentrations across six orders of magnitude in 21 commercially available human plasma samples in a highly reproducible and accurate fashion using stable isotope-labelled standard peptides. We believe this approach is well-suited to advance the biomarker discovery efforts to the next stage, biomarker validation, to finally bring more biomarkers into the clinic. Additionally, the potential for differentiating diseased state vs. healthy state with peptide surrogates with mutated sequences as observed in a diseased state remains a possibility for the future of MRM-based clinical diagnostics and a project we look forward to exploring in the future.Conflicts of interest
CHB is the CSO of MRM Proteomics, Inc. CG and RP are staff members of MRM Proteomics, Inc.Acknowledgements
MRM Proteomics Inc. is grateful for the efforts of our collaborators at the team at the University of Victoria – Genome BC Proteomics Centre, in particular Andrea Palmer and Derek Smith, in synthesizing, characterizing, and validating the 267 MRM assays. CHB and the University of Victoria-Genome British Columbia Proteomics Centre are grateful to Genome Canada and Genome British Columbia for financial support through the Genomics Innovation Network (project codes 204PRO for operations and 214PRO for technology development) and the Genomics Technology Platform (264PRO). CHB is also grateful for support from the Leading Edge Endowment Fund, and the Segal McGill Chair in Molecular Oncology at McGill University (Montreal, Quebec, Canada). CHB is also grateful for support from the Warren Y. Soper Charitable Trust and the Alvin Segal Family Foundation to the Jewish General Hospital (Montreal, Quebec, Canada).References
- R. Aebersold and M. Mann, Nature, 2016, 537, 347–355 CrossRef CAS PubMed
.
- T. G. Cross and M. P. Hornshaw, J. Appl. Bioanal., 2016, 2, 108–116 CrossRef
.
- C. A. Morales-Betanzos, H. Lee, P. I. Gonzalez Ericsson, J. M. Balko, D. B. Johnson, L. J. Zimmerman and D. C. Liebler, Mol. Cell. Proteomics, 2017, 16, 1705–1717 CrossRef CAS PubMed
.
- A. N. Hoofnagle and M. H. Wener, J. Immunol. Methods, 2009, 347, 3–11 CrossRef CAS PubMed
.
- A. N. Hoofnagle, J. O. Becker, M. H. Wener and J. W. Heinecke, Clin. Chem., 2008, 54, 1796–1804 CrossRef CAS PubMed
.
- M. H. Elliott, D. S. Smith, C. E. Parker and C. Borchers, J. Mass Spectrom., 2009, 44, 1637–1660 CAS
.
- C. E. Parker, T. W. Pearson, N. L. Anderson and C. H. Borchers, Analyst, 2010, 135, 1830–1838 RSC
.
- M. A. Kuzyk, D. Smith, J. C. Yang, T. J. Cross, A. M. Jackson, D. B. Hardie, N. L. Anderson and C. H. Borchers, Mol. Cell. Biochem., 2009, 8, 1860–1877 CAS
.
- A. J. Percy, S. A. Michaud, A. Jardim, N. J. Sinclair, S. P. Zhang, Y. Mohammed, A. L. Palmer, D. B. Hardie, J. C. Yang, A. M. LeBlanc and C. H. Borchers, Proteomics, 2017, 17 DOI:10.1002/pmic.201600097 Search PubMed
.
- S. A. Michaud, N. J. Sinclair, H. Petrosova, A. L. Palmer, A. J. Pistawka, S. Zhang, D. B. Hardie, Y. Mohammed, A. Eshghi, V. R. Richard, A. Sickmann and C. H. Borchers, Commun. Biol., 2018, 1, 78 CrossRef PubMed
.
- A. G. Chambers, A. J. Percy, J. Yang and C. H. Borchers, Mol. Cell. Proteomics, 2015, 14, 3094–3104 CrossRef CAS PubMed
.
- E. L. de Graaf, J. Kaplon, S. Mohammed, L. A. M. Vereijken, D. P. Duarte, L. R. Gallego, A. J. R. Heck, D. S. Peeper and A. F. M. Altelaar, J. Proteome Res., 2015, 14, 2906–2914 CrossRef CAS PubMed
.
- Y. J. Kim, Z. Zaidi-Ainouch, S. Gallien and B. Domon, Nat. Protoc., 2012, 7, 859–871 CrossRef CAS PubMed
.
- D. Domanski, L. C. Murphy and C. H. Borchers, Anal. Chem., 2010, 82, 5610–5620 CrossRef CAS PubMed
.
- H. Zhang, Z. Wang, J. Stupak, O. Ghribi, J. D. Geiger, Q. Y. Liu and J. Li, Proteomics, 2012, 12, 2510–2522 CrossRef CAS PubMed
.
- R. M. Schoenherr, R. G. Saul, J. R. Whiteaker, P. Yan, G. R. Whiteley and A. G. Paulovich, Mol. Cell. Proteomics, 2015, 14, 382–398 CrossRef CAS PubMed
.
- M. Razavi, N. L. Anderson, M. E. Pope, R. Yip and T. W. Pearson, New Biotechnol., 2016, 33, 494–502 CrossRef CAS PubMed
.
- T. A. Addona, S. E. Abbatiello, B. Schilling, S. J. Skates, D. R. Mani, D. M. Bunk, C. H. Spiegelman, L. J. Zimmerman, A.-J. L. Ham, H. Keshishian, S. C. Hall, S. Allen, R. K. Blackman, C. H. Borchers, C. Buck, H. L. Cardasis, M. P. Cusack, N. G. Dodder, B. W. Gibson, J. M. Held, T. Hiltke, A. Jackson, E. B. Johansen, C. R. Kinsinger, J. Li, M. Mesri, T. A. Neubert, R. K. Niles, T. C. Pulsipher, D. Ransohoff, H. Rodriguez, P. A. Rudnick, D. Smith, D. L. Tabb, T. J. Tegeler, A. M. Variyath, L. J. Vega-Montoto, A. Wahlander, S. Waldemarson, M. Wang, J. R. Whiteaker, L. Zhao, N. L. Anderson, S. J. Fisher, D. C. Liebler, A. G. Paulovich, F. E. Regnier, P. Tempst and S. A. Carr, Nat. Biotechnol., 2009, 27, 633–641 CrossRef CAS PubMed
.
- S. E. Abbatiello, B. Schilling, D. R. Mani, L. J. Zimmerman, S. C. Hall, B. MacLean, M. Albertolle, S. Allen, M. W. Burgess, M. P. Cusack, M. Ghosh, V. Hedrick, J. M. Held, H. D. Inerowicz, A. Jackson, H. Keshishian, C. R. Kinsinger, J. Lyssand, L. Makowski, M. Mesri, H. Rodriguez, P. Rudnick, P. Sadowski, N. Sedransk, K. Shaddox, S. J. Skates, E. Kuhn, D. Smith, J. R. Whiteaker, C. Whitwell, S. Zhang, C. H. Borchers, S. J. Fisher, B. W. Gibson, D. C. Liebler, M. J. MacCoss, T. A. Neubert, A. G. Paulovich, F. E. Regnier, P. Tempst and S. A. Carr, Mol. Cell. Proteomics, 2015, 14, 2357–2374 CrossRef CAS PubMed
.
- A. J. Percy, J. Tamura-Wells, J. P. Albar, K. Aloria, A. Amirkhani, G. D. T. Araujo, J. M. Arizmendi, F. J. Blanco, F. Canals, J.-Y. Cho, N. Colomé-Calls, F. J. Corrales, G. Domont, G. Espadas, P. Fernandez-Puente, C. Gil, P. A. Haynes, M. L. Hernáez, J. Y. Kim, A. Kopylov, M. Marcilla, M. J. McKay, M. Mirzaei, M. P. Molloy, L. B. Ohlund, Y.-K. Paik, A. Paradela, M. Raftery, E. Sabidó, L. Sleno, D. Wilffert, J. C. Wolters, J. S. Yoo, V. Zgoda, C. E. Parker and C. H. Borchers, EuPa Open Proteomics, 2015, 8, 6–15 CrossRef CAS
.
- A. J. Percy, Y. Mohammed, J. C. Yang and C. H. Borchers, Bioanalysis, 2015, 7, 2991–3004 CrossRef CAS PubMed
.
- CPTAC, https://proteomics.cancer.gov/assay-portal/about/assay-characterization-guidance-documents, Editon edn., vol. 2015.
- N. L. Anderson, Clin. Chem., 2010, 56, 177–185 CrossRef CAS PubMed
.
- D. Domanski, A. J. Percy, J. Yang and A. G. Chambers, Proteomics, 2012, 12, 1222–1243 CrossRef CAS PubMed
.
- A. LeBlanc, S. A. Michaud, A. J. Percy, D. B. Hardie, J. Yang, N. J. Sinclair, J. I. Proudfoot, A. Pistawka, D. S. Smith and C. H. Borchers, J. Proteome Res., 2017, 16, 2527–2536 CrossRef CAS PubMed
.
- M. A. Kuzyk, C. E. Parker, D. Domanski and C. H. Borchers, Methods Mol. Biol., 2013, 1023, 53–82 CrossRef CAS PubMed
.
- Y. Mohammed, D. Domański, A. M. Jackson, D. S. Smith, A. M. Deelder, M. Palmblad and C. H. Borchers, J. Proteomics, 2014, 106, 151–161 CrossRef CAS PubMed
.
- The_UniProt_Consortium, Nucleic Acids Res., 2015, 43, D204–D212 CrossRef PubMed
.
- CPTAC_Assay_Portal, https://assays.cancer.gov, Editon edn., vol. 2015.
- A. J. Percy, A. G. Chambers, J. Yang, D. Domanski and C. H. Borchers, Anal. Bioanal. Chem., 2012, 404, 1089–1101 CrossRef CAS PubMed
.
- B. MacLean, D. M. Tomazela, N. Shulman, M. Chambers, G. L. Finney, B. Frewen, R. Kern, D. L. Tabb, D. C. Liebler and M. J. MacCoss, Bioinformatics, 2010, 26, 966–968 CrossRef CAS PubMed
.
- G. Weaving, G. F. Batstone and R. G. Jones, Ann. Clin. Biochem., 2016, 53, 106–111 CrossRef CAS PubMed
.
- M. Croyal, F. Fall, M. Krempf, A. Thédrez, K. Ouguerram, V. Ferchaud-Roucher, A. Aguesse, S. Billon-Crossouard, P. Mata, R. Alonso, G. Lambert and E. Nobécourt, J. Chromatogr. B: Anal. Technol. Biomed. Life Sci., 2017, 1044–1045, 24–29 CrossRef CAS PubMed
.
- S. J. Wang, S. T. Wu, J. Gokemeijer, A. Fura, M. Krishna, P. Morin, G. Chen, K. Price, D. Wang-Iverson, T. Olah, R. Weiner, A. Tymiak and M. Jemal, Anal. Bioanal. Chem., 2012, 402, 1229–1239 CrossRef CAS PubMed
.
- A. N. Hoofnagle and M. H. Wener, J. Immunol. Methods, 2009, 347, 3–11 CrossRef CAS PubMed
.
- C. C. Yue, J. Muller-Greven, P. Dailey, G. Lozanski, V. Anderson and S. Macintyre, J. Biol. Chem., 1996, 271, 22245–22250 CrossRef CAS PubMed
.
- M. De Buck, M. Gouwy, J. M. Wang, J. Van Snick, G. Opdenakker, S. Struyf and J. Van Damme, Curr. Med. Chem., 2016, 23, 1725–1755 CrossRef CAS PubMed
.
- G. O. Oyeyinka, L. S. Salimonu, A. I. Williams, A. O. Johnson, O. A. Ladipo and B. O. Osunkoya, Afr. J. Med. Med. Sci., 1984, 13, 169–176 CAS
.
- J. L. Proc, M. A. Kuzyk, D. B. Hardie, J. Yang, D. S. Smith, A. M. Jackson, C. E. Parker and C. H. Borchers, J. Proteome Res., 2010, 9, 5422–5437 CrossRef CAS PubMed
.
- Y. Mohammed, B. J. van Vlijmen, J. Yang, A. J. Percy, M. Palmblad, C. H. Borchers and F. R. Rosendaal, Blood Adv., 2017, 1, 1080–1087 CrossRef CAS PubMed
.
Footnotes |
| † Electronic supplementary information (ESI) available. See DOI: 10.1039/c9an01893j |
| ‡ These authors contributed equally. |
| This journal is © The Royal Society of Chemistry 2020 |

