 Open Access Article
Creative Commons Attribution 3.0 Unported Licence
Effects of nanopores on the mechanical strength, osteoclastogenesis, and osteogenesis in honeycomb scaffolds
Koichiro
Hayashi
 * and
Kunio
Ishikawa
Department of Biomaterials, Faculty of Dental Science, Kyushu University, 3-1-1 Maidashi Higashi-ku, Fukuoka 812-8582, Japan. E-mail: khayashi@dent.kyushu-u.ac.jp; Fax: +81-92-642-6348; Tel: +81-92-642-6345
First published on 21st August 2020
Abstract
The scaffold chemical composition and pore architecture are critical for successful bone regeneration. Although the effects of chemical composition, micron-scale pores, and macropores (≥100 μm) are known, those of nanometer-scale pores (nanopores) are unknown. Here, honeycomb scaffolds (HCSs) composed of carbonate apatite and bone mineral, were fabricated with three distinct nanopore volumes, while other parameters were comparable between HCSs. Their compressive strengths and nanopore volumes linearly correlated. The HCSs were implanted into critical-sized bone defects (CSDs) in the rabbit femur distal epiphyses. The nanopore volume affected both osteoclastogenesis and osteogenesis. HCSs with nanopore volumes of ≥0.15 cm3 g−1 promoted osteoclastogenesis, contributing to bone maturation and bone formation within 4 weeks. However, HCSs with nanopore volumes of 0.07 cm3 g−1 promoted significantly less bone maturation and neoformation. Nevertheless, HCSs with nanopore volumes of ≥0.18 cm3 g−1 did not undergo continuous bone regeneration throughout the 12 week period due to excessive osteoclastogenesis, which favored HCS resorption over bone neoformation. When the nanopore volume was 0.15 cm3 g−1, osteoclastogenesis and osteogenesis progressed harmonically, resulting in HCS replacement with new bone. Our results demonstrate that the nanopore volume is critical for controlling osteoclastogenesis and osteogenesis. These insights may help establish a coherent strategy for developing scaffolds for different applications.
1. Introduction
A primary factor affecting the outcome of bone regeneration is the chemical composition of the scaffold.1 For example, carbonate apatite (CO3Ap), which is the main component of natural bone mineral, has superior osteoconductivity to β-tricalcium phosphate and hydroxyapatite (HAp),1–4 which are representative bone graft materials. Nevertheless, the outcome of bone regeneration is also profoundly governed by scaffold microstructures, such as pore architecture.5,6 It is generally accepted that pores of >100 μm in diameter, referred to as macropores, effectively aid bone ingrowth and vascularization.7,8 In contrast, the influences of micropores (<50 μm in diameter) had been overlooked. In 2010, Lan Levengood et al. first reported the importance of micropores for bone regeneration.9 Before that, although micropore importance was relatively neglected, it had been observed that bone formation in scaffolds with both macropores and micropores was more efficient when compared to scaffolds only with macropores.10–21 Following the report by Lan Levengood et al.,9 a few studies on the scaffold micropore effects have been reported.22–29 However, in some of these studies, the percentage of micropores (i.e., the microporosity) was not controlled,22,27 or the micropore sizes were not revealed.24,25 Furthermore, previous studies focused only on micropores with a size of >1 μm,22–29 and the influence of micropores with sizes less than a few hundred nanometers have not been evaluated at all. Thus, the effects of micropores on bone regeneration are still not sufficiently clarified.Micropores in scaffolds also affect mechanical strength,30,31 which is particularly important when scaffolds are used in highly loaded areas.32–34 Based on this relationship, the scaffold mechanical strength and microporosity should be controlled in accordance with the intended use. However, the relationship between the scaffold mechanical strength and microporosity should be further investigated.
To clarify the effects of micropores in scaffolds, factors other than micropores, e.g., the size, percentage, distribution, and interconnectivity of macropores, as well as their chemical composition, should be standardized between experimental groups. The honeycomb structure is suitable for investigating the effects of micropores because (1) it comprises uniformly sized cells that correspond to macropores (referred to as channels) and uniaxially and perfectly penetrate the scaffold, and (2) the uniformly thick cell walls (referred to as struts) and channels are orderly arranged.2,3,35–37 Thus, the architecture of macropores in honeycomb scaffolds (HCSs) can be precisely controlled. Furthermore, the chemical composition of HCSs is also controllable, and we have successfully fabricated HCSs with various chemical compositions.2,3
In this study, we evaluated the effects of micropores with sizes of less than a few hundred nanometers (designated as nanopores) in HCSs on their mechanical strength, bioresorption, and osteogenesis using three types of CO3Ap HCSs with different nanopore volumes. Other parameters, such as the carbonate content, macropore architecture, and nanopore size, were nearly equal between three sample groups.
2. Results and discussion
HCS green bodies were fabricated by extrusion molding using a mixture of CaCO3 powder and wax-based binder. Then, to remove organic compounds and sinter CaCO3, the HCS green bodies were heated up to 420, 450, 480, or 510 °C. Finally, the CaCO3 HCSs were immersed in 1 mol L−1 Na2HPO4 solution at 80 °C for 7 days to convert the HCS composition from CaCO3 to CO3Ap. The samples that were fabricated using CaCO3 HCSs subjected to heat treatment at 420, 450, 480, and 510 °C were designated as 420-, 450-, 480-, and 510-HCSs, respectively. The X-ray diffraction (XRD) patterns of 420-, 450-, and 480-HCSs were coincident with a single phase of apatite, whereas 510-HCSs were composed of a mixed phase of apatite and calcite (Fig. 1). These results demonstrated that the temperature should be set at ≤480 to completely convert the composition from calcite to apatite in dissolution–precipitation reactions. In the Fourier transform infrared (FT-IR) spectra of 420-, 450-, and 480-HCSs (Fig. 1B), absorption bands due to phosphate groups were detected at 1050, 570, and 605 cm−1, respectively.38,39 In addition, absorption bands due to carbonate groups were present in the carbonate ν3 (1470 and 1415 cm−1) and ν2 (880 cm−1) regions.38,39 The doublet bands at 1470 and 1415 cm−1 in the carbonate ν3 region indicated that both phosphate and hydroxy sites in apatite crystal were substituted with carbonate.38,39 The XRD and FT-IR results demonstrated that all 420-, 450-, and 480-HCSs were composed of AB-type CO3Ap.38,39 The carbonate contents of the 420-, 450-, and 480-HCSs were 12.1 ± 0.2, 12.1 ± 1.5, and 12.0 ± 0.1%, respectively. Thus, the carbonate contents of the 420-, 450-, and 480-HCSs were nearly equal.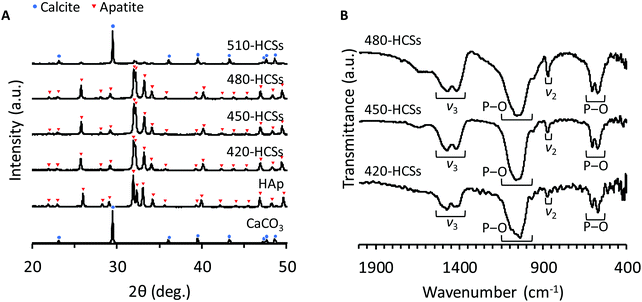 | ||
| Fig. 1 (A) XRD patterns of the 420-, 450-, 480-, and 510-HCSs; Hap; and CaCO3 (calcite). (B) FT-IR spectra of the 420-, 450-, and 480-HCSs. | ||
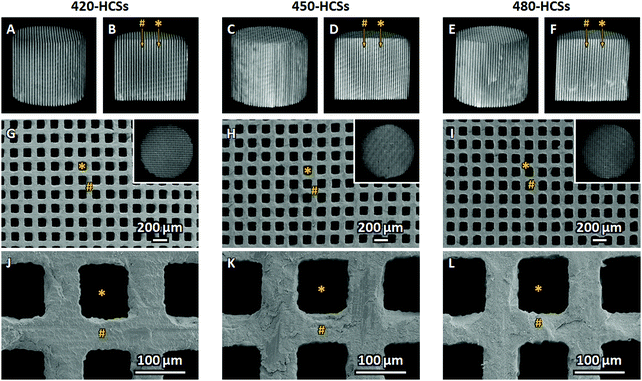
The μ-CT (Fig. 2A–E) and scanning electron microscopy (SEM; Fig. 2G–L) images clarified that all 420-, 450-, and 480-HCSs had honeycomb structures with uniaxially penetrating channels. The channels and struts were orderly arranged in an alternating pattern. The channel sizes of 420-, 450-, and 480-HCSs were 99.4 ± 1.7 μm, 99.7 ± 2.4 μm, and 99.2 ± 2.3 μm, respectively. The strut thicknesses of 420-, 450-, and 480-HCSs were 62.3 ± 0.8 μm, 62.9 ± 1.7 μm, and 63.7 ± 1.2 μm, respectively. Thus, all 420-, 450-, and 480-HCSs had uniformly sized macropores and struts, which were nearly equal in size between these HCSs.
The size distribution, volume, and specific surface area of the open pores in 420-, 450-, and 480-HCSs were measured by mercury-intrusion porosimetry. The pore size distribution revealed that all 420-, 450-, and 480-HCSs had both macropores and nanopores (Fig. 3A). The mode diameters of the 420-, 450-, and 480-HCS macropores were all 98.6 μm, which coincided with the channel sizes of these HCSs. The macropore volumes of the 420-, 450-, and 480-HCSs were 0.32, 0.31, and 0.30 cm3 g−1, respectively (Fig. 3B). The μ-computerized tomography (CT), SEM, and mercury-intrusion porosimetry results demonstrated that the 420-, 450-, and 480-HCSs had almost exactly the same macropore architectures. Furthermore, all 420-, 450-, and 480-HCSs had nanopores with a mode diameter of 75.6 nm, with nanopore sizes ranging from 20 to 200 nm (Fig. 3A). The nanopore volumes of 420-, 450-, and 480-HCSs were 0.18, 0.15, and 0.07 cm3 g−1, respectively (Fig. 3B). These results demonstrated that the nanopore sizes of the 420-, 450-, and 480-HCSs were nearly equal, while their nanopore volumes were profoundly different. The specific surface areas of the open pores in the 420-, 450-, and 480-HCSs were 20.8, 19.4, and 9.3 m2 g−1, respectively. Thus, the specific surface area increased with increasing nanopore volumes. The porosity of the open pores in the 420-, 450-, and 480-HCSs were 58.9, 54.9, and 50.8%, respectively.
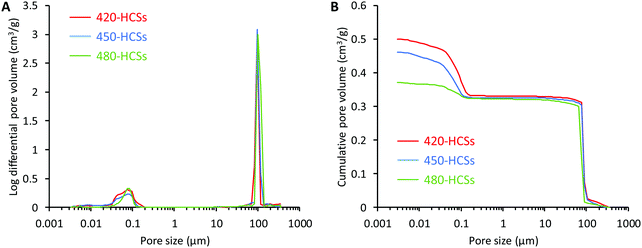 | ||
| Fig. 3 Results of mercury-intrusion porosimetry. (A) Pore size distribution and (B) cumulative pore volume vs. the pore diameter of 420-, 450-, and 480-HCSs. | ||
The total porosities of the 420-, 450-, and 480-HCS, which were calculated using their bulk density and HAp density, were 65.3 ± 1.3, 61.8 ± 1.3, and 57.6 ± 2.1%, respectively (Fig. 4A). Considering the open pore percentage measured by mercury-intrusion porosimetry, the percentages of closed pores in the 420-, 450-, and 480-HCS were ∼6.4, ∼6.9, and ∼6.8%, respectively. Thus, these HCSs had little difference in terms of their closed pore percentages. The compressive strengths of the 420-, 450-, and 480-HCSs were 46.5 ± 3.0, 66.2 ± 6.4, and 91.2 ± 8.7 MPa, respectively (Fig. 4B). Significant differences were observed in porosity and compressive strength between the 420-, 450-, and 480-HCSs. The HCS compressive strength bore a linear relationship with the total porosity (Fig. 4C), which is coincident with the previous reports.37,40 The macropore volume and closed pore percentage were nearly equal in 420-, 450-, and 480-HCSs, meaning that differences in total porosity between these HCSs depended on the nanopore volume. Thus, the HCS compressive strength linearly increased with decreasing HCS nanopore volumes. These results demonstrate that the HCS compressive strength can be easily controlled by modifying the HCS nanopore volume, which is simply achieved by adjusting the sintering temperature of the HCS green bodies.
 | ||
| Fig. 4 (A) Total porosities and (B) compressive strengths of 420-, 450-, and 480-HCSs. *P < 0.001. (C) The relationship between the compressive strength and total porosity is shown. | ||
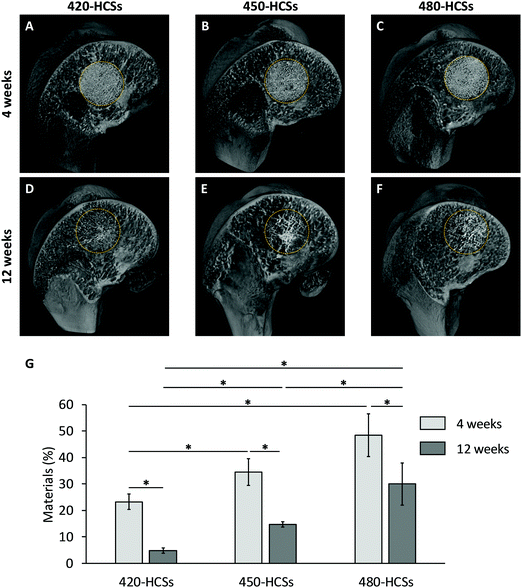
The above structural-analysis results demonstrated that only the nanopore volume differed between the 420-, 450-, and 480-HCSs, whereas other parameters such as the chemical composition, carbonate content, macropore architecture, closed pore porosity, and nanopore size were nearly equal. Thus, the 420-, 450-, and 480-HCSs could serve as proper materials for evaluating the effects of the nanopore volume on intravital events. To evaluate the effects of the nanopore volume, the 420-, 450-, and 480-HCSs were implanted into CSDs (6 mm in diameter and 5 mm in depth) in the rabbit femur:2 a CSD is defined as the smallest size intraosseous wound in a particular bone and species of animal that will not heal spontaneously during the lifetime of the animal, or a defect with <10% bone regeneration over the animal's lifetime.41 The μ-CT images showed that the 420-, 450-, and 480-HCSs remained in the bone defects while maintaining their honeycomb structure at 4 weeks after implantation (Fig. 5A–C). The volume percentages of the remaining 420-, 450-, and 480-HCSs in the bone defects at 4 weeks were 23.3 ± 3.1, 34.5 ± 5.0, and 48.5 ± 8.2%, respectively (Fig. 5G). At 12 weeks, the HCSs were expectedly resorbed (Fig. 5D–F). The volume percentages of the remaining 420-, 450-, and 480-HCSs at 12 weeks were 4.8 ± 1.0, 14.7 ± 1.1, and 30.0 ± 7.9%, respectively (Fig. 5G). These results demonstrated that these HCSs were gradually resorbed over time and that the HCS resorption speed significantly increased with increasing nanopore volumes.
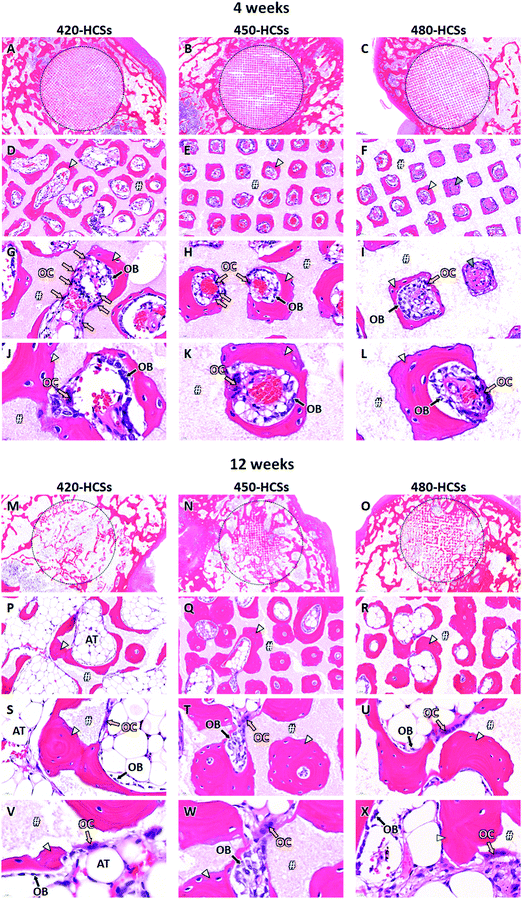
More detailed effects of nanopore volume on intravital events were evaluated by histological analyses. Four weeks after implantation, a portion of the 420-HCS struts was resorbed, and consequently, multiple channels were connected (Fig. 6A, D, G, and J). Abundant osteoclasts were present on the strut surface (Fig. 6G), indicating that osteoclasts participate to strut resorption. Mature bone (MB) was newly formed along the remaining struts after osteoclastic resorption, and numerous osteoblasts were present on the new bone surface (Fig. 6G and J). In the 450-HCS-implanted group, the struts were also resorbed by osteoclasts on the strut surface (Fig. 6B, E, H, and K), whereas the 450-HSCs showed less resorption than the 420-HCSs. Furthermore, as observed with the 450-HCS-implanted group, MB formed along the struts and osteoblasts laying on the MB surface (Fig. 6H and K). In the 480-HCS-implanted group, unlike the 420- and 450-HCS-implanted groups, both immature bone (IMB) and MB tissues were detected in the channels (Fig. 6C, F, I, and L). Osteoblasts and osteoclasts were present in the MB and strut surfaces, respectively (Fig. 6I and L).
At 12 weeks post-implantation, the 420-HCSs were massively resorbed (Fig. 6M, P, S, and V). MB formed around the remaining materials (Fig. 6P and S). Osteoclasts and osteoblasts were present on the surfaces of the remaining materials and MB, respectively (Fig. 6S and V). Furthermore, characteristic bone marrow-like adipose tissues formed in the regions remaining after massive resorption of 420-HCSs (Fig. 6M, P, and S). Su et al. reported that fast scaffold degradation facilitates bone neoformation.42 However, this evaluation was conducted using an animal model with bone defects smaller than the CSDs. As a result, the defects were filled with new bone even in control animals, which underwent no treatment. Previous studies conducted using animal models with CSDs demonstrated that untreated CSDs were naturally filled with adipose tissues.2,43 In the present study, massive and fast resorption of the 420-HCSs inferred the appearance of an environment similar to that observed in an empty bone defect, resulting in adipose tissue naturally filling the defect. In the 450-HCS-implanted group, the degree of material resorption at 12 weeks was increased compared to that at 4 weeks (Fig. 6N, Q, T, and W). Abundant MB formed along the struts and filled in the channels (Fig. 6Q and T). Osteoclasts and osteoblasts lay on the surfaces of the remaining materials and MB, respectively (Fig. 6T and W). In the 480-HCS-implanted group, material resorption also clearly progressed (Fig. 6O, R, U, and X). Although IMB was observed at 4 weeks post-treatment, only MB was detected at 12 weeks. As observed with the 420- and 450-HCS-implanted groups, osteoclasts, and osteoblasts laid on the surfaces of the remaining materials and MB, respectively, with the 480-HCS-implanted group (Fig. 6U and X).
The percentages of MB, IMB, and materials in the bone defect and the number of osteoclasts per square millimeter of bone defect were calculated from the histological findings. Four weeks post-implantation, the percentages of MB (24.0 ± 0.9%) and IMB (2.5 ± 0.7%) in the 420-HCS-implanted group were nearly equal to the corresponding percentages (MB 23.7 ± 2.0%; IMB 2.5 ± 0.8%) in the 450-HCS-implanted group (Fig. 7A and B). In contrast, at 4 weeks, the percentages of MB (11.8 ± 1.9%) and IMB (4.8 ± 0.5%) in the 480-HCS-implanted group were significantly lower and higher, respectively, than those in the 420- and 450-HCS-implanted groups, respectively (Fig. 7A and B). At 12 weeks, the MB percentage (21.7 ± 1.9%) in the 420-HCS-implanted group was significantly lower than those in the 450- and 480-HCS-implanted groups, while the MB percentage (39.0 ± 2.6%) in the 450-HCS-implanted group was nearly equal to that (35.5 ± 1.6%) in the 480-HCS-implanted group (Fig. 7A). Notably, the MB percentage in the 420-HCS-implanted group was almost unchanged from 4 weeks until 12 weeks, whereas those in the 450- and 480-HCS-implanted groups increased significantly over this period (Fig. 7A). The IMB percentages at 12 weeks were zero in all groups (Fig. 7B). At both 4 and 12 weeks, the 420-HCS-implanted group (23.8 ± 1.5% at 4 weeks and 5.3 ± 2.3% at 12 weeks) showed the lowest remaining material percentage, followed by the 450-HCS-implanted group (31.4 ± 2.8% at 4 weeks and 14.7 ± 1.8% at 12 weeks) and the 480-HCS-implanted group (43.6 ± 1.5% at 4 weeks and 24.5 ± 5.2% at 12 weeks) (Fig. 7C). In all groups, the remaining material percentages significantly decreased from 4 weeks to 12 weeks (Fig. 7C). The remaining material percentage estimated from the histological findings coincided with that estimated from μ-CT images (Fig. 5). At 4 weeks, the largest number of osteoclasts was present in the 420-HCS-implanted group (45.7 ± 7.5 cells mm−2), followed by the 450-HCS-implanted group (30.7 ± 5.9 cells mm−2) and the 480-HCS-implanted group (17.8 ± 4.3 cells mm−2) (Fig. 7D). At 12 weeks, no significant difference was found in the osteoclast population densities in the 420-, 450-, and 480-HCS-implanted groups, which were 8.0 ± 5.5, 10.9 ± 9.0, and 7.3 ± 3.6 cells mm−2, respectively (Fig. 7D).
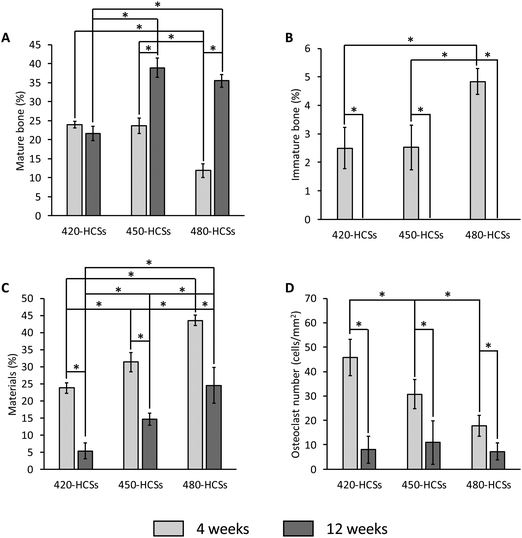 | ||
| Fig. 7 Area percentages of (A) newly formed mature bone, (B) immature bone, and (C) the remaining materials in each bone defect. (D) The osteoclast density in each bone defect is shown. *P < 0.01. | ||
The above in vivo experimental results demonstrated that the nanopore volume strongly influenced the replacement of HCSs with bone tissue. The relationship between the influence of the nanopore volume on HCS replacement is discussed in detail below. An increased nanopore volume prompts bone maturation. Based on the results at 4 weeks post-implantation, bone maturation was prompted when the nanopore volume was ≥0.15 cm3 g−1, whereas the IMB percentage was significantly higher when the nanopore volume was 0.07 cm3 g−1. Therefore, the threshold for effectively maturating bone was between 0.15 cm3 g−1 and 0.07 cm3 g−1. Nevertheless, an excessive increase in the nanopore volume negatively affects long-term bone formation because the number of osteoclasts linearly correlates with nanopore volume, resulting in an excessively rapid HCS resorption rate. Results showed that, when the nanopore volume was ≥0.18 cm3 g−1, the osteoclast number was significantly higher at 4 weeks, and a large proportion of the HCSs disappeared at 12 weeks. For this reason, the MB percentage at 12 weeks was comparable to that at 4 weeks. When the nanopore volume was ≤0.15 cm3 g−1, the HCSs remained at 12 weeks post-treatment, resulting in abundant MB formation. Thus, when the nanopore volume was 0.15 cm3 g−1, the HCSs were steadily replaced by bone tissue.
The above effects of the nanopore volume can be discussed from the perspective of the relationship between the material surface roughness and osteoclastogenesis because the nanopore volume linearly correlates with surface roughness. To date, multiple studies revealed that rough metal implants with micron-scale pores promote osteoclastogenesis.44–51 Similar results were obtained here, although the HCSs were composed of ceramics (instead of metal), their pore size was on the nanoscale (rather than the micron-scale), and their increased nanopore volume (i.e., increased surface roughness) elicited elevated osteoclastogenesis. Thus, nanopores contribute to osteoclastogenesis, and the nanopore volume dominantly affects the degree of osteoclastogenesis. Osteoclasts can promote bone formation by communicating with osteoblastic cells in a process referred to as “coupling of the bone formation to resorption”.52 In this process, osteoclasts recruit osteoblastic cells and promote osteogenic differentiation. Those findings and the current results indicate that the scaffold nanopore volume modulates osteoclastogenesis, which further affects both scaffold resorption and osteogenesis. In addition, the data generated in this study provide important details regarding effective nanopore volumes for osteoclastogenesis and osteogenesis. Nevertheless, the possibility that optimal nanopore volume varies depending on animal species and models cannot be denied based on reported differences in skeletal change and bone turnover speeds between rabbits, primates, and some rodents.53 Although the bone mineral density and fracture toughness of diaphyseal bone are reportedly similar between rabbits and humans,54 further investigation of the influence of animal species and models on the optimal nanopore volume is warranted.
The present study demonstrated that nanopore effects on tissue dynamically evolves until 12 weeks post-implantation. For longer implantation period, however, nanopore effects remain unknown. Nevertheless, Šponer et al. reported that between 3 and 6 months post-operation, the resorption percentage of calcium-deficient hydroxyapatite was 3.2–5.4% and the percentage of new bone increased by 0.5–6.2%.55 Therefore, when the resorption speeds of 450-HCSs and 480-HCSs harmonize with bone formation speed, the percentage of new bone may increase over a longer implantation period. Future studies will clarify nanopore effects on tissue changes over a longer implantation period.
3. Conclusion
HCSs with three different nanopore volumes were successfully fabricated by controlling the sintering temperature of HC green bodies. These HCSs had nearly equal chemical compositions, macropore architectures, and nanopore sizes. The HCS compressive strength decreased linearly with increasing nanopore volumes. In addition, as the nanopore volume increased, the osteoclast number increased, and HCS resorption accelerated, which affected bone maturation and formation. When HCS nanopore volume was 0.15 cm3 g−1, both osteoclastogenesis and osteogenesis harmoniously proceeded, and favorable replacement of HCSs by bone occurred throughout the 12 week period. The results of this study indicate that controlling the nanopore volume is an effective strategy for controlling scaffold mechanical strength and replacement with bone, which is useful for developing scaffolds for different applications.4. Experimental section
4.1. Fabrication of CO3Ap HCSs with different nanopore volumes
We successfully fabricated CO3Ap HCSs using Ca(OH)2 and CaSO4 as raw materials.2,3,35–37 However, our previous method using these raw materials could not be used to control the nanopore volume in CO3Ap HCSs. In this study, therefore, we used CaCO3 as the raw material because the degree of CaCO3 sintering can be easily controlled, and control of the sintering degree enables control of the nanopore volume in CO3Ap HCSs. Three types of CO3Ap HCSs with different nanopore volumes were fabricated, as described below. First, HCS green bodies were fabricated by extrusion molding using a mixture of CaCO3 powder (Shiraishi Kogyo, Osaka, Japan) and wax-based binder (Nagamine Manufacturing, Kagawa, Japan). The volume ratio of CaCO3 to wax-based binder was ∼1. The used extruder was purchased from Toyo Seiki Seisaku-syo (Tokyo, Japan). Then, to remove organic compounds and sinter CaCO3, the HCS green bodies were heated up to 420, 450, 480, or 510 °C with a heating rate of 0.1 °C min−1 and held at each temperature for 24 h. As a result, we obtained CaCO3 HCSs with different degrees of sintering. Finally, the CaCO3 HCSs were immersed in 1 mol L−1 Na2HPO4 solution at 80 °C for 7 days to convert the HCS composition from CaCO3 to CO3Ap. The obtained CO3Ap HCSs were washed at least five times with distilled water.4.2. Characterization of CO3Ap HCSs
The crystal phases of samples were measured by XRD, using a D8 Advanced diffractometer (Bruker AXS GmbH, Karlsruhe, Germany). The FT-IR spectra were measured using an FT/IR-6200 spectrometer (JASCO Corporation, Tokyo, Japan). The microstructure of each sample was observed by SEM (S3400N, Hitachi High Technologies, Tokyo, Japan) and μ-CT imaging (SkyScan, Bruker, MA). The carbonate content of each sample was measured by performing carbon, hydrogen, and nitrogen analysis with an MT-6 Elemental Analyzer (Yanako Analytical Instruments, Kyoto, Japan). Eight samples per group were used to determine the average carbonate content. The size distribution, volume, specific surface area, and porosity of the open pores in each sample were determined using a mercury porosimeter (AutoPore 9420, Shimadzu Corp., Kyoto, Japan). The compressive strength of each sample was measured using a universal testing machine (Autograph AGS-J, Shimadzu Corp., Kyoto, Japan). The samples were compressed with the load cell oriented in parallel with the HCS channels. Eight samples per group were used to determine the average compressive strength. The total porosity of each sample was determined from its bulk density (determined from each block's weight and volume) and calculated using the theoretical density of HAp (3.16 g cm−3). Eight samples per group were studied to determine the average porosity.4.3. Animal experiments
The animal experiments conducted in this study were approved by the Animal Care and Use Committee of Kyushu University (No. A30-338-1; issued Jun 13, 2019). Japanese white rabbits (male; age, 18–19 weeks; weight, 3.0–3.5 kg) were purchased from Japan SLC (Hamamatsu, Japan). These rabbits were housed in the Center of Biomedical Research, Research Center for Human Disease Modeling, Graduate School of Medical Sciences, Kyushu University. They were maintained on a standard diet and water. For sample implantation, the rabbits were first anesthetized via intraperitoneal injection of a mixture of ketamine (30 mg kg−1) and xylazine (5.0 mg kg−1). Second, the rabbits’ rear limbs were shaved to remove the fur, and the skin was disinfected with 10% w/v povidone-iodine (Meiji Seika Pharma, Tokyo, Japan). Third, a cylindrical hole with 6 mm diameter and 5 mm depth, which is a CSD,2 was drilled into the rabbit femur distal epiphysis. Then, 420-, 450-, and 480-HCSs were implanted in both femurs. Finally, the fasciae were sutured shut, and rabbits were allowed unrestrained movement in their cages after they recovered from the anesthesia. For μ-CT imaging and histological analyses (performed to evaluate the bioresorption and bone formation abilities of the samples), the rabbits were euthanized in batches at 4 and 12 weeks after implantation with 420-, 450-, and 480-HCSs, and the distal epiphysis of each femur was harvested (n = 4 per group). The μ-CT images were obtained using a μ-CT scanner (SkyScan, Bruker, MA). The % area of materials, MB defects, and IMB defects were estimated by studying hematoxylin & eosin (HE)-stained tissue sections with a BZ-X Digital Analyzer (Keyence, Osaka, Japan).Conflicts of interest
There are no conflicts to declare.Acknowledgements
This study was supported, in part, by AMED under grant no. JP20im0502004 and JSPS KAKENHI grant no. JP19K22970.References
- N. Yamasaki, M. Hirao, K. Nanno, K. Sugiyasu, N. Tamai, N. Hashimoto, H. Yoshikawa and A. Myoui, J. Biomed. Mater. Res., Part B, 2009, 91B, 788 CrossRef CAS PubMed
.
- K. Hayashi, R. Kishida, A. Tsuchiya and K. Ishikawa, ACS Appl. Bio Mater., 2020, 3, 1787 CrossRef CAS
.
- K. Hayashi, R. Kishida, A. Tsuchiya and K. Ishikawa, Mater. Today Bio, 2019, 4, 100031 CrossRef CAS PubMed
.
- K. Ishikawa, Y. Miyamoto, A. Tsuchiya, K. Hayashi, K. Tsuru and G. Ohe, Materials, 2018, 11, 1993 CrossRef PubMed
.
- F. S. L. Bobbert and A. A. Zadpoor, J. Mater. Chem. B, 2017, 5, 6175 RSC
.
- V. Karageorgiou and D. Kaplan, Biomaterials, 2005, 26, 5474 CrossRef CAS PubMed
.
- S. F. Hulbert, F. A. Young, R. S. Mathews, J. J. Klawitter, C. D. Talbert and F. H. Stelling, J. Biomed. Mater. Res., 1970, 4, 433 CrossRef CAS PubMed
.
- C. M. Murphy, M. G. Haugh and F. J. O'Brien, Biomaterials, 2010, 31, 461 CrossRef CAS PubMed
.
- S. K. L. Levengood, S. J. Polak, M. B. Wheeler, A. J. Maki, S. G. Clark, R. D. Jamison and A. J. W. Johnson, Biomaterials, 2010, 31, 3552 CrossRef PubMed
.
- M. F. Basle, A. Rebel, F. Grizon, G. Daculsi, N. Passuti and R. Filmon, J. Mater. Sci.: Mater. Med., 1993, 4, 273 CrossRef CAS
.
- A. Boyde, A. Corsi, R. Quarto, R. Cancedda and P. Bianco, Bone, 1999, 24, 579 CrossRef CAS PubMed
.
- M. Chazono, T. Tanaka, S. Kitasato, T. Kikuchi and K. Marumo, J. Orthop. Sci., 2008, 13, 550 CrossRef CAS PubMed
.
- J. G. Dellinger, J. A. C. Eurell and R. D. Jamison, J. Biomed. Mater. Res., Part A, 2006, 76A, 366 CrossRef CAS PubMed
.
- R. D. A. Gaasbeek, H. G. Toonen, R. J. van Heerwaarden and P. Buma, Biomaterials, 2005, 26, 6713 CrossRef CAS PubMed
.
- S. K. L. Levengood, S. J. Polak, M. J. Poellmann, D. J. Hoelzle, A. J. Maki, S. G. Clark, M. B. Wheeler and A. J. W. Johnson, Acta Biomater., 2010, 6, 3283 CrossRef CAS PubMed
.
- J. Malmstrom, C. Slotte, E. Adolfsson, O. Norderyd and P. Thomsen, Clin. Oral. Implants Res., 2009, 20, 379 CrossRef PubMed
.
- H. O. Mayr, M. Dietrich, F. Fraedrich, R. Hube, A. Nerlich, R. von Eisenhart-Rothe, W. Hein and A. Bernstein, Arthroscopy, 2009, 25, 996 CrossRef PubMed
.
- J. L. Simon, S. Michna, J. A. Lewis, E. D. Rekow, V. P. Thompson, J. E. Smay, A. Yampolsky, J. R. Parsons and J. L. Ricci, J. Biomed. Mater. Res., Part A, 2007, 83A, 747 CrossRef CAS PubMed
.
- C. A. Vanblitterswijk, J. J. Grote, W. Kuijpers, W. T. Daems and K. Degroot, Biomaterials, 1986, 7, 137 CrossRef CAS
.
- H. Yamasaki and H. Sakai, Biomaterials, 1992, 13, 308 CrossRef CAS PubMed
.
- I. R. Zerbo, A. Bronckers, G. de Lange and E. H. Burger, Biomaterials, 2005, 26, 1445 CrossRef CAS PubMed
.
- A. Bernstein, P. Niemeyer, G. Salzmann, N. P. Suedkamp, R. Hube, J. Klehm, M. Menzel, R. von Eisenhart-Rothe, M. Bohner, L. Goerz and H. O. Mayr, Acta Biomater., 2013, 9, 7490 CrossRef CAS PubMed
.
- M. Bohner, G. Baroud, A. Bernstein, N. Doebelin, L. Galea, B. Hesse, R. Heuberger, S. Meille, P. Michel, B. von Rechenberg, J. Sague and H. Seeherman, Mater. Today, 2017, 20, 106 CrossRef CAS
.
- O. Chan, M. J. Coathup, A. Nesbitt, C. Y. Ho, K. A. Hing, T. Buckland, C. Campion and G. W. Blunn, Acta Biomater., 2012, 8, 2788 CrossRef CAS PubMed
.
- M. J. Coathup, K. A. Hing, S. Samizadeh, O. Chan, Y. S. Fang, C. Campion, T. Buckland and G. W. Blunn, J. Biomed. Mater. Res., Part A, 2012, 100A, 1550 CrossRef CAS PubMed
.
- M. J. Coathup, G. W. Blunn, C. Campion, C.-Y. Ho and K. A. Hing, J. Biomed. Mater. Res., Part B, 2017, 105, 805 CrossRef CAS PubMed
.
- M. Draenert, A. Draenert and K. Draenert, Microsc. Res. Tech., 2013, 76, 370 CrossRef CAS PubMed
.
- S. J. Polak, L. E. Rustom, G. M. Genin, M. Talcott and A. J. W. Johnson, Acta Biomater., 2013, 9, 7977 CrossRef CAS PubMed
.
- L. E. Rustom, T. Boudou, S. Lou, I. Pignot-Paintrand, B. W. Nemke, Y. Lu, M. D. Markel, C. Picart and A. W. Johnson, Acta Biomater., 2016, 44, 144 CrossRef CAS PubMed
.
- C. Jungreuthmayer, S. W. Donahue, M. J. Jaasma, A. A. Al-Munajjed, J. Zanghellini, D. J. Kelly and F. J. O'Brien, Tissue Eng., Part A, 2009, 15, 1141 CrossRef CAS PubMed
.
- J. A. Sanz-Herrera, J. M. Garcia-Aznar and M. Doblare, Biomech. Model. Mechanobiol., 2008, 7, 355 CrossRef CAS PubMed
.
- H. Noguchi, M. Koda, T. Funayama, H. Kumagai, T. Abe, K. Nagashima, K. Miura, K. Mataki, K. Fujii and M. Yamazaki, J. Clin. Neurosci., 2019, 62, 46 CrossRef PubMed
.
- H. Noguchi, M. Koda, T. Funayama, H. Kumagai, J. Saito, C. Mannoji, M. Aramomi, T. Abe, K. Nagashima, K. Miura, K. Mataki, K. Fuji, T. Furuya and M. Yamazaki, J. Clin. Neurosci., 2018, 56, 50 CrossRef CAS PubMed
.
- J. Onodera, E. Kondo, N. Omizu, D. Ueda, T. Yagi and K. Yasuda, Knee Surg. Sports Traumatol. Arthrosc., 2014, 22, 2763 CrossRef PubMed
.
- K. Hayashi, R. Kishida, A. Tsuchiya and K. Ishikawa, Adv. Biosyst., 2019, 3, 1900140, DOI:10.1002/adbi.201900140
.
- K. Hayashi, M. L. Munar and K. Ishikawa, Ceram. Int., 2019, 45, 15429 CrossRef CAS
.
- K. Hayashi, M. L. Munar and K. Ishikawa, Mater. Sci. Eng., C, 2020, 111, 110848, DOI:10.1016/j.msec.2020.110848
.
-
T. Theophile, Infrared Spectroscopy – Materials Science, Engineering and
Technology, IntechOpen, London, 2012, ch. 6 Search PubMed
.
- H. Madupalli, B. Pavan and M. M. J. Tecklenburg, J. Solid State Chem., 2017, 255, 27 CrossRef CAS PubMed
.
- ed. F. Pospisil, J. Jambor, J. Belko and F. H. Wittman, Advances in Autoclaved Aerated Concrete, 1992, pp. 77–81 Search PubMed
.
- Z. Gugala and S. Gogolewski, J. Orthop. Trauma, 1999, 13, 187 CrossRef CAS PubMed
.
- W. Su, X. Ma, Z. Sun, Z. Yi, X. Cui, G. Chen, X. Chen, B. Guo and X. Li, J. Mater. Chem. B, 2018, 6, 4338 RSC
.
- Y. Ye, Y. Pang, Z. Zhang, C. Wu, J. Jin, M. Su, J. Pan, Y. Liu, L. Chen and K. Jin, Macromol. Biosci., 2018, 18, e1700424 CrossRef PubMed
.
- W. Khang, S. Feldman, C. E. Hawley and J. Gunsolley, J. Periodontol., 2001, 72, 1384 CrossRef CAS PubMed
.
- M. M. Shalabi, A. Gortemaker, M. A. Van't Hof, J. A. Jansen and N. H. J. Creugers, J. Dent. Res., 2006, 85, 496 CrossRef CAS PubMed
.
- P. Trisi, R. Lazzara, A. Rebaudi, W. Rao, T. Testori and S. S. Porter, J. Periodontol., 2003, 74, 945 CrossRef PubMed
.
- W. Zechner, N. Trinkl, G. Watzak, D. Busenlechner, G. Tepper, R. Haas and G. Watzek, Int. J. Oral Maxillofac. Implants, 2004, 19, 216 Search PubMed
.
- J. Brinkmann, T. Hefti, F. Schlottig, N. D. Spencer and H. Hall, Biointerphases, 2012, 7 Search PubMed
.
- S. Makihira, Y. Mine, E. Kosaka and H. Nikawa, Dent. Mater. J., 2007, 26, 739 CrossRef CAS PubMed
.
- M. Nagasawa, L. F. Cooper, Y. Ogino, D. Mendonca, R. Liang, S. Yang, G. Mendonca and K. Uoshima, J. Dent. Res., 2016, 95, 319 CrossRef CAS PubMed
.
- B. Sommer, R. Felix, C. Sprecher, M. Leunig, R. Ganz and W. Hofstetter, J. Biomed. Mater. Res., Part A, 2005, 72A, 67 CrossRef CAS PubMed
.
- N. A. Sims and T. J. Martin, BoneKEy Rep., 2014, 3, 481 Search PubMed
.
- S. Castañeda, R. Largo, E. Calvo, F. Rodriguez-Salvanes, M. E. Marcos, M. Diaz-Curiel and G. Herrero-Beaumont, Skeletal. Radiol., 2006, 35, 34 CrossRef PubMed
.
- X. Wang, J. D. Mabrey and C. M. Agrawal, Bio-Med. Mater. Eng., 1998, 8, 1 CAS
.
- P. Šponer, M. Strnadová and K. Urban, Int. Orthop., 2011, 35, 1553 CrossRef PubMed
.
| This journal is © The Royal Society of Chemistry 2020 |

