Interlayer modification and single-layer exfoliation of the Ruddlesden–Popper perovskite oxynitride K2LaTa2O6N to improve photocatalytic H2 evolution activity†
Yuta
Shiroma‡
a,
Hiroto
Mogi‡
a,
Takeaki
Mashiko
b,
Shuhei
Yasuda§
c,
Shunta
Nishioka
 a,
Toshiyuki
Yokoi
 c,
Shintaro
Ida
 d,
Koji
Kimoto
b and
Kazuhiko
Maeda
 *ae
*ae
aDepartment of Chemistry, School of Science, Tokyo Institute of Technology, 2-12-1-NE-2 Ookayama, Meguro-ku, Tokyo, 152-8550, Japan. E-mail: maedak@chem.titech.ac.jp
bElectronic Functional Materials Group, Polymer Materials Unit, National Institute for Materials Science, 1-1 Namiki, Tsukuba, Ibaraki, 305-0044, Japan
cNanospace Catalysis Unit, Institute of Innovative Research, Tokyo Institute of Technology, 4259 Nagatsuta-cho, Midori-ku, Yokohama, 226-8503, Japan
dInstitute of Industrial Nanomaterials (IINa), Kumamoto University, 2-39-1 Kurokami, Chuo-ku, Kumamoto, 860-8555, Japan
eLiving Systems Materialogy (LiSM) Research Group, International Research Frontiers Initiative (IRFI), Tokyo Institute of Technology, 4259 Nagatsuta-cho, Midori-ku, Yokohama, Kanagawa 226-8502, Japan
First published on 11th April 2023
Abstract
Modification of the interlayer nanospaces of lamellar solids is an effective means of enhancing the physical properties and chemical functions of such materials. The present work demonstrates the interlayer modification of the layered perovskite oxynitride K2LaTa2O6N, a photocatalyst having a ∼600 nm absorption edge and exhibiting visible-light-driven H2 evolution activity. This material was subjected to various interlayer modifications, including H+/K+ exchange, ethylamine (EA) intercalation and exfoliation with tetra(n-butyl)ammonium hydroxide (with subsequent restacking) while maintaining its capacity for visible light absorption. H2 evolution activity from aqueous methanol with the aid of an optimal amount of a Pt cocatalyst was improved by a factor of approximately 60 following EA intercalation to increase the interlayer spacing of the host material. However, subsequent exfoliation-restacking to yield flocculated nanosheets led to a decrease in activity as compared with the EA-intercalated specimen. The present results indicate that the intercalation of EA provided interlayer nanospaces suitable for Pt cocatalyst loading and so promoted the photocatalytic H2 evolution reaction, while the restacked nanosheets did not provide space for Pt loading.
Introduction
Two-dimensional materials exhibiting unique structural and electronic properties have many potential applications.1–5 In addition, the modification of the interlayer nanospaces in lamellar solids by adding guest molecules or nanoclusters can produce various functional materials, including catalysts, photocatalysts, pigments and protonic conductors.4,6 As an example, expanding the interlayer nanospaces of layered metal oxides is an effective approach for improving the photocatalytic activities of these materials by promoting the reactions of intercalated molecules.7,8 In addition, many lamellar solids, including layered metal oxides, can be exfoliated to produce nanoscale sheets.9–11 The resulting metal oxide nanosheets comprise anisotropic, nanosized single crystals having a thickness of 1–2 nm and lateral dimensions ranging from several hundreds of nm to the μm scale. These materials represent useful building blocks for the fabrication of multi-component photosystems in the form of particles12–14 or thin films.15,16 In fact, much effort has been devoted to applying oxide-based layered solids as functional materials, and so many approaches to interlayer modification have been developed, including the exfoliation of metal oxides.Mixed anion compounds have recently received considerable attention as potential functional materials, and the interlayer modification of lamellar mixed anion compounds is of interest.17–19 As an example, the exfoliation of nitrogen-doped layered CsCa2Ta3O10 (CsCa2Ta3O9.7N0.2) as a means of synthesizing a heterogenous photocatalyst has been reported.20 In some cases, phase-pure undoped layered oxynitrides are preferable to their nitrogen-doped analogues because the former exhibit superior visible light absorption and limited formation of anion vacancies due to aliovalent O2−/N3− exchange.21 However, the interlayer modification of undoped layered oxynitrides has rarely been reported. This lack of studies can be attributed to the poor stability of undoped layered oxynitrides in the aqueous media22 used for interlayer modification. The chemical instability of these materials is a serious challenge, as this instability leads to the loss of nitrogen. This effect eventually lowers the visible light absorption capacity of the compound.
Recently, we found some exceptional cases of chemically stable layered oxynitrides, which include K2LaTa2O6N23 and K2Ca2Ta3O9N.24 Ida et al. reported that a three-layer specimen of the oxynitride perovskite Na2Ca2Ta3O9N could be exfoliated to produce nanoscale sheets. These sheets exhibited photocatalytic water splitting activity and were also able to transition to a free-standing film.25 The present work demonstrates the interlayer modification and single layer exfoliation of the Ruddlesden–Popper oxynitride K2LaTa2O6N with the aim of obtaining high photocatalytic activity. K2LaTa2O6N, which has a structure comprising two-layer perovskite blocks, undergoes H+/K+ exchange in water while maintaining a suitable degree of visible light absorption.23,26 This material also shows much higher photocatalytic activity than the three-layer analogue because of a longer photogenerated free electron lifetime.24
Therefore, the application of K2LaTa2O6N to photocatalytic reactions after suitable modification is of interest. The interlayer nanospaces in layered metal oxide photocatalysts are typically employed as reaction sites.7,12,13,27–29 However, this technique has rarely been applied to undoped layered oxynitrides. This study confirms that the interlayer modification of the layered oxynitride, K2LaTa2O6N, with a Pt cocatalyst improves photocatalytic activity during visible-light-driven H2 evolution.
Experimental
Synthesis of layered K2LaTa2O6N
The synthesis was done according to a previously reported procedure with minor modifications.23,26 Briefly, CsLaTa2O7 was first synthesized using a polymerized complex method employing Cs2CO3 (≥99.5%; Kanto Chemicals Co.), La(NO3)3·6H2O (≥99.0%; Kanto Chemicals Co.) and TaCl5 (≥99.9%; Mitsuwa Chemicals Co.) with calcination in air at 1273 K for 2 h. The resulting material was then subjected to a topochemical cation exchange reaction in molten KNO3 (≥99.0%; Wako Pure Chemicals Co.) at 673 K for 48 h to obtain KLaTa2O7. K2LaTa2O6N was produced by heating the as-prepared KLaTa2O7 together with 75 mol% K2CO3 (≥99.5%; Kanto Chemicals Co.) in a tube furnace at 1173 K for 3 h under a 50 mL min−1 flow of gaseous ammonia (≥99.9995%; Sumitomo Seika Chemicals Co.).Intercalation of ethylamine into K2LaTa2O6N
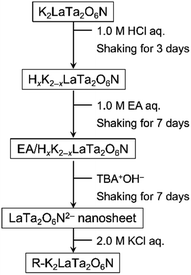
Proton-exchanged K2LaTa2O6N (referred to hereafter as HxK2−xLaTa2O6N) was obtained by adding K2LaTa2O6N (1.0 g) to a 1 M aqueous HCl solution (100 mL) followed by stirring for 3 days. After that, the HCl solution was removed, and the solid product was washed with pure water, separated by centrifugation and dried at room temperature. A portion of the resulting HxK2−xLaTa2O6N powder (1.0 g) was subsequently dispersed in a 1.0 M ethylamine (EA; 70 wt% in water; Kanto Chemicals) aqueous solution (100 mL). After agitating this suspension for 7 days at 180 rpm, the solid was collected by centrifugation and then dried overnight at 343 K. The material obtained from this process is referred to herein as EA/HxK2−xLaTa2O6N. The intercalation of n-alkylamines such as EA into protonated layered perovskite oxides is known to proceed via acid–base interactions.11,30–34 Analyses using solid-state NMR spectroscopy have also confirmed that the intercalated n-alkylamines are present in such materials as the corresponding alkyl ammonium cations.31–34Exfoliation of EA/HxK2−xLaTa2O6N and restacking
A quantity of the EA/HxK2−xLaTa2O6N (0.5 g) was added to an aqueous tetra(n-butyl)ammonium hydroxide (TBAOH; 40 wt% in water; Aldrich) solution (50 mL) and stirred for 7 days to exfoliate the material into nanosheets. Note that the TBAOH:EA/HxK2−xLaTa2O6N molar ratio in this mixture was 1![[thin space (1/6-em)]](https://www.rsc.org/images/entities/char_2009.gif) :
:![[thin space (1/6-em)]](https://www.rsc.org/images/entities/char_2009.gif) 1. Any unexfoliated solid was removed by spontaneous precipitation during the first 24 h of this process leaving the supernatant as a nanosheet suspension. Trials, in which the suspended nanosheets were reacted with KCl to induce the formation of a solid, showed that the nanosheet concentration in this dispersion was on the order of 4 g L−1.
1. Any unexfoliated solid was removed by spontaneous precipitation during the first 24 h of this process leaving the supernatant as a nanosheet suspension. Trials, in which the suspended nanosheets were reacted with KCl to induce the formation of a solid, showed that the nanosheet concentration in this dispersion was on the order of 4 g L−1.
Restacked material was obtained by adding a 2.0 M aqueous KCl solution dropwise to the nanosheet suspension. The flocculated solid formed by this addition was then collected by centrifugation and dried in an oven overnight at 333 K. The resulting restacked nanosheets are referred to herein as R–K2LaTa2O6N. The entire materials preparation procedure is depicted in Scheme 1.
Characterization
Powder X-ray diffraction (XRD) patterns were obtained using a Rigaku MiniFlex600 with Cu Kα radiation over the range of 3°–60°. Solid-state 13C cross-polarization/magic-angle spinning nuclear magnetic resonance (CP/MAS NMR) spectra were acquired with a JEOL ECA-600 spectrometer (14.1 T) equipped with an additional 1 kW power amplifier. The 13C NMR shift was referenced to adamantane as an external standard. The samples were spun at 15 kHz using a 4 mm ZrO2 rotor under ambient conditions. The textural characteristics of the specimens were assessed by N2 physisorption at 77 K using a BELSORP-mini II apparatus. Prior to each measurement, the sample was degassed at room temperature overnight under vacuum and then purged with He. Field-emission scanning electron microscopy (FE-SEM) images were obtained using a Hitachi SU9000 instrument. Energy-dispersive X-ray spectroscopy (EDS) analyses were performed with a Super-X EDS detector system (Thermo Fisher Scientific) to investigate the bulk atomic compositions of K, La, Ta and N. Thermogravimetry (TG) data were obtained using a DTG-60 apparatus (Shimadzu) under a flow of air (50 mL min−1). Al2O3 was used as a reference and the rate of heating was 5 K min−1. Atomic force microscopy (AFM) images were acquired with a Nanocute instrument (Hitachi High-Tech) operating in the dynamic mode. Diffuse-reflectance ultraviolet-visible-near-infrared spectroscopy (DRS) data were obtained using a JASCO V-770 spectrophotometer over the 300–700 nm wavelength range. X-ray photoelectron spectroscopy (XPS) was conducted using an ESCA 3400 apparatus (Shimadzu) with Mg Kα radiation and the obtained binding energies were corrected by reference to the C 1s peak (285.0 eV). Scanning transmission electron microscopy (STEM) observations were performed in a similar manner to those in previous work35 but with some modifications. The inner and outer detection semiangles of the annular dark field (ADF) detector were 45.8 and 200 mrad, respectively, with an incident probe current of 2–5 pA.Photocatalytic reactions
Photocatalytic reactions were performed using a closed gas circulation system equipped with a top irradiation type reaction cell.36 In each trial, a 50 mg quantity of the photocatalyst was dispersed in an aqueous methanol solution (10 vol%, 140 mL) and this suspension was mixed using a magnetic stirring bar throughout the reaction. A 300 W xenon lamp fitted with a cutoff filter (L42) was used as the light source (λ > 400 nm). The amount of H2 generated was determined by a gas chromatograph using Ar as the carrier gas and equipped with a thermal conductivity detector and an MS-5A column. This instrument was directly connected to the closed gas circulation system. The catalyst specimens were loaded with a Pt cocatalyst using an in situ photodeposition method employing H2PtCl6·6H2O (Wako Pure Chemicals) as a precursor.37 The Pt loading was 1 wt% unless otherwise stated.The apparent quantum yield (AQY) values for the H2 evolution reaction over the various specimens were obtained using a similar setup but with monochromatic visible light (λ = 420 nm). The AQY was calculated as
| AQY (%) = (2 × R/I) × 100 |
Results and discussion
Physicochemical characterization
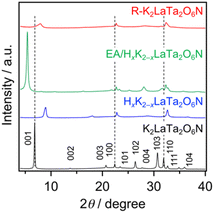
Fig. 1 shows the XRD patterns obtained from the original K2LaTa2O6N and from the various derivatives. The peak assigned to reflections from 001 planes, which were in the stacking direction of the perovskite layers, was shifted to higher 2θ angles following H+/K+ exchange due to the loss of water from the interlayer spaces, as has been previously reported.23 Treatment of the resulting HxK2−xLaTa2O6N with EA produced a significant low-angle shift of the 001 peak. The interlayer spacing for each sample was calculated from the 001 peak position and this spacing was found to have increased from 12.94 Å in the case of the starting K2LaTa2O6N to 16.31 Å for the EA/HxK2−xLaTa2O6N. Importantly, neither the proton exchange nor the EA treatment significantly affected the positions of peaks related to in-plane reflections (such as the 100 and 110 peaks), as compared with HxK2−xLaTa2O6N. These results indicate that the interlayer spaces in the HxK2−xLaTa2O6N were successfully modified while maintaining the original lamellar structure, which is typical of topochemical reactions. The intercalation of EA was also supported by EDS results. The data in Table 1 demonstrate that the K/Ta and La/Ta ratios were almost unchanged following the reaction of HxK2−xLaTa2O6N with EA. CP/MAS NMR spectroscopy confirmed that ammonium cations were intercalated into the HxK2−xLaTa2O6N, as shown in Fig. S1.†| Sample | Specific surface area/m2 g−1 | Bulk atomic ratioa | Surface N/Ta ratiob | |
|---|---|---|---|---|
| K/Ta | La/Ta | |||
| a Measured by EDS. b Calculated based on the corresponding XPS peak areas. The N 1s XPS peak used for the calculation is attributed to lattice N species. | ||||
| K2LaTa2O6N | 5.0 | 1.01 ± 0.04 | 0.60 ± 0.04 | 0.37 |
| HxK2−xLaTa2O6N | 7.4 | 0.08 ± 0.01 | 0.52 ± 0.02 | 0.19 |
| EA/HxK2−xLaTa2O6N | 16.0 | 0.10 ± 0.00 | 0.50 ± 0.01 | 0.10 |
| R–K2LaTa2O6N | 18.4 | 0.45 ± 0.00 | 0.51 ± 0.01 | 0.10 |
| Ideal K2LaTa2O6N | — | 1 | 0.5 | — |
SEM images of the K2LaTa2O6N with and without EA intercalation are provided in Fig. 2. Plate-shaped particles reflecting the layered structure of the material can be seen in both specimens, again confirming the successful topochemical reaction. However, the specific surface area, as determined by nitrogen-adsorption at 77 K, was increased from 5.0 m2 g−1 in the case of the original K2LaTa2O6N to 16.0 m2 g−1 for the EA/HxK2−xLaTa2O6N. The TG data indicated that EA was incorporated in the sample to a level of 8.6 wt% (Fig. S2†).
Exfoliation of the lamellar K2LaTa2O6N to form single-layer sheets was also found to be possible. As shown in Fig. 3a, the reaction of EA/HxK2−xLaTa2O6N with TBAOH resulted in a yellowish colloidal suspension and this suspension was found to be stable for at least 1 month. Fig. 3b presents a typical AFM image of the colloidal suspension, in which sheet-like objects having lateral dimensions in the range of 0.1–0.5 μm appear. The height profile obtained from this sample indicates that the thickness of the sheets was approximately 1.3 nm and so was very similar to that of the two-layer perovskite blocks in K2LaTa2O6N as determined from crystallographic data.23 In addition, the lateral dimensions of the sheets were consistent with those observed in K2LaTa2O6N by SEM (Fig. 2). These results confirm that TBA+-exfoliated LaTa2O6N2− sheets were successfully prepared, although the material may have contained some residual EA.
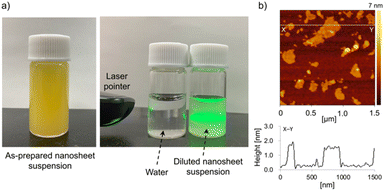 | ||
| Fig. 3 (a) Digital photographs of the TBA+-exfoliated LaTa2O6N2− nanosheet colloidal suspension and (b) a typical AFM image and the height profile of a nanosheet. | ||
The addition of KCl to the TBA+-exfoliated LaTa2O6N2− nanosheet colloidal suspension led to an immediate flocculation of the colloids. The XRD pattern of the flocculated solid (that is, the R–K2LaTa2O6N) exhibited weak 00l peaks although the intensity of the in-plane reflection peak remained relatively close to that of the parent K2LaTa2O6N (Fig. 1). These data indicate that the flocculated solid did not retain the long-range order of the layered structure present in the parent material but did keep the original in-plane crystallinity. The same behaviour has been observed in studies with other inorganic layered solids subjected to exfoliation and restacking.4,28 The peak position of the 001 plane in R–K2LaTa2O6N was higher than that of the original K2LaTa2O6N, indicating a narrower interlayer. This could be due to the insufficient intercalation of K, which is supported by the EDS results (Table 1). SEM observations also confirmed the formation of a disordered structure in the restacked material (Fig. 2). The specific surface area of the R–K2LaTa2O6N was determined to be 18.4 m2 g−1.
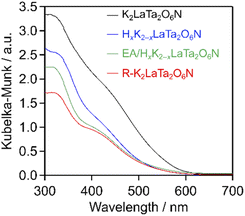
As shown in Fig. 4, EA intercalation did not significantly alter the position of the absorption edge of the host K2LaTa2O6N, which was located at 580 nm. However, the intensity of the Kubelka–Munk function was decreased following EA intercalation. This result suggests some loss of nitrogen from the K2LaTa2O6N, although a quantitative evaluation of the nitrogen content was difficult because the specimen incorporated EA, which also contained nitrogen. The visible light absorption capability was further reduced in the case of the R–K2LaTa2O6N. Our group previously demonstrated that layered K2LaTa2O6N shows high (photo)chemical stability in aqueous media. Specifically, the proton-exchange reaction of K2LaTa2O6N in aqueous HCl was found to produce a slight initial reduction in the nitrogen content of the material but no ongoing loss of nitrogen.23 However, the K2LaTa2O6N could have been damaged by the present multi-step treatment involving proton-exchange, EA intercalation, exfoliation with TBAOH and KCl restacking, resulting in a loss of nitrogen content that lowered the visible light absorption of the material. This possibility is supported by the observation that the bulk N/Ta atomic ratio in the R–K2LaTa2O6N (N/Ta = 0.38 ± 0.02) was lower than that in the layered K2LaTa2O6N (N/Ta = 0.50 ± 0.05).
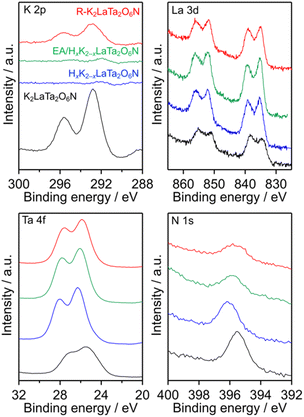
The surface electronic states of the K2LaTa2O6N and its derivatives were investigated by XPS. As shown in Fig. 5, the K and La peak positions were not changed significantly after proton-exchange, EA intercalation or subsequent restacking, although the K signal was significantly reduced in the case of the HxK2−xLaTa2O6N and the EA/HxK2−xLaTa2O6N. In contrast, some changes were evident in the Ta 4f and N 1s spectra. The Ta 4f XPS spectrum of the K2LaTa2O6N contained broad peaks, indicating that Ta species having different oxidation numbers were present in this material (see Fig. S3† for details), as discussed in a previous paper by our group.26 Following proton-exchange, the Ta 4f peak became sharper and showed features typical of Ta5+. A loss of the lattice nitrogen content from the surface was also observed after the proton-exchange (Table 1). It is therefore considered that the nitrogen species bound to the tantalum was removed by the proton-exchange, thereby placing the tantalum in a more oxide-like (more ionic) environment. The intercalation of EA into the HxK2−xLaTa2O6N resulted in a shift of the Ta 4f peak to a lower binding energy while maintaining the Ta5+ features. These effects can be ascribed to electronic interactions between the intercalated EA and Ta species in the interlayers. The R–K2LaTa2O6N kept the lower binding energy of the Ta 4f peak even though the majority of the intercalated EA molecules had been removed, as shown in Fig. 1. This result implies that some residual EA molecules remained in the interlayer spaces. Further evidence for this was supplied by the asymmetric peak associated with the 001 reflection of the R–K2LaTa2O6N (Fig. 1). The position of the N 1s peak was also changed, and the change in the binding energy can be explained in the same manner as for the Ta 4f by considering the electron density around Ta atom. It should be noted that the surface N/Ta atomic ratio obtained from the XPS data (N/Ta = 0.10, see Table 1) was much lower than the bulk ratio (N/Ta = 2.83 ± 0.25), again suggesting that EA molecules were intercalated in the bulk HxK2−xLaTa2O6N (see also Fig. S4 and additional discussion in ESI†).
Photocatalytic activities
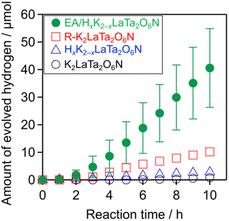
Trials monitoring H2 evolution from aqueous methanol solutions were performed using the as-prepared materials under visible light (λ > 400 nm), and the results are shown in Fig. 6. The layered K2LaTa2O6N and its protonated form both produced H2 in a stable manner. In addition, the catalytic activity was improved by a factor of approximately 15 following EA intercalation compared with the protonated specimen. The R–K2LaTa2O6N also showed enhanced activity (1.3 μmol h−1) as compared with the HxK2−xLaTa2O6N (0.3 μmol h−1) but did not outperform the EA/HxK2−xLaTa2O6N (5.4 ± 1.4 μmol h−1). No H2 was produced in the absence of a photocatalyst sample. Overall, these data demonstrate that suitable interlayer modification of the layered K2LaTa2O6N could improve photocatalytic activity. The EA/HxK2−xLaTa2O6N also showed negligible activity in the absence of methanol (<1 μmol h−1), indicating that methanol was exclusively used as the electron donor to facilitate H2 evolution, rather than the intercalated EA.The H2 evolution activity of the EA/HxK2−xLaTa2O6N was found to depend on the Pt loading. As shown in Fig. S5,† the H2 evolution rate was increased with increases in the Pt concentration up to 3 wt%, beyond which the rate decreased. An initial induction period was observed in all cases and was associated with the consumption of photogenerated electrons via reduction of the Pt precursor rather than by water reduction.38 The total amount of H2 produced from the 3 wt% Pt/EA/HxK2−xLaTa2O6N was approximately 180 μmol, which exceeded the photocatalyst amount (ca. 91 μmol), indicating the catalytic production of H2. The AQY of the 3 wt% Pt/EA/HxK2−xLaTa2O6N was 2.0% at 420 nm. Although there is a room for improvement of the photocatalytic activity (e.g., by optimizing metal cocatalysts39 and operating conditions40), this value is comparable to (or slightly higher than) the AQY of Pt/ZrO2/TaON (1.7%), one of the most active oxynitride photocatalysts for H2 evolution.41 Without Pt deposition, the amount of H2 evolved was very small (approximately 0.6 μmol over a 10 h reaction), demonstrating that the deposited Pt provided H2 evolution sites. This enabled to calculate a turnover number for H2 evolution with respect to Pt to be 23. It should also be noted that increasing the Pt loading from 1 to 3 wt% in trials with the R–K2LaTa2O6N did not increase the H2 evolution rate (Fig. S6†).
Factors affecting photocatalytic activity
The data presented above suggest that the photocatalytic activity of each K2LaTa2O6N derivative during H2 evolution was strongly dependent on the structure of the material and that the EA-intercalated specimen was the best-performing photocatalyst. Increasing the surface area of a semiconductor photocatalyst may contribute to higher photocatalytic activity because a greater surface area can provide more reaction sites.42 As noted, the specific surface area of the EA/HxK2−xLaTa2O6N was approximately 3 times that of the K2LaTa2O6N, which qualitatively explains the higher photocatalytic activity of the former. However, the EA/HxK2−xLaTa2O6N and R–K2LaTa2O6N had similar specific surface areas but different activities. In our previous work, lower-valence Ta species (specifically Ta3+) that were associated with the formation of anionic defects were found to lower the photocatalytic H2 evolution activity of HxK2−xLaTa2O6N by shortening the lifetimes of photogenerated free electrons.26 As shown in Fig. 5, the valence state of the Ta in the EA/HxK2−xLaTa2O6N, which was the most active material, was similar to those in the HxK2−xLaTa2O6N and R–K2LaTa2O6N. All three specimens exhibited features related almost entirely to Ta5+. Therefore, the relatively high specific surface area and preferable Ta valence state of the EA/HxK2−xLaTa2O6N do not explain the higher photocatalytic activity of this sample.The XRD pattern obtained from the EA/HxK2−xLaTa2O6N following the reaction showed that the 001 peak position was moved to a higher angle (Fig. 7). This result indicates that the interlayer nanospaces of the HxK2−xLaTa2O6N, which had been expanded by EA intercalation, were narrowed. This effect was likely due to the removal of the intercalated EA during the reaction. Further evidence for the loss of EA was obtained from the results of 13C CP/MAS NMR and TG analyses (Fig. S1 and S2†). Nevertheless, the peak position was still at a lower angle compared with those in the HxK2−xLaTa2O6N and R–K2LaTa2O6N patterns, suggesting that the interlayer spacing in the reacted EA/HxK2−xLaTa2O6N remained wider than in the latter two materials (also see Fig. S7 and additional discussion in ESI†). Importantly, no significant changes were identified in the UV-visible DRS data acquired from the sample following the reaction. From this lack of change, it is evident that the capacity of the HxK2−xLaTa2O6N for visible light absorption was unaffected (Fig. S7b†).
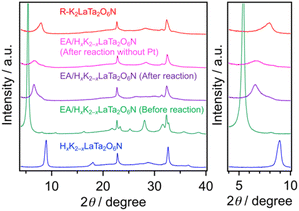 | ||
| Fig. 7 XRD patterns obtained from the EA/HxK2−xLaTa2O6N before and after the photocatalytic reaction. Data for various reference samples are also shown for comparison. | ||
One possible explanation for the different activities of the present specimens is that the most active material (the EA/HxK2−xLaTa2O6N) had expanded interlayer spacing (Fig. 7). This expansion may have promoted redox reactions, as has been reported based on prior work with layered metal oxide photocatalysts.12,13,27–29 In contrast, no XRD peak shifts were observed when the same experiment was conducted using the R–K2LaTa2O6N (Fig. S8†). That is, Pt could not be deposited in the interlayer spaces of the R–K2LaTa2O6N.
Fig. 8 presents high-resolution SEM images confirming that the post-reaction R–K2LaTa2O6N contained a number of Pt deposits having sizes of 2.1 nm on its surfaces (Fig. S9†). These Pt deposits were not seen in images of the reacted EA/HxK2−xLaTa2O6N. XPS analyses established that the reacted EA/HxK2−xLaTa2O6N and the R–K2LaTa2O6N both generated Pt signals (Fig. S10†) but the surface Pt/Ta atomic ratio was smaller in the former (Pt/Ta = 0.024) than in the latter (Pt/Ta = 0.046). The Pt 4f peaks for the EA/HxK2−xLaTa2O6N sample appeared at higher binding energies than those generated by the R–K2LaTa2O6N. This outcome indicates that the Pt species in the former were more cationic than those in the latter and implies that the former Pt species interacted strongly with the LaTa2O6N2− layers.13 As shown in Fig. S11,† the Pt/R–K2LaTa2O6N catalysed the H2–O2 consumption reaction while the Pt/EA/HxK2−xLaTa2O6N did not.
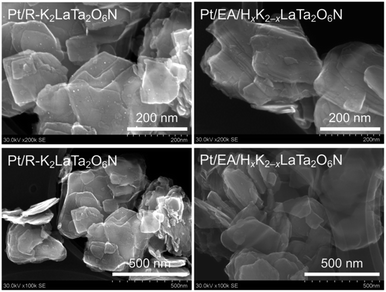 | ||
| Fig. 8 High-resolution SEM images of the reacted R–K2LaTa2O6N and EA/HxK2−xLaTa2O6. Pt deposits can be clearly seen as brighter spots in the Pt/R–K2LaTa2O6N. | ||
From these results, it is apparent that intercalation of Pt species in the interlayers of the EA/HxK2−xLaTa2O6N occurred during the photocatalytic reaction. Additional observations were performed using HAADF/STEM combined with EDS in an attempt to directly observe the intercalated Pt in the material. While clear stripe patterns originating from electron-rich LaTa2O6N2− perovskite layers were obtained (Fig. S12†), it was not possible to identify any Pt species because of beam-related damage to the sample during the observations and an overlap of the Pt and Ta signals. Nevertheless, it appears that no significant aggregation of Pt species occurred in the Pt/EA/HxK2−xLaTa2O6N. These data help to explain the higher activity of the Pt/EA/HxK2−xLaTa2O6N during H2 evolution as compared with the Pt/R–K2LaTa2O6N.
Interestingly, the EA/HxK2−xLaTa2O6N required a higher Pt loading to achieve peak H2 evolution performance compared with the R–K2LaTa2O6N (Fig. S5 and S6†). This was the case even though the two materials had almost the same specific surface areas as determined by nitrogen adsorption experiments. As noted above, a Pt loading of 1 wt% resulted in the majority of the Pt species being introduced into the interlayer nanospaces of the EA/HxK2−xLaTa2O6N (Fig. 8 and S11†). However, increasing the Pt loading to 3 wt% caused Pt nanoparticles to deposit on the external surfaces of the specimen (Fig. S13†) and, at 5 wt% Pt, the Pt formed larger secondary particles. The need for more Pt in the EA/HxK2−xLaTa2O6N photocatalyst relative to the R–K2LaTa2O6N provides further evidence that the interlayer nanospaces could be utilized as sites for Pt intercalation and H2 evolution. This was not possible in the R–K2LaTa2O6N, meaning that the EA/HxK2−xLaTa2O6N exhibited higher photocatalytic activity during H2 evolution.
The sequential photodeposition of Pt onto the EA/HxK2−xLaTa2O6N starting from the interlayers and moving to the external surfaces was thus demonstrated. Evidently, the interlayer nanospaces of the EA/HxK2−xLaTa2O6N had a strong affinity for H2PtCl6. It has been reported that 1,2-C6H10(NH3)22+ will react with [PtCl6]2− to form [PtC6H10(NH2)2Cl4], most likely as a consequence of a Lewis acid–base interaction.43 A similar Lewis acid–base interaction would be expected to occur between CH3CH2NH3+ (i.e., intercalated EA in the EA/HxK2−xLaTa2O6N) and [PtCl6]2−, thereby resulting in the sequential photodeposition of Pt.
Conclusions
An EA-intercalated HxK2−xLaTa2O6N specimen further modified with a Pt cocatalyst was demonstrated to exhibit higher photocatalytic activity for H2 evolution from an aqueous methanol solution under visible light (λ > 400 nm) compared with the parent layered material and restacked K2LaTa2O6N nanosheets. Under the optimal conditions, the H2 evolution activity of the EA/HxK2−xLaTa2O6N was 60 and 18 times higher than those of the HxK2−xLaTa2O6N and R–K2LaTa2O6N, respectively. The expanded interlayer nanospaces in the EA-intercalated material improved loading of the Pt cocatalyst and promoted the photochemical reactions.Recently, dye-sensitized niobate nanosheets and nanoscrolls have been reported to function as good H2 evolution photocatalysts capable of functioning under visible light but the low stability of the dye component needs to be addressed.14,44,45 In contrast to such dye-sensitized oxide systems, oxynitride nanosheets that are already capable of absorbing visible light do not require an additional photosensitizer dye. Thus, the results of this work demonstrate the significant potential of two-dimensional LaTa2O6N2− sheets with regard to the construction of visible-light-driven water splitting systems.
Author contributions
Y. S. performed the majority of the experiments and wrote the manuscript with H. M. and K. M. T. M. and K. K. conducted STEM/EDS analyses. S. Y. and T. Y. conducted NMR and SEM/EDS analyses. S. N. conducted XPS and AQY assessments with Y. S. and analysed the results. S. I. acquired AFM images. K. M. supervised the project. All authors contributed to the final version of the manuscript.Conflicts of interest
There are no conflicts to declare.Acknowledgements
This work was supported by Grants-in-Aid for Scientific Research on the Transformative Research Area (A) “Supra-ceramics” (JP22H05142, JP22H05145 and JP22H05148). Part of the research highlighted in this paper was supported by a JSPS Core-to-Core Program (JPJSCCA20200004) and a JST-CREST program (JPMJCR20R2). The crystal structures shown in this work were drawn using VESTA.46Notes and references
- K. S. Novoselov, A. K. Geim, S. V. Morozov, D. Jiang, Y. Zhang, S. V. Dubonos, I. V. Grigorieva and A. A. Firsov, Science, 2004, 306, 666–669 CrossRef CAS PubMed
.
- J. Zhang, Y. Chen and X. Wang, Energy Environ. Sci., 2015, 8, 3092–3108 RSC
.
- A. H. Khan, S. Ghosh, B. Pradhan, A. Dalui, L. K. Shrestha, S. Acharya and K. Ariga, Bull. Chem. Soc. Jpn., 2017, 90, 627–648 CrossRef
.
- R. Uppuluri, A. Sen Gupta, A. S. Rosas and T. E. Mallouk, Chem. Soc. Rev., 2018, 47, 2401–2430 RSC
.
- K. Maeda and T. E. Mallouk, Bull. Chem. Soc. Jpn., 2019, 92, 38–54 CrossRef CAS
.
- J. L. Gunjakar, I. Y. Kim, J. M. Lee, Y. K. Jo and S.-J. Hwang, J. Phys. Chem. C, 2014, 118, 3847–3863 CrossRef CAS
.
- Y. Ebina, A. Tanaka, J. N. Kondo and K. Domen, Chem. Mater., 1996, 8, 2534–2538 CrossRef CAS
.
- J.-H. Choy, H.-C. Lee, H. Jung, H. Kim and H. Boo, Chem. Mater., 2002, 14, 2486–2491 CrossRef CAS
.
- M. M. J. Treacy, S. B. Rice, A. J. Jacobson and J. T. Lewandowski, Chem. Mater., 1990, 2, 279–286 CrossRef CAS
.
- T. Sasaki, M. Watanabe, H. Hashizume, H. Yamada and H. Nakazawa, J. Am. Chem. Soc., 1996, 118, 8329–8335 CrossRef CAS
.
- R. E. Schaak and T. E. Mallouk, Chem. Mater., 2000, 12, 3427–3434 CrossRef CAS
.
- H. Hata, Y. Kobayashi, V. Bojan, W. J. Youngblood and T. E. Mallouk, Nano Lett., 2008, 8, 794–799 CrossRef CAS PubMed
.
- T. Oshima, D. Lu, O. Ishitani and K. Maeda, Angew. Chem., Int. Ed., 2015, 54, 2698–2702 CrossRef CAS PubMed
.
- T. Oshima, S. Nishioka, Y. Kikuchi, S. Hirai, K. I. Yanagisawa, M. Eguchi, Y. Miseki, T. Yokoi, T. Yui, K. Kimoto, K. Sayama, O. Ishitani, T. E. Mallouk and K. Maeda, J. Am. Chem. Soc., 2020, 142, 8412–8420 CrossRef CAS PubMed
.
- S. W. Keller, S. A. Johnson, E. S. Brigham, E. H. Yonemoto and T. E. Mallouk, J. Am. Chem. Soc., 2002, 117, 12879–12880 CrossRef
.
- K. Sasaki, K. Matsubara, S. Kawamura, K. Saito, M. Yagi, W. Norimatsu, R. Sasai and T. Yui, J. Mater. Chem. C, 2016, 4, 1476–1481 RSC
.
- H. Kageyama, K. Hayashi, K. Maeda, J. P. Attfield, Z. Hiroi, J. M. Rondinelli and K. R. Poeppelmeier, Nat. Commun., 2018, 9, 772 CrossRef PubMed
.
- J. K. Harada, N. Charles, K. R. Poeppelmeier and J. M. Rondinelli, Adv. Mater., 2019, 31, e1805295 CrossRef PubMed
.
- K. Maeda, F. Takeiri, G. Kobayashi, S. Matsuishi, H. Ogino, S. Ida, T. Mori, Y. Uchimoto, S. Tanabe, T. Hasegawa, N. Imanaka and H. Kageyama, Bull. Chem. Soc. Jpn., 2022, 95, 26–37 CrossRef CAS
.
- S. Ida, Y. Okamoto, M. Matsuka, H. Hagiwara and T. Ishihara, J. Am. Chem. Soc., 2012, 134, 15773–15782 CrossRef CAS PubMed
.
- T. Oshima, T. Ichibha, K. S. Qin, K. Muraoka, J. J. M. Vequizo, K. Hibino, R. Kuriki, S. Yamashita, K. Hongo, T. Uchiyama, K. Fujii, D. Lu, R. Maezono, A. Yamakata, H. Kato, K. Kimoto, M. Yashima, Y. Uchimoto, M. Kakihana, O. Ishitani, H. Kageyama and K. Maeda, Angew. Chem., Int. Ed., 2018, 57, 8154–8158 CrossRef CAS PubMed
.
- J. A. Schottenfeld, A. J. Benesi, P. W. Stephens, G. Chen, P. C. Eklund and T. E. Mallouk, J. Solid State Chem., 2005, 178, 2313–2321 CrossRef CAS
.
- T. Oshima, T. Ichibha, K. Oqmhula, K. Hibino, H. Mogi, S. Yamashita, K. Fujii, Y. Miseki, K. Hongo, D. Lu, R. Maezono, K. Sayama, M. Yashima, K. Kimoto, H. Kato, M. Kakihana, H. Kageyama and K. Maeda, Angew. Chem., Int. Ed., 2020, 59, 9736–9743 CrossRef CAS PubMed
.
- Y. Tang, K. Kato, T. Oshima, H. Mogi, A. Miyoshi, K. Fujii, K. I. Yanagisawa, K. Kimoto, A. Yamakata, M. Yashima and K. Maeda, Inorg. Chem., 2020, 59, 11122–11128 CrossRef CAS PubMed
.
- C.-W. Hsu, T. Ideta, K. Awaya, M. Tsushida, T. Sato, K.-i. Yanagisawa, K. Kimoto, K. Hatakeyama, M. Koinuma and S. Ida, Chem. Mater., 2021, 33, 6068–6077 CrossRef CAS
.
- H. Mogi, K. Kato, S. Yasuda, T. Kanazawa, A. Miyoshi, S. Nishioka, T. Oshima, Y. Tang, T. Yokoi, S. Nozawa, A. Yamakata and K. Maeda, Chem. Mater., 2021, 33, 6443–6452 CrossRef CAS
.
- A. Kudo, K. Sayama, A. Tanaka, K. Asakura, K. Domen, K. Maruya and T. Onishi, J. Catal., 1989, 120, 337–352 CrossRef CAS
.
- Y. Ebina, T. Sasaki, M. Harada and M. Watanabe, Chem. Mater., 2002, 14, 4390–4395 CrossRef CAS
.
- Y. Ebina, N. Sakai and T. Sasaki, J. Phys. Chem. B, 2005, 109, 17212–17216 CrossRef CAS PubMed
.
- J. Gopalakrishnan, S. Uma and V. Bhat, Chem. Mater., 1993, 5, 132–136 CrossRef CAS
.
- S. Tahara, T. Ichikawa, G. Kajiwara and Y. Sugahara, Chem. Mater., 2007, 19, 2352–2358 CrossRef CAS
.
- A. S. Cattaneo, C. Ferrara, A. M. Marculescu, F. Giannici, A. Martorana, P. Mustarelli and C. Tealdi, Phys. Chem. Chem. Phys., 2016, 18, 21903–21912 RSC
.
- I. A. Minich, O. I. Silyukov, V. V. Gak, E. V. Borisov and I. A. Zvereva, ACS Omega, 2020, 5, 8158–8168 CrossRef CAS PubMed
.
- S. A. Kurnosenko, V. V. Voytovich, O. I. Silyukov, I. A. Rodionov, S. O. Kirichenko, I. A. Minich, E. N. Malygina, A. D. Khramova and I. A. Zvereva, Catalysts, 2021, 11, 1279 CrossRef CAS
.
- H. Wakayama, K. Hibino, K. Fujii, T. Oshima, K. Yanagisawa, Y. Kobayashi, K. Kimoto, M. Yashima and K. Maeda, Inorg. Chem., 2019, 58, 6161–6166 CrossRef CAS PubMed
.
- K. Maeda, M. Higashi, D. Lu, R. Abe and K. Domen, J. Am. Chem. Soc., 2010, 132, 5858–5868 CrossRef CAS PubMed
.
- B. Kraeutler and A. J. Bard, J. Am. Chem. Soc., 1978, 100, 4317–4318 CrossRef CAS
.
- A. Ishikawa, T. Takata, J. N. Kondo, M. Hara, H. Kobayashi and K. Domen, J. Am. Chem. Soc., 2002, 124, 13547–13553 CrossRef CAS PubMed
.
- M. Hara, J. Nunoshige, T. Takata, J. N. Kondo and K. Domen, Chem. Commun., 2003, 3000–3001 RSC
.
- T. Hisatomi, K. Maeda, K. Takanabe, J. Kubota and K. Domen, J. Phys. Chem. C, 2009, 113, 21458–21466 CrossRef CAS
.
- S. S. K. Ma, K. Maeda and K. Domen, Catal. Sci. Technol., 2012, 2, 818–823 RSC
.
- K. Maeda, J. Photochem. Photobiol., C, 2011, 12, 237–268 CrossRef CAS
.
- R. F. Mulagaleev, D. Y. Leshok, A. K. Starkov, A. N. Matsulev and S. D. Kirik, J. Chem., 2017, 3695141 Search PubMed
.
- S. Nishioka, K. Hojo, L. Xiao, T. Gao, Y. Miseki, S. Yasuda, T. Yokoi, K. Sayama, T. E. Mallouk and K. Maeda, Sci. Adv., 2022, 8, eadc9115 CrossRef CAS PubMed
.
- C. Davis-Wheeler Chin, P. Fontenot, T. Rostamzadeh, L. J. Treadwell, R. H. Schmehl and J. B. Wiley, ACS Appl. Energy Mater., 2022, 5, 14687–14700 CrossRef CAS PubMed
.
- K. Momma and F. Izumi, J. Appl. Crystallogr., 2011, 44, 1272–1276 CrossRef CAS
.
Footnotes |
| † Electronic supplementary information (ESI) available. See DOI: https://doi.org/10.1039/d3ta01387a |
| ‡ Equal contribution. |
| § Present address: Department of Applied Chemistry, Faculty of Engineering, University of Toyama, 3190 Gofuku, Toyama 930-8555, Japan. |
| This journal is © The Royal Society of Chemistry 2023 |

