New insights into aging in LiNiO2 cathodes from high resolution paramagnetic NMR spectroscopy†
H.
Nguyen
ab,
P.
Kurzhals
c,
M.
Bianchini
 cd,
K.
Seidel
 c and
R. J.
Clément
 *ab
*ab
aMaterials Department, University of California, Santa Barbara, CA 93106, USA. E-mail: rclement@ucsb.edu
bMaterials Research Lab, University of California, Santa Barbara, CA 93106, USA
cBASF SE, Ludwigshafen am Rhein, 67056, Germany
dUniversity of Bayreuth, Bavarian Center for Battery Technology (BayBatt), Bayreuth, 95447, Germany
First published on 5th April 2024
Abstract
Bulk degradation processes are examined in the LiNiO2 cathode using high resolution solid-state NMR, combined with magnetometry and X-ray diffraction. Capacity decay is correlated with bulk heterogeneity, whereby multiple structural domains coexist in the charged state, and the Li content and electrochemical activity of these domains is unraveled for the first time.
The densified phase that forms at the surface of Ni-rich NCMs (e.g., LiNi0.8Co0.1Mn0.1O2) during cycling has been proposed to limit the amount of Li that can be extracted from the core of the particles at high states of charge due to lattice mismatch between the surface and bulk layered phases.1 The inability to fully delithiate the bulk phase is referred to as structural fatigue. For “LiNiO2” or Li1−yNi1+yO2 (LNO), the formation of densified surface layers has been correlated with capacity loss and reduced electrochemical activity in the bulk,2–5 which implies the formation of fatigued domains although their exact nature has yet to be determined. In fact, while powder X-ray diffraction (XRD) is widely used to track long-range structural changes in the cathode active material during electrochemical cycling, it is unable to provide information on the overall Li content and on the distribution of Li atoms amongst available crystallographic sites due to lithium's weak scattering factor. In contrast, 7Li solid-state nuclear magnetic resonance (NMR) spectroscopy provides quantitative insights into the evolution of the Li local environments. Our prior NMR work has identified the presence of twin boundaries in as-synthesized LNO, creating strained and kinetically-hindered Li sites that, once delithiated, are difficult to relithiate under normal operating conditions and contribute to the first cycle irreversible capacity.6 Here, we build upon this work and investigate long-term degradation processes in LNO using high resolution paramagnetic NMR, leveraging a custom low field (2.35 T) spectrometer equipped with an ultrafast magic angle spinning probe (MAS). Our results allow us to determine for the first time the structure and Li content of the fatigued domains, as well as the nature of the defects, arising in LNO particles during extended cycling.
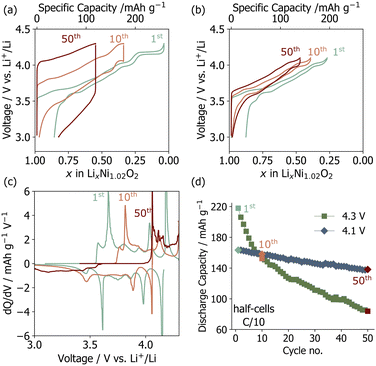
Polycrystalline Li1−yNi1+yO2 was synthesized via co-calcination as outlined in previous studies.6,7 The Ni off-stoichiometry (y) was determined to be 0.01466(6) based on Rietveld refinements of high resolution synchrotron powder X-ray diffraction (sXRD) data reported in our recent work on the same batch.6 LNO composite electrodes were fabricated and tested in half cells (vs. Li metal). The main features in the voltage and differential capacity (dQ/dV) curves shown in Fig. 1a–c are related to sequential phase transitions occurring during electrochemical cycling (i.e., H1 → M → H2 → H3 on charge, where H stands for hexagonal (R![[3 with combining macron]](https://www.rsc.org/images/entities/char_0033_0304.gif) m) and M stands for monoclinic (C2/m)),2,8,9 as detailed in Fig. S1 (ESI†). The discharge capacities averaged over three cells for upper cut-off voltages of 4.1 V and 4.3 V are plotted in Fig. 1d. Cells cycled up to 4.3 V have a high initial discharge capacity of 220 mA h g−1, which rapidly decays to 80 mA h g−1 after 50 cycles. When the H2–H3 transition is prevented by reducing the upper voltage cut-off to 4.1 V, the capacity retention is significantly improved (Fig. 1d), albeit at the cost of a reduced initial discharge capacity. The capacity fade observed here is slightly more severe than in some prior reports,2,10,11 possibly due to the slower (C/10) (dis)charge rate employed in the present work, which increases the extent of the H2–H3 phase transition and time spent at high potentials, or diffusion limitations and a higher impedance at the electrodes as a result of using relatively thick free-standing cathode films (≈11–15 mg cm−2) for ex situ characterization.
m) and M stands for monoclinic (C2/m)),2,8,9 as detailed in Fig. S1 (ESI†). The discharge capacities averaged over three cells for upper cut-off voltages of 4.1 V and 4.3 V are plotted in Fig. 1d. Cells cycled up to 4.3 V have a high initial discharge capacity of 220 mA h g−1, which rapidly decays to 80 mA h g−1 after 50 cycles. When the H2–H3 transition is prevented by reducing the upper voltage cut-off to 4.1 V, the capacity retention is significantly improved (Fig. 1d), albeit at the cost of a reduced initial discharge capacity. The capacity fade observed here is slightly more severe than in some prior reports,2,10,11 possibly due to the slower (C/10) (dis)charge rate employed in the present work, which increases the extent of the H2–H3 phase transition and time spent at high potentials, or diffusion limitations and a higher impedance at the electrodes as a result of using relatively thick free-standing cathode films (≈11–15 mg cm−2) for ex situ characterization.
The loss of capacity is largely due to impedance build-up as revealed by the gradual increase in the hysteresis and Ohmic drop in the voltage profiles from the 1st to the 50th cycle (Fig. 1a). The differential capacity (dQ/dV) curves collected upon long-term cycling of LNO up to 4.3 V evolve significantly (Fig. 1c), which is suggestive of major bulk structural rearrangements over the first 50 cycles, as discussed in more detail in ESI,† Note 1. In contrast, the dQ/dV curves obtained for LNO cycled up to 4.1 V remain mostly unchanged over the first 50 cycles (Fig. S2, ESI†).
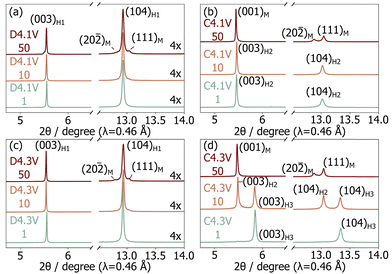
To investigate the structural degradation processes in LNO, ex situ cathode samples were extracted after 1, 10, and 50 cycles in the charged (4.3 V or 4.1 V) and discharged (3.0 V) states. Samples are labelled “C” or “D” when extracted on charge or discharge, respectively; this letter is followed by the upper cut-off voltage and cycle number in our nomenclature system. Le Bail fits of the sXRD patterns collected on the samples of interest (Fig. 2 and Table S1, ESI†) were carried out to identify the presence of H1, M, H2, or H3 crystalline phases. The broad evolution of the Li content in these phases with cycling was inferred from their refined lattice parameters, as discussed in more detail in ESI,† Note 2. Overall, we find that the discharged samples all contain a major H1 phase with a decreasing Li content upon cycling, while a secondary M phase grows with aging, especially for the D4.3V series. Both observations reveal a loss of Li inventory during the first 50 cycles. More substantial differences are observed between the samples stopped at the top of charge. Li extraction becomes less effective with cycling, consistent with previous work,3,10 and a gradual phase evolution from entirely H2 to entirely M is observed for the C4.1V samples, while the C4.3V samples evolve from entirely H3, to H3 and H2, to entirely M.
 | ||
| Fig. 2 Selected regions from the synchrotron XRD patterns collected on ex situ samples in the (a) and (c) discharged and (b) and (d) charged states for cells cycled up to (a) and (b) 4.1 V and (c) and (d) 4.3 V. Crystallographic parameters derived from the refinements are tabulated in Table S1 (ESI†) and full synchrotron XRD patterns are provided in Fig. S3–S6 (ESI†). | ||
While electrochemically-induced transition metal migration is a common degradation mode for layered oxide cathodes,1,12–16 there are few reports on Ni migration in LNO, especially upon extended cycling. One study has suggested 4% Ni migration to the Li layer after the first cycle based on sXRD Rietveld refinements,17 and a recent work reported that 8% of the sites in the Ni layer become vacant upon initial charge above 4.1 V based on sXRD Rietveld refinements.18 Beyond the first cycle, the structural characterization of ex situ LNO samples has been limited to bulk phase identification without refinement of NiLi occupancies,3,19 save for one report claiming that 7% of the Ni species occupy tetrahedral sites in the Li layers after 20 cycles, although no additional evidence from spectroscopic tools was provided.20
Our combined sXRD, magnetometry, and 7Li solid-state NMR results indicate only a small amount of Ni migration during cycling even with a 4.3 V cut-off. The sXRD patterns obtained on ex situ cycled sample were initially refined using the Rietveld method and various structural models, including one where Ni was allowed to occupy tetrahedral sites in the Li layer. The latter model led to a slight reduction in Rwp of 0.5 and large NiTd occupancies (>10%) after the first cycle, which was inconsistent with our SQUID magnetometry and NMR data indicating only a small amount of Ni migration at later stages of cycling (see later) and therefore dismissed. Refinement of the NiLi content in the minor M phase of D4.3V-10, D4.3V-50, and D4.1V-50 again led to large occupancy values (>10%), but those refinements are unreliable due to the extensive overlap of (most of) the reflections from the coexisting H1 and M phases. Refinements were more straightforward for the data collected on the charged samples since these are either single phase or comprised of two phases with no overlapping reflections. This analysis revealed similar NiLi occupancies (Fig. S7, ESI†) in the C4.3V-1 (1.51(7)%), C4.1V-1 (1.60(7)%) and C4.1V-10 (1.53(6)%) samples as compared to the initial cathode (1.46(6)%). The NiLi occupancy was found to slightly increase for the H2 (1.69(8)%) and H3 (1.73(8)%) phases present in C4.3V-10, and for the single M (1.73(6)%) phase in C4.1V-50, and more significantly to 3.17(7)% for the single M phase in C4.3V-50. SQUID magnetometry was then used to further assess Ni migration in the multi-phasic discharged samples that proved challenging to characterize with sXRD. While a paramagnet at room temperature, LNO is ferrimagnetic below a certain magnetic transition temperature that increases with the Ni overstoichiometry (y) and fraction of NiLi defects, as has been shown in previous work.7,21,22 Since the overall Ni content in the cathode does not vary during cycling, the magnetic transition temperatures obtained from the inverse magnetic susceptibility (χ−1) (and derivative dχ−1/dT) vs. temperature data in Fig. S8a and b (ESI†) for the D4.3V and D4.1V samples, respectively, can be used to track the evolution of the NiLi defects formed during cycling. The effective magnetic moments (μeff) and Curie–Weiss constants (θcw) obtained from fits of the magnetic susceptibility data in the paramagnetic (Curie–Weiss) regime are listed in Table S2 (ESI†) and discussed in ESI,† Note 3. As expected, χ−1 varies linearly with temperature in the paramagnetic regime, resulting in a constant (dχ−1/dT) curve at high temperatures for all samples. χ−1 is no longer linear with temperature in the magnetically coupled regime. For the D4.3V-10 and D4.3V-50 samples, a sharp magnetic transition manifests as a peak in the dχ−1/dT profile at 129 K and 152 K, respectively, in contrast to the uncycled cathode, D4.3V-1, and all of the D4.1V samples, which do not exhibit any magnetic transition. Those results indicate a larger amount of NiLi defects in LNO samples cycled over a larger voltage window, and this amount gradually increases with cycle number. Interestingly, the magnetic susceptibility curves obtained on the charged C4.1V and C4.3 V samples (χ−1 and dχ−1/dT plotted in Fig. S8c and d, ESI†) exhibit no clear magnetic transition, which suggests that the magnetic clusters that lead to the magnetic transition in D4.3V-10 and D4.3V-50 are at least partially oxidized on charge and thus are part of the redox-active LNO phase rather than of an inactive magnetic phase.
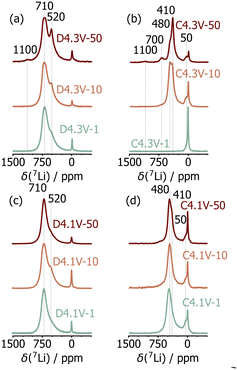
The effects of extended electrochemical cycling on the local structure of LNO was investigated using 7Li solid-state NMR. In LNO, the 7Li chemical shift is dominated by the hyperfine shift resulting from strong interactions between the Li nuclear spin and unpaired electron spins from nearby Ni species, as explained in more detail in our recent work.6 The 7Li spectrum obtained on pristine LNO exhibits three resonances at 700 ppm, 450 ppm, and near 0 ppm, which we have attributed to Li species in the interlayer space, near twin boundary defects, and in diamagnetic phases (e.g., Li2CO3, Li2O) present at the surface of the particles, respectively.6 As noted in our previous study, the 450 ppm resonance disappears after the initial charge process due to sluggish Li reinsertion into the twin boundary environments, while the intensity of the diamagnetic (0 ppm) Li signal varies non-monotonically due to differences in electrolyte degradation and sample washing.6 Spectra acquired on the D4.3V and D4.1V series are shown in Fig. 3a and c and comprise two resonances at ≈700 and 520 ppm, attributed to Li in a pristine LNO environment, and Li near mostly Ni3+ and some Ni4+ species, respectively.6,23 These results indicate incomplete relithiation of the discharged samples, resulting in Li-rich and Li-poor domains. In D4.3V-50, an additional resonance is observed at 1100 ppm, which is assigned to Li in Ni2+-rich environments,6e.g., near multiple NiLi defects. The presence of such Li environments is consistent with the sXRD and SQUID magnetometry results presented earlier.
Significant differences are observed between the 7Li NMR spectra obtained on the C4.3V series (Fig. 3b), while minimal changes are observed for the C4.1V series (Fig. 3d). This is consistent with the improved structural stability of LNO when cycled over a smaller voltage window. Focusing on the 4.3V series, LNO is nearly completely delithiated on initial charge (C4.3V-1), as indicated by the presence of a unique, low intensity signal at 50 ppm. The small hyperfine shift is consistent with residual Li in the interlayer space with mostly Ni4+ neighbours. The spectrum obtained after 10 cycles (C4.3V-10) exhibits two new signals at 410 ppm and 480 ppm, besides the 50 ppm signal (Fig. S10, ESI†). These additional, highly shifted resonances indicate the presence of Li surrounded by both Ni4+ and paramagnetic Ni3+ species in the charged cathode, indicating some loss of electrochemical activity over the first 10 cycles upon cycling LNO up to 4.3 V. While the 410, 480, and 50 ppm signals are still present in the C4.3V-50 spectrum, two additional signals are observed at 700 ppm and 1100 ppm (Fig. S11, ESI†). The 700 ppm signal is attributed to Li species in fully lithiated and therefore electrochemically inactive LNO, presumably resulting from particle cracking and contact loss.24 The 1100 ppm resonance previously attributed to Li near multiple NiLi defects in LNO, is present on both charge and discharge after 50 cycles, which suggests that these Li species are trapped in the interlayer space. Overall, these results suggest the presence of electrochemically active (close to fully delithiated) and fatigued (partially delithiated) particles or sub-particle domains at high states of charge after 10 and 50 cycles. These findings are reminiscent of bulk degradation in NCM811 cathodes, whereby phase separation occurs particle by particle, and the electrochemical activity of each particle is determined by the thickness of its densified surface layer.1
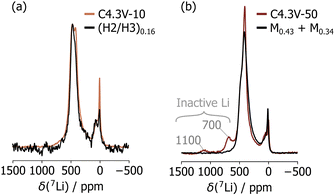
In a final step, the Li content within the structural domains that emerge upon cycling in the C4.3V sample series was determined. C4.3V-1 comprises a single H3 phase, and its Li content was found to be 0.03 based on its initial charge capacity and after correcting for the spurious capacity from high voltage side reactions (determined from the difference in first cycle irreversible capacity obtained when charging up to 4.1 V and 4.3 V). In contrast, the overall Li content in samples collected after multiple charge–discharge cycles cannot be quantified from the observed capacity alone, and we instead compared the 7Li NMR spectra collected on C4.3V-10 and C4.3V-50 with spectra obtained on ex situ samples stopped at different points during the first charge process (Fig. S9, ESI†), as described in ESI,† Note 4. Our sXRD results indicated that C4.3V-10 comprises an H2 and an H3 phase, and its 7Li NMR spectrum matches perfectly that collected on a sample initially charged up to 4.15 V, with a total Li content of 0.16 and similarly comprising an H2 and an H3 phase (labelled (H2/H3)0.16), as shown in Fig. 4a and Fig. S10 (ESI†). These findings indicate that the Li content in C4.3V-10 is 0.16. The 7Li NMR spectrum for C4.3V-50 is more complex, with resonances at 700 and 1100 ppm arising from electrochemically inactive domains, as well as resonances attributed to fatigued domains. The latter set of resonances can be emulated using a linear combination of spectra acquired on two samples stopped during the first charge process, each containing a single M phase with 0.43 and 0.34 Li, respectively, referred to as M0.43 and M0.34 (see Fig. 4b and Fig. S11, ESI†). Hence, C4.3V-50 comprises a minor H1 phase (0.03% molar phase fraction, not detected by sXRD) and two M phases with Li contents of 0.43 (M0.43, 21% molar phase fraction) and 0.34 (M0.34, 79% molar phase fraction). The total Li content in this sample is therefore 0.36.
In summary, this work furthers our understanding of bulk degradation modes in LNO cathodes. In particular, high resolution paramagnetic 7Li NMR enabled the determination of the Li content in the fatigued domains that emerge upon extended cycling up to 4.3 V. We find that up to 0.16 and 0.43 interlayer Li is left in these domains after 10 and 50 cycles, respectively, while fully electrochemically inactive domains are also present at cycle 50. Further work is needed to determine whether these compositional heterogeneities occur particle by particle or at the sub-particle level.
This work was supported by the BASF CARA program and made use of the shared facilities of the UC Santa Barbara MRSEC (DMR-2308708). Synchrotron diffraction data were collected at 11-BM at the Advanced Photon Source, Argonne National Laboratory (DE-AC02-06CH11357). We thank Dr Sabrina Sicolo and Ms Ashlea Patterson for helpful discussions and input.
Conflicts of interest
This research was conducted at UC Santa Barbara in collaboration with BASF, a producer of battery materials.References
- C. Xu, K. Märker, J. Lee, A. Mahadevegowda, P. J. Reeves, S. J. Day, M. F. Groh, S. P. Emge, C. Ducati, B. Layla Mehdi, C. C. Tang and C. P. Grey, Nat. Mater., 2021, 20, 84 CrossRef CAS PubMed
.
- L. de Biasi, A. Schiele, M. Roca-Ayats, G. Garcia, T. Brezesinski, P. Hartmann and J. Janek, ChemSusChem, 2019, 12, 2240 CrossRef CAS PubMed
.
- J. Xu, E. Hu, D. Nordlund, A. Mehta, S. N. Ehrlich, X. Q. Yang and W. Tong, ACS Appl. Mater. Interfaces, 2016, 8, 31677 CrossRef CAS PubMed
.
- X. Li, Q. Wang, H. Guo, N. Artrith and A. Urban, ACS Appl. Energy Mater., 2022, 5, 5730 CrossRef CAS
.
- P. Xiao, T. Shi, W. Huang and G. Ceder, ACS Energy Lett., 2019, 4, 811 CrossRef CAS
.
- H. Nguyen, R. Silverstein, A. Zaveri, W. Cui, P. Kurzhals, S. Sicolo, M. Bianchini, K. Seidel and R. J. Clément, Adv. Funct. Mater., 2023, 2306168 CrossRef
.
- P. Kurzhals, F. Riewald, M. Bianchini, H. Sommer, H. A. Gasteiger and J. Janek, J. Electrochem. Soc., 2021, 168, 110518 CrossRef CAS
.
- H. Li, A. Liu, N. Zhang, Y. Wang, S. Yin, H. Wu and J. R. Dahn, Chem. Mater., 2019, 31, 7574 CrossRef CAS
.
- C. Delmas, M. Ménétrier, L. Croguennec, S. Levasseur, J. P. Pérès, C. Pouillerie, G. Prado, L. Fournès and F. Weill, Int. J. Inorg. Mater., 1999, 1, 11 CrossRef CAS
.
- F. Riewald, P. Kurzhals, M. Bianchini, H. Sommer, J. Janek and H. A. Gasteiger, J. Electrochem. Soc., 2022, 169, 020529 CrossRef CAS
.
- N. Phattharasupakun, M. M. E. Cormier, E. Lyle, E. Zsoldos, A. Liu, C. Geng, Y. Liu, H. Li, M. Sawangphruk and J. R. Dahn, J. Electrochem. Soc., 2021, 168, 090535 CrossRef CAS
.
- W. Li, X. Liu, H. Celio, P. Smith, A. Dolocan, M. Chi and A. Manthiram, Adv. Energy Mater., 2018, 8, 1703154 CrossRef
.
- A. Sharma, A. Rajkamal, S. Kobi, B. S. Kumar, A. K. Paidi, A. Chatterjee and A. Mukhopadhyay, ACS Appl. Mater. Interfaces, 2021, 13, 25836 CrossRef CAS PubMed
.
- N. Y. Kim, T. Yim, J. H. Song, J. S. Yu and Z. Lee, J. Power Sources, 2016, 307, 641 CrossRef CAS
.
- F. Friedrich, B. Strehle, A. T. S. Freiberg, K. Kleiner, S. J. Day, C. Erk, M. Piana and H. A. Gasteiger, J. Electrochem. Soc., 2019, 166, A3760 CrossRef CAS
.
- B. Strehle, F. Friedrich and H. A. Gasteiger, J. Electrochem. Soc., 2021, 168, 050512 CrossRef CAS
.
- K. Y. Park, Y. Zhu, C. G. Torres-Castanedo, H. J. Jung, N. S. Luu, O. Kahvecioglu, Y. Yoo, J. W. T. Seo, J. R. Downing, H. D. Lim, M. J. Bedzyk, C. Wolverton and M. C. Hersam, Adv. Mater., 2022, 34, 1 Search PubMed
.
- M. Juelsholt, J. Chen, M. A. Pérez-osorio, G. J. Rees, S. De Sousa, H. E. Maynard-casely, J. Liu, M. Everett, S. Agrestini, M. Garcia, K. Zhou, R. A. House and P. G. Bruce, Energy Environ. Sci., 2024, 17, 2530 RSC
.
- F. Kong, C. Liang, L. Wang, Y. Zheng, S. Perananthan, R. C. Longo, J. P. Ferraris, M. Kim and K. Cho, Adv. Energy Mater., 2019, 9, 1802586 CrossRef
.
- N. Ikeda, I. Konuma, H. B. Rajendra, T. Aida and N. Yabuuchi, J. Mater. Chem. A, 2021, 9, 15963 RSC
.
- P. T. Barton, Y. D. Premchand, P. A. Chater, R. Seshadri and M. J. Rosseinsky, Chem. – Eur. J., 2013, 19, 14521 CrossRef CAS PubMed
.
- J. B. Goodenough, D. G. Vvickham Aud and W. J. Croft, J. Phys. Chem. Solids, 1958, 5, 107 CrossRef CAS
.
- C. Bae, N. Dupre and B. Kang, ACS Appl. Mater. Interfaces, 2021, 13, 23760 CrossRef CAS PubMed
.
- C. S. Yoon, D. W. Jun, S. T. Myung and Y. K. Sun, ACS Energy Lett., 2017, 2, 1150 CrossRef CAS
.
Footnote |
| † Electronic supplementary information (ESI) available: Experimental details, methodology, and tabulated data. See DOI: https://doi.org/10.1039/d4cc00504j |
| This journal is © The Royal Society of Chemistry 2024 |


![[thin space (1/6-em)]](https://www.rsc.org/images/entities/char_2009.gif) :
: