 Open Access Article
Creative Commons Attribution 3.0 Unported Licence
Characterization of mercury in atmospheric particulate matter in the state of Rio de Janeiro, Brazil
Luis Fhernando Mendonça da Silva a,
Caio Silva Assis Felixbc,
Madson Moreira Nascimentobcd,
Jailson Bittencourt de Andradebcd,
Maria Cristina Canela
 e,
Cibele Maria Stivanin de Almeidae,
Carla Semiramis Silveiraf,
Renato da Silva Carreiraa and
Adriana Gioda
 *a
*a
aDepartamento de Química, Pontifícia Universidade Católica do Rio de Janeiro, Brazil. E-mail: agioda@puc-rio.br
bCentro Interdisciplinar em Energia e Ambiente – CIEnAm, Universidade Federal da Bahia, Salvador, BA, Brazil
cInstituto Nacional de Ciência e Tecnologia em Energia e Ambiente – INCT, Universidade Federal da Bahia, Salvador, BA, Brazil
dCentro Universitário SENAI-CIMATEC, Salvador, BA, Brazil
eUniversidade Estadual do Norte Fluminense Darcy Ribeiro, Laboratório de Ciências Químicas, Brazil
fUniversidade Federal Fluminense – UFF, Niterói, RJ, Brazil
First published on 25th June 2024
Abstract
Despite its low atmospheric concentration, mercury in particulate matter (PHg) significantly impacts its biogeochemical cycle. This research focused on the airborne Hg concentrations in fine particulate matter (PM2.5) collected from three distinct sites: an urban area, an urban area affected by sugarcane burning, and protection reserve area within the state of Rio de Janeiro, Brazil, across various seasons during 2022–2023. The findings revealed average concentration of PM2.5 in Gávea was 19 ± 8 μg m−3 (with values ranging from 8 to 37 μg m−3), in PARNASO, it was 24 ± 11 μg m−3 (with values ranging from 0.2 to 46 μg m−3), and in Campos, it was 10 ± 6 μg m−3 (with values ranging from 1 to 19 μg m−3). Given these values, no day surpassed the threshold outlined by Brazilian regulations. However, 63% of the samples showed daily concentrations exceeding the standards established by the World Health Organization. The average mercury concentrations in PM2.5 were 81 ± 116 (3–366) pg m−3, 169 ± 139 (2–392) pg m−3, and 110 ± 71 (8–272) pg m−3 for the urban region of the capital, interior with sugarcane burning and forest locations, respectively, throughout the study period. The study also found that PHg concentrations were about twice as high during the dry period compared to the summer season, suggesting contributions from both local sources and transboundary pollution. Furthermore, significant seasonal variation in PHg concentrations was observed, with notably higher levels detected in the interior urban area impacted by burns than in the capital and preserved sites.
Environmental significanceThis research paper makes a significant contribution to atmospheric science and the understanding of air quality in South America. It addresses the emerging issue of mercury found in PM2.5 concentrations in three regions of Rio de Janeiro, Brazil: urban areas, areas affected by sugarcane burn, and forested areas. The study reveals that 63% of the samples showed daily concentrations exceeding the standards established by the World Health Organization (WHO) for PM2.5 concentrations. Additionally, it was found that regions affected by sugarcane burning and environmental preservation areas exhibited the highest concentrations of particulate mercury. The study also highlights seasonal variability and the contribution of both local and transboundary pollution. |
1 Introduction
Mercury (Hg) represents a ubiquitous environmental pollutant with profound implications for human health and ecosystems worldwide, owing to its persistence, bioaccumulative nature, and capacity for long-range atmospheric transport. Existing in diverse forms, including elemental mercury (Hg0), reactive mercury gas (RGM), and particle-bound mercury (PHg), the latter poses a significant concern as it can deposit into ecosystems and water bodies, where it transforms into methylmercury — a potent neurotoxin readily assimilated within aquatic food webs.1–4The global distribution of mercury emissions exhibits marked heterogeneity, shaped by regional disparities in industrial practices, energy generation methods, and natural emissions. The origins of mercury are attributed to natural phenomena such as forest fires and volcanic activity.5 While anthropogenic activities such as coal combustion, non-ferrous metal production, and cement manufacturing stand as primary contributors to atmospheric mercury releases, the interplay of natural sources and re-emissions from previously deposited Hg further complicates the global Hg cycle.4,6,7 The intricate transport dynamics of Hg, encompassing atmospheric processes, precipitation regimes, and interactions with terrestrial and aquatic surfaces, further underscore its complex behavior on a global scale.7–9 Researchers have been widely concerned about Hg in recent decades, and the WHO has listed it as one of the ten most important chemicals for public health.10,11
In Brazil, Hg contamination has garnered significant attention, mainly stemming from the nation's extensive historical and ongoing gold mining endeavors, particularly prevalent in the Amazon region, where Hg amalgamation is utilized in gold extraction from sediments, resulting in widespread environmental degradation and health ramifications. In addition to mining activities, Brazil's industrial operations, energy production, and urban pollutants collectively contribute to its Hg emission landscape.6,12,13 Notably, the state of Rio de Janeiro serves as a pertinent case study, representing a pivotal nexus of industrialization and urbanization, emblematic of the challenges associated with managing Hg emissions in rapidly developing urban locales. Detecting particulate mercury (PM) within urban environments underscores broader concerns regarding air quality and public health.
A comprehensive understanding of the dynamics surrounding particle-bound mercury, encompassing its sources, transport mechanisms, and deposition patterns, is imperative for formulating effective mitigation strategies to curb its deleterious effects.9 This study endeavors to augment our comprehension of particulate mercury dynamics, specifically focusing on quantifying concentrations, delineating seasonal variations, and discerning potential emission sources within the global and Brazilian contexts.
2 Methods and experiments
2.1 Study area
The state of Rio de Janeiro, the third most populous in Brazil with over 17 million inhabitants, stands out for the concentration of vehicles in its capital and metropolitan region, contributing to environmental challenges related to air quality. The Metropolitan Region of Rio de Janeiro (MRRJ) is recognized as Brazil's second-largest industrial hub and the third most significant area in South America according to the Brazilian Institute of Geography and Statistics (IBGE).14 The MRRJ boasts a vehicular fleet exceeding 3 million, encompassing buses, trucks, and passenger vehicles powered by gasoline, diesel, ethanol, and natural gas (GNV).14–16 Furthermore, the region hosts a variety of industrial operations, including oil refineries, electric power stations, and facilities specialized in metallurgy and petrochemicals, just as national preservation parks, such as the Serra dos Órgãos National Park (PARNASO).Campos dos Goytacazes, situated in the interior of the state of Rio de Janeiro within the Southeastern region of Brazil, is a prominent city in the Northern Fluminense region. With a population exceeding 500 thousand inhabitants, it ranks as the seventh most populous city in the state's interior.17 Spanning a vast territorial extension of 4,032 km2, Campos dos Goytacazes boasts significant industrial and economic activity, notably as the host of Brazil's largest oil platform, the P-51, located in the Campos basin. Alongside Macaé, it is dubbed the National Petroleum Capital.17,18 Additionally, serving as the primary urban center in the Northern Fluminense region, Campos functions as a residential hub for workers employed in Porto do Açu, the largest port-industry complex in Latin America. In Campos dos Goytacazes, sugarcane dominates agriculture, comprising 55.7% of the planted area and 53.5% of the state's production in 2018. Despite legislation targeting the gradual cessation of sugarcane burning, manual harvesting preceded by burning remains prevalent in the region.18–20
PM2.5 samples were collected from three monitoring sites situated at Gávea (GÁVEA, 22°58′50′′ S and 43°13′58′′ W), Campos dos Goytacazes (CAMPOS, 21°45′39.1′′S 41°17′31.1′′ W), and the Serra dos Órgãos National Park (PARNASO, 22°29′47.5′′ S and 43°00′05.2′′ W) (Fig. 1). A concise overview of these monitoring stations is presented in Table 1.
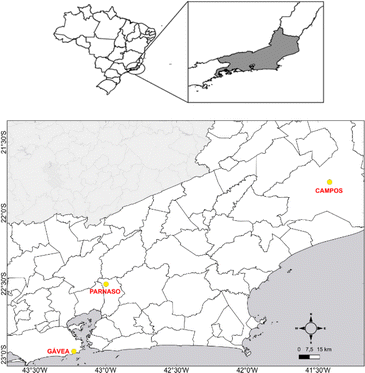 | ||
| Fig. 1 PM2.5 sampling sites: GAVEA: Gávea, PARNASO: Serra dos Órgãos National Park, and CAMPOS: Campos dos Goytacazes. QGIS 3.26.3. | ||
| Location | Surrounding characteristics |
|---|---|
| Gávea | It is located in the Pontifical Catholic University of Rio de Janeiro (PUC-Rio), a few meters from the subway line 4 and 8.5 km from the André Rebouças Tunnel, and near the sea |
| Serra dos Órgãos National Park (PARNASO) | Environmental protection area located in the cities of Teresópolis, Petrópolis, Magé and Guapimirim |
| Campos dos Goytacazes (CAMPOS) | Region where sugarcane is cultivated and subjected to combustion for processing and production of hydrated ethanol and sugar. In addition to the burning, there is also the large Port of Açu, which already has 12 companies installed in its area and another 15 using its infrastructure |
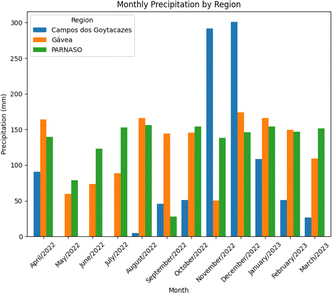
The climate seasonality in state of Rio de Janeiro is characterized by two seasons with different characteristics. The rainy season (October–March) also corresponds to the winter and summer, with higher temperatures and insulation, what leads from one side to a more intense atmospheric washing-out process and from the other to more favorable conditions for secondary aerosol formation. The autumn and winter seasons correspond to a dryer period (April–September) with more soil dust and frequent vegetation fires. The winter is also characterized by frequent thermal inversions.21,22Fig. 2 illustrates the precipitation volume during the study period for each station.
2.2 Measurements of PM2.5 mass concentration
PM2.5 samples were gathered employing quartz microfiber filters (QFF) of 203 × 254 mm (Whatman, Fisher Scientific, Maidstone, United Kingdom) over 24 h, monthly, utilizing monitoring equipment following Brazilian standards (ABNT NBR 13412/1995) and methods outlined by the United States Environmental Protection Agency (US EPA) under method 130 (Method IO-2.1). This process utilized a high-volume air sampler (Hi-Vol 3000, Energética, RJ, Brazil) with an average air flow rate of 1.07 m3 per minute. The QFF was chosen due to its high efficiency, thermal stability, and low background contamination.23 The filters underwent a conditioning process in a desiccator for 24 h and they were subjected to gravimetric analysis before and after the sampling sessions using an analytical balance (Gehaka AG200 ± 0.0001, Marte Científica, Brazil) to ensure accurate measurement of particulate mass. Before sampling, the filter was heated at 450 °C for 24 h. All filters were conditioned at temperatures ranged from 20 °C to 25 °C and relative humidity levels were maintained between 20% and 30%, both before and after sampling. The loaded filter was packed and sealed in plastic bags, and stored in a refrigerator at about 4 °C. This study examined all available PM2.5 samples to assess their particulate mass content.2.3 Measurement of Hg concentration
Total Hg concentrations in PM2.5 were determined using a Direct Mercury Analyzer – DMA-80 (Milestone, Sorisole (BG), Italy). The DMA-80 operates on the thermal decomposition of the sample, mercury amalgamation, and atomic absorption for Hg detection. Initially, samples were weighed and placed into a nickel boat, which was then subjected to thermal decomposition in a stream of air or oxygen. Mercury, along with other combustion by-products, was directed into the catalyst section after decomposition. Here, a continuous oxygen flow transports the decomposition products through a heated catalyst bed, where mercury gases are captured. Mercury species are converted to Hg0, which, along with the reaction gases, is selectively captured to a gold amalgamator, while other gases and decomposition products are expelled from the system. The amalgamator is then heated to release the captured Hg into a single beam, fixed wavelength atomic absorption spectrophotometer for quantification. The amount of Hg released is measured in an optical cell through atomic absorption spectrometry at a wavelength of 253.65 nm.13,24,252.4 Backward trajectories analysis
The National Oceanic and Atmospheric Administration (NOAA) HYSPLIT model was utilized to perform a 7 days backward trajectory analysis aimed at gaining insights into the origins of air masses affecting the study locations. This analysis is crucial for identifying the sources of pollutants, thus enhancing air quality forecasting. Additionally, forward trajectory analysis was employed to assess pollution dispersion patterns. Trajectories were computed at different altitudes (100 m, 500 m, and 1000 m). In the HYSPLIT model, these altitudes corresponded to different layers of the atmosphere: 100 m representing the ground surface layer, 500 m representing the boundary layer, and 1000 m representing the upper boundary layer.262.5 Statistically analysis
Statistical analysis was conducted using PyCharm 2023.2.5 for Windows. The one-way ANOVA test was utilized to assess the variance in particulate mercury (PHg) concentrations across different locations and seasons.3 Results and discussion
3.1 PM2.5 concentrations
The average concentration (during the period 2022 and 2023) of PM2.5 in Gávea (n = 18) was 19 ± 8 μg m−3 (with values ranging from 8 to 37 μg m−3), in PARNASO (n = 14) it was 24 ± 11 μg m−3 (with values ranging from 0.2 to 46 μg m−3), and in Campos (n = 16) it was 10 ± 6 μg m−3 (with values ranging from 1 to 19 μg m−3). Given these values, none of the days sampled exceeded the threshold recommended by Brazilian regulations (60 μg m−3). However, 63% of the samples exhibited daily concentrations surpassing the guidelines set by the WHO (15 μg m−3).PM2.5 concentrations were observed to be relatively elevated during the dry season (April to September) in contrast to the wet season (October to March). This pattern has been documented in numerous prior studies.27–30 Many researchers attribute this phenomenon to the cleansing impact of rainfall, which captures and deposits suspended particles in the atmosphere.
3.2 Particulate mercury (PHg) concentration
The concentrations of PHg in PM2.5 at urban, and preserved sites from 2022 to 2023 are summarized in Table 2. The average PHg concentrations (range) were 81 ± 116 (3–366) pg m−3, 169 ± 139 (2–392) pg m−3 and 110 ± 71 (8–272) pg m−3 at the urban region of the capital, interior with sugarcane burning and forest sites during the sampling period, respectively. The average concentration of PHg in the urban with sugarcane burning (CAMPOS) and forest (PARNASO) sites was approximately two times higher than in the urban site (GAVEA).| Location | Classification | Time | PHg concentration (pg m −3 ) | ||
|---|---|---|---|---|---|
| Range | Mean | S.D. | |||
| Gávea | Urban | Feb/2022–Jun/2023 | 2.7–365.9 | 81.2 | 115.7 |
| Campos dos Goytacazes | Urban with sugarcane burning | 1.6–391.8 | 169.3 | 138.6 | |
| PARNASO | Remote | 7.5–271.7 | 109.8 | 71.4 | |
| Navy base of Aratu – (Bahia) 25 | Urban area near industrial complex | 2010 | 118.0 | 45.5 | |
| Maré Island (Bahia) 25 | 81.6 | 27.0 | |||
| Itaparicá (Bahia) 25 | 20.5 | 5.29 | |||
| Southeast coastal cities of China 4 | Urban | Nov/2010, Jan, Apr, and Aug/2011 | 7.6–956.5 | 141.2 | 128.1 |
| Rural | 5.6–89.4 | 37.0 | 19.2 | ||
| Remote | 3.2–59.9 | 24.0 | 14.6 | ||
| Beijing 33 | Urban | Jan/2014 | 20–820 | 240 | 180 |
| Changchun 33 | Industrial | 60–730 | 240 | 150 | |
| Chengdu 33 | Urban | 240–5020 | 1300 | 1090 | |
| Hong Kong 33 | Urban | 20–140 | 60 | 40 | |
| Detroit (USA) 31 | Urban | 2003 | 1.8–611.2 | 20.8 | 30 |
The results showed that PHg concentrations at urban sites in coastal cities are considerably lower than those in other cities, such as Gávea, a city on the coast of China, and regions in Bahia (Brazil). The surface winds in coastal areas influence the concentrations of PM in these regions.32 PHg concentrations in urban areas were 5.9–11.3 times higher than the nearby values found in Asian countries, and North America (Detroit, USA), indicating that a large amount of anthropogenic Hg has been released into the atmosphere in Brazil.
3.3 Seasonal distribution of Hg in PM2.5 at sites
In this study, PHg was analyzed across three sampling locations to assess seasonal variations. The highest percentages of PHg were found in the autumn, at 37%, followed by 28% in the spring, 24% in the winter and 11% in the summer, respectively (Fig. 3). The difference between the Hg in PM2.5 was found to be much more significant in spring, autumn and winter than in summer, which corroborates other work carried out in China and the USA.31,33 The observed patterns can be explained by the fact that PHg from combustion primarily exists in fine particles, significantly reduced in summer.34,35 Additionally, atmospheric PHg can form through two mechanisms: adsorption of gaseous mercury on particles and gas-particle chemical transformation.36,37 Mercury in coarse particles typically results from the adsorption of gaseous mercury, while mercury in fine particles is formed through both mechanisms. The high temperatures and intense solar radiation in summer can facilitate gas-particle transformation.35,36,38 Therefore, the size distribution of Hg in different seasons may be influenced by both primary mercury emissions and secondary mercury formation processes.39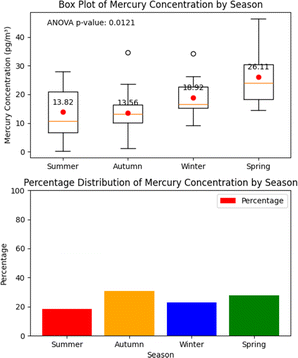 | ||
| Fig. 3 Distribution of the average concentrations and percentages of mercury in at three sites (Gavea, PARNASO, and Campos). | ||
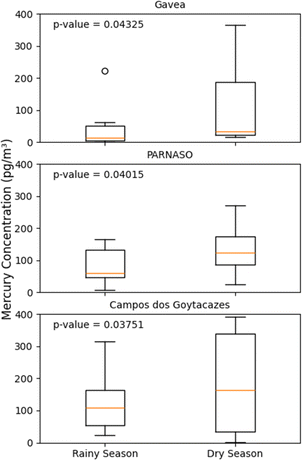
The seasonal concentrations of PHg at individual sampling sites are shown in Fig. 4. There was a statistically significant difference in PHg concentration between the seasons (ANOVA test; p < 0.05). The highest levels of PHg were found in Campos and PARNASO, while the lowest concentrations of PHg were present in Gavea (Fig. 4). The high concentration of PHg at the sites may be associated with anthropogenic emissions. In Campos, the most significant contributions may come from vehicular traffic, the port area and, above all, the burning of sugar cane. PARNASO, despite being an environmental conservation area, usually receives many visitors to the park, with vehicles being the primary commuter. In addition, it is less than 200 m away from BR-116, one of the main avenues linking the metropolitan region of Rio de Janeiro to the Serra and other states in the country, with heavy vehicle traffic.40
PHg concentrations were lowest in rainy at all sampling sites. Precipitation is a pivotal element in atmospheric dynamics, influencing the dispersion of airborne pollutants. It is well-established that rainwater has the capacity to capture atmospheric particles, thereby aiding in their removal from the air.41 However, despite the recognized role of precipitation in mitigating pollutant concentrations, our study did not reveal any significant correlation between precipitation and the levels of mercury and particulate matter.
The atmospheric concentration of PHg in the rainy season may be influenced by air masses coming from the ocean. Most of the mercury was emitted in Hg0 species from the ocean and contributed less to PHg (Fig. 4). On the other hand, clean air masses could dilute the PHg concentration to a large extent. In addition, wet precipitation was more frequent and intense in the summer, eliminating a large amount of PHg in the ambient air.36,42 In Campos, in the summer, the sugar cane crop is growing and there is no burning during this period, which also explains the low concentration of Hg in the area.
It is widely recognized that air masses originating from different regions carry various chemical components within aerosols, thus providing information on their possible sources.43,44
It was found that PHg concentrations in the dry season were evidently higher compared to the rainy season at all the sampling sites. There are several reasons for this. Firstly, the autumn and winter sampling period in this study took place during the beginning (mid-September) and end (mid-March) of the heating season; therefore, the northwest monsoon can transport a large amount of particles with condensed Hg to southeastern coastal cities in spring and autumn, as well as in winter, which can be confirmed by reverse trajectory analysis.
The results of the analysis of the reverse trajectory of the air are shown in Fig. 5. Very different origins were observed for the air masses that arrived at Gávea and PARNASO at different levels and in different seasons. In spring, the air masses at heights of 500 and 1000 m originated from the continental areas of the Andes with volcanoes, Central Brazil, while the trajectory at a height of less than 100 m came from the south of the country. At a height of 1000 m, they passed through other areas of South America, such as Bolivia, Paraguay and the interior of Brazil. The rainy season usually began at the end of November and lasted until mid-March, so the air masses brought a large amount of mercury emitted and ultimately increased the concentrations of PHg in the areas investigated during the dry season. Completely different trajectories were found during the summer. In this season, the trajectories originated from the Atlantic Ocean until they reached the study sites, Gavea and Campos. In contrast to the continental air masses, the oceanic air masses led, to a certain extent, to a decrease in PHg concentrations. Campos during the rainy season and in the dry season does not receive any influence from other countries, being mostly from the ocean in both seasons.
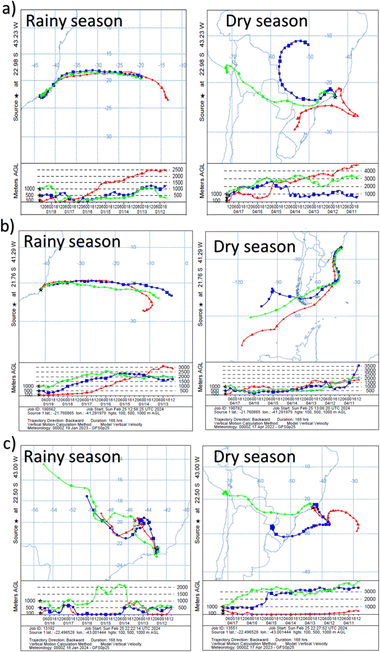 | ||
| Fig. 5 A-week air parcel backward trajectories for different seasons. The end point is at 100, 500, and 1000 m AGL at (A) Gávea, (B) Campos, and (C) PARNASO stations. | ||
4 Conclusions
During the sampling period, it was found that the concentration of PM2.5 varied across the studied locations. In Gávea, PARNASO, and Campos, the average concentrations were within acceptable limits according to Brazilian regulations, with none exceeding the specified threshold. However, a significant portion of the samples from all locations surpassed the daily concentration standards recommended by the WHO, indicating potential health concerns. Regarding Hg concentrations, variations were observed across different environments, with higher levels detected in areas associated with sugarcane burning compared to urban and preserved sites.Mercury levels were found to be highest at urban fire sites, surpassing those in both urban and preserved areas. The summer season recorded the lowest PHg concentrations in comparison to other seasons, with a consistent pattern of significantly elevated PHg levels during the dry season across all examined periods.
Analysis of backward air trajectories revealed that air masses reaching the study area predominantly originated from oceanic sources, leading to a dilution of PHg concentrations in the atmosphere during the summer at Gávea and Campos dos Goytacazes. In contrast, during other seasons, PHg levels were primarily affected by air masses coming from other South American countries and the continental areas of the Andes with volcanoes at PARNASO and Gávea. This explains why PHg concentrations were similar during the dry season but significantly higher than those recorded in the rainy season. Furthermore, Campos during the rainy season and in the dry season does not receive any influence from other countries, being mostly from the ocean in both seasons.
The main limitation of this study is that the sampling in the preservation area (PARNASO) is close to the highway. Ideally, it would have been conducted in a more central part of the park to get natural samples, but this was not possible due to the lack of electricity. In addition, for future studies we intend to do more research on Hg in the regions in particulate and gaseous form, in order to understand the cycle of this pollutant in the Rio de Janeiro region.
Data availability
The data that support the findings of this study are available from the corresponding author, Adriana Gioda, upon reasonable request.Conflicts of interest
There are no conflicts to declare.Note added after first publication
This article replaces the version published on 25/06/24, which contained errors in Table 2 and Fig. 3 .Acknowledgements
This study was financed in part by the Coordenação de Aperfeiçoamento de Pessoal de Nível Superior (CAPES) – Brazil (finance code 001). The authors thanks to CNPq, and FAPERJ for financial support. A. Gioda thanks FAPERJ for the Auxilio Cientista do Nosso Estado and CNPq for the Bolsa de Produtividade.References
- H. K. A. Galappaththi and I. Suraweera, Rev. Environ. Health, 2020, 35, 229–232 CAS.
- M. C. Henriques, S. Loureiro, M. Fardilha and M. T. Herdeiro, Reprod. Toxicol., 2019, 85, 93–103 CrossRef CAS PubMed.
- L. H. Pardo, M. E. Fenn, C. L. Goodale, L. H. Geiser, C. T. Driscoll, E. B. Allen, J. S. Baron, R. Bobbink, W. D. Bowman, C. M. Clark, B. Emmett, F. S. Gilliam, T. L. Greaver, S. J. Hall, E. A. Lilleskov, L. Liu, J. A. Lynch, K. J. Nadelhoffer, S. S. Perakis, M. J. Robin-Abbott, J. L. Stoddard, K. C. Weathers and R. L. Dennis, Ecol. Appl., 2011, 21, 3049–3082 CrossRef.
- L. Sun, X. Zhang, J. Zheng, Y. Zheng, D. Yuan and W. Chen, Atmos. Environ., 2021, 261, 118604 CrossRef CAS.
- K. G. Pavithra, P. SundarRajan, P. S. Kumar and G. Rangasamy, Chemosphere, 2023, 312, 137314 CrossRef CAS PubMed.
- P. B. Tchounwou, C. G. Yedjou, A. K. Patlolla and D. J. Sutton, EXS, 2012, 101, 133 Search PubMed.
- J. E. Sonke, H. Angot, Y. Zhang, A. Poulain, E. Björn and A. Schartup, Ambio, 2023, 525(52), 853–876 CrossRef PubMed.
- M. Roulet, M. Lucotte, R. Canuel, N. Farella, Y. G. De Freitos Goch, J. R. Pacheco Peleja, J. R. D. Guimarães, D. Mergler and M. Amorim, Limnol. Oceanogr, 2001, 46, 1141–1157 CrossRef CAS.
- F. M. Brocza, P. Rafaj, R. Sander, F. Wagner and J. M. Jones, Atmos. Chem. Phys., 2024, 24, 7385–7404 CrossRef.
- WHO, Mercury and health, https://www.who.int/news-room/fact-sheets/detail/mercury-and-health, accessed 21 February 2024 Search PubMed.
- WHO, Ten chemicals of public health concern, https://www.who.int/news-room/photo-story/photo-story-detail/10-chemicals-of-public-health-concern, accessed 21 February 2024 Search PubMed.
- C. S. A. Felix, J. B. Pereira Junior, J. B. da Silva Junior, A. S. Cruz, K. G. F. Dantas and S. L. C. Ferreira, Talanta, 2022, 247, 123557 CrossRef CAS PubMed.
- M. C. R. Sola, R. M. de Jesus, M. M. Nascimento, G. O. da Rocha and J. B. de Andrade, Sci. Total Environ., 2022, 851, 157965 CrossRef CAS PubMed.
- IBGE, Rio de Janeiro (RJ) | Cidades e Estados, https://www.ibge.gov.br/cidades-e-estados/rj/rio-de-janeiro.html, accessed 26 March 2023.
- DETRAN-RJ, Anuário Estatístico 2022, Rio de Janeiro, 2022 Search PubMed.
- L. F. M. Silva, A. R. H. De, L. Cruz, A. H. M. Nunes and A. Gioda, J. Braz. Chem. Soc., 2024, 35, 1–7 Search PubMed.
- IBGE, Campos dos Goytacazes (RJ) | Cidades e Estados, https://www.ibge.gov.br/cidades-e-estados/rj/campos-dos-goytacazes.html, accessed 21 February 2024.
- D. De Almeida Azevedo, C. Y. M. Dos Santos and F. R. De Aquino Neto, Atmos. Environ., 2002, 36, 2383–2395 CrossRef.
- R. S. Ferreira, C. R. O. Nunes, M. O. Souza and M. C. Canela, J. Braz. Chem. Soc., 2021, 32, 618–625 CAS.
- M. A. Lima, M. S. Sthel, M. A. Lima and M. S. Sthel, Engineering, 2020, 12, 851–862 CrossRef CAS.
- M. L. D. P. Godoy, J. M. Godoy, L. A. Roldão, D. S. Soluri and R. A. Donagemma, Atmos. Environ., 2009, 43, 2366–2374 CrossRef CAS.
- K. Beringui, M. F. C. Quijano, E. P. S. Justo, L. M. B. Ventura and A. Giodaa, Quim. Nova, 2021, 44, 737–754 CAS.
- US EPA, EPA IO Compendium Method IO-3.1: Selection, Preparation, and Extraction of Filter Material, https://www.epa.gov/esam/epa-io-inorganic-compendium-method-io-31-selection-preparation-and-extraction-filter-material.
- C. C. Windmöller, N. C. Silva, P. H. Morais Andrade, L. A. Mendes and C. Magalhães Do Valle, Anal. Methods, 2017, 9, 2159–2167 RSC.
- R. M. de Jesus, J. P. dos Anjos, E. A. Torres, G. O. da Rocha and J. B. de Andrade, Energy Fuels, 2020, 34, 16173–16180 CrossRef CAS.
- NOAA - National Oceanic and Atmospheric Administration, HYSPLIT, https://www.ready.noaa.gov/HYSPLIT.php.
- A. H. De La Cruz, L. F. M. da SILVA, F. L. M. SILVa, V. A. Dos Anjos, R. H. M. Godoi and A. Gioda, J. Braz. Chem. Soc., 2024, 35, 1–12 Search PubMed.
- A. Gioda, L. M. B. Ventura, M. B. Ramos and M. P. R. Silva, Water, Air, Soil Pollut., 2016, 227, 1–17 CrossRef CAS.
- V. L. Mateus, I. L. G. Monteiro, R. C. C. Rocha, T. D. Saint'Pierre and A. Gioda, Spectrochim. Acta, Part B, 2013, 86, 131–136 CrossRef CAS.
- E. P. S. Justo, M. Fernanda, C. Quijano, K. Beringui, T. D. Saint’pierre and A. Gioda, J. Braz. Chem. Soc., 2020, 31, 1043–1054 CAS.
- B. Liu, G. J. Keeler, J. T. Dvonch, J. A. Barres, M. M. Lynam, F. J. Marsik and J. T. Morgan, Atmos. Environ., 2007, 41, 1911–1923 CrossRef CAS.
- J. Wang, J. Han, T. Li, T. Wu and C. Fang, Heliyon, 2023, 9, e17609 CrossRef CAS PubMed.
- H. M. Xu, R. Y. Sun, J. J. Cao, R. J. Huang, B. Guinot, Z. X. Shen, M. Jiskra, C. X. Li, B. Y. Du, C. He, S. X. Liu, T. Zhang and J. E. Sonke, Chem. Geol., 2019, 504, 267–275 CrossRef CAS.
- N. Pirrone, G. Glinsorn and G. J. Keeler, Water, Air, Soil Pollut., 1995, 80, 179–188 CrossRef CAS.
- P. Maciejczyk, L. C. Chen and G. Thurston, Atmosfera, 2021, 12, 1086 CAS.
- G. L. Xiu, Q. Jin, D. Zhang, S. Shi, X. Huang, W. Zhang, L. Bao, P. Gao and B. Chen, Atmos. Environ., 2005, 39, 419–427 CrossRef CAS.
- D. Bo, J. Cheng, H. Xie, W. Zhao, Y. Wei and X. Chen, Atmos. Pollut. Res., 2016, 7, 348–354 CrossRef.
- F. W. Zhang, J. P. Zhao, J. S. Chen and Y. Xu, Huanjing Kexue, 2010, 31, 2273–2278 Search PubMed.
- C. T. Driscoll, R. P. Mason, H. M. Chan, D. J. Jacob and N. Pirrone, Environ. Sci. Technol., 2013, 47, 4967 CrossRef CAS PubMed.
- K. Beringui, M. F. Cáceres Quijano, J. P. Resende Ribeiro, T. D. Saint’Pierre, M. F. de Souza Pedreira, L. F. Pires Guimarães Maia and A. Gioda, Environ. Forensics, 2024, 1–13 CrossRef.
- R. Wang, K. Cui, H. L. Sheu, L. C. Wang and X. Liu, Aerosol Air Qual. Res., 2023, 23, 220417 CrossRef CAS.
- L. Xu, J. Chen, Z. Niu, L. Yin and Y. Chen, Atmos. Pollut. Res., 2013, 4, 454–461 CrossRef.
- S. Kong, B. Han, Z. Bai, L. Chen, J. Shi and Z. Xu, Sci. Total Environ., 2010, 408, 4681–4694 CrossRef CAS PubMed.
- Y. Wang, G. Zhuang, X. Zhang, K. Huang, C. Xu, A. Tang, J. Chen and Z. An, Atmos. Environ., 2006, 40, 2935–2952 CrossRef CAS.
| This journal is © The Royal Society of Chemistry 2024 |

