 Open Access Article
Interpolyelectrolyte complexes of a biguanide cationic polyelectrolyte: formation of core/corona nanoparticles with double-hydrophilic diblock polyanion†
Patricia
Montes
a,
Tania
Chopra
 b,
Rafał
Konefał
 b,
Pavla
Hájovská
 c,
Igor
Lacík
 c,
Vladimír
Raus
 b,
Miroslav
Šlouf
 b,
Mariusz
Uchman
 a and
Miroslav
Štěpánek
 *a
*a
aDepartment of Physical and Macromolecular Chemistry, Faculty of Science, Charles University, Hlavova 2030, 128 40, Prague 2, Czech Republic. E-mail: stepanek@natur.cuni.cz
bInstitute of Macromolecular Chemistry, Czech Academy of Sciences, Heyrovského nám. 2, 162 06, Prague 6, Czech Republic
cDepartment for Biomaterials Research, Polymer Institute of the Slovak Academy of Sciences, Dúbravská cesta 9, 845 41, Bratislava, Slovakia
First published on 18th November 2024
Abstract
Biguanide-based cationic polyelectrolytes are used as key components of interpolyelectrolyte complexes bolstering alginate hydrogel microcapsules employed in cell therapies. Nevertheless, electrostatic complexation of these unique polycations has not been studied before. In this study, the interaction between biguanide condensates and anionic polyelectrolytes with carboxylate groups was studied on a model system of a metformin condensate (MFC) and an anionic diblock polyelectrolyte poly(methacrylic acid)-block-poly(ethylene oxide) (PMAA–PEO). The formation of MFC/PMAA–PEO core–corona nanoparticles was followed by static, dynamic and electrophoretic light scattering and by isothermal titration calorimetry and their internal structure was investigated by small angle neutron scattering and cryogenic transmission electron microscopy. It was found that the aggregation of PMAA–PEO chains induced by MFC occurred at much lower MFC/PMAA–PEO ratios that would correspond to the isoelectric point, thus yielding strongly negatively charged nanoparticles, suggesting the role of specific (non-electrostatic) interactions in the stabilization of the complex between PMAA and MFC.
Introduction
Polyelectrolytes (PEs), both synthetic and naturally occurring, have found numerous applications in technology and medicine, e.g. in water treatment,1,2 electrical energy storage,3 or drug or gene delivery.4,5 Many of the applications, for instance flocculation of inorganic particles or DNA/RNA transfection into cells, are based on the ability of PEs to form complexes with oppositely charged multivalent ions, including oppositely charged PEs (so-called interpolyelectrolyte complexes, IPECs),6 oppositely charged micelles of ionic surfactants (so-called polyelectrolyte–surfactant complexes, PESCs),7 and other complexes of PEs with multivalent ions. These complexes are stabilized by the entropic gain caused by the release of small counterions condensed on PE chains into the bulk solution upon the complex formation.8 If the net charge of the complex is sufficiently close to isoelectric conditions,9 IPECs/PESCs either precipitate as a solid phase or form a water-immiscible liquid phase (so-called coacervate). Mixing oppositely charged double-hydrophilic block PEs, that is, block copolymers consisting of a PE block and a neutral hydrophilic block, yields core/corona nanoparticles (NPs) with the IPEC/PESC-formed core and the corona made of the hydrated neutral hydrophilic blocks.7,10 Both bulk IPECs and NPs with IPEC/PESC cores can be used for the solubilization and release of multivalent ions in applications such as protein purification11 or drug delivery.5It is generally assumed that properties of PEs in solution, including their electrostatic complexation, are dictated mostly by Coulombic interactions between charges on the PE backbones and on small ions (counterions, co-ions) in the solution. This means that two PEs differing only in charged groups should have the same properties as long as the charges of the groups and their mutual distances remain the same. In this approach, the solvent is described as a continuous medium with given dielectric permittivity, and all effects associated with the solvation of polymer chains and small ions in the solution are neglected.12 While it is known that the behaviour of IPECs can be affected by the PE chain length,13 by modifications of the PE backbone substitution (e.g., by hydrophobic/hydrophilic side groups),13,14 or, because of specific solvation effects, by the choice of counterions,15 less attention has been paid so far to the effect of non-Coulombic interactions of charged groups of the PE on the IPEC formation.
A few recent studies stressed the difference in the behavior of IPECs formed by a PE with ammonium groups and by a PE with guanidinium (Gnd+) groups.16,17 From the structural point of view, Gnd+ is an intriguing chemical species belonging to the class of planar Y-conjugated quasi-aromatic structures.18 The ion is partly hydrophobic as water molecules can form hydrogen bonds only from the sides of the planar ion. Therefore Gnd+ sticks to hydrophobic surfaces or proteins and forms like-charge contact ion pairs despite the obvious electrostatic repulsion. It was found that Gnd+-based cationic PE exhibited much stronger interaction with PEs than the ammonium-based ones, affording solid IPECs rather than a liquid coacervate phase as in the case of ammonium and showing much higher stability at increased ionic strength of the solution.17 A quasilelastic neutron scattering study19 showed that chain dynamics in IPECs with Gnd+-based cationic PE did not change with ionic strength of the solution so that the interactions between oppositely charged PE chains were less prone to electrostatic screening, indicating major contribution from specific (non-electrostatic) interactions to the stability of the complex.
Recently, the technological significance of guanidine-based PEs has been increasingly recognized, with these materials exploited in a number of different applications including potent antimicrobial polymers,20 high modulus supramolecular hydrogels,21 drug delivery vehicles,22 ultra-stable polyelectrolyte multilayers,23 or wastewater treatment agents.24 One of these applications is in the “next generation” treatment of type 1 diabetes via the transplantation of pancreatic cells.25–27 These cells are immunoprotected by their encapsulation in multicomponent alginate microcapsules that are reinforced by the IPEC formed using the polycationic poly(methylene-co-cyanoguanidine) (PMCG). The PMCG repeat unit is based on a biguanide moiety that can be seen as two condensed Gnd groups sharing one of their nitrogens. While the biguanide motif is formed in situ via a post-polymerization modification reaction during the PMCG synthesis, we proposed that similar biguanide-based polycations should be accessible also through an alternative route exploiting the direct condensation of N-substituted biguanides with formaldehyde. Conveniently, certain substituted biguanides are commercially available, such as 1,1-dimethylbiguanide (commonly known as metformin), which is widely used as a medication for the type 2 diabetes treatment.28
In this study, we synthesized and characterized a novel type of cationic biguanide condensate based on metformin (further referred to as metformin-formaldehyde condensate, MFC, Scheme 1) and investigated its interaction with a double hydrophilic diblock anionic polyelectrolyte poly(methacrylic acid)-b-poly(ethylene oxide) (PMAA–PEO) in basic aqueous solution, ensuring full ionization of the PMAA block. While previous studies focused on guanidine-based cationic PEs containing Gnd+ in polymer side groups,17,19 biguanide condensates represent a structurally different PE with guanidine motifs not only in the side groups but also in the backbone, whose ability to form IPECs has not yet been investigated. Using scattering techniques, ITC and Cryo-TEM, we followed the formation of the IPEC complex of PMAA–PEO and MFC resulting in their co-assembly within NPs composed of the PEO corona and the MFC/PMAA core.
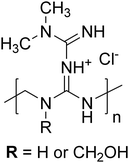 | ||
| Scheme 1 Representative chemical structure of the metformin-formaldehyde condensate (MFC). Note that the charge can be delocalized throughout the biguanide moiety. | ||
Experimental
Materials
Metformin hydrochloride (Biosynth-Carbosynth), paraformaldehyde (95.3%, Sigma-Aldrich), hydrochloric acid (Lach-Ner, Czech Republic), formic acid (∼98%, Lach-Ner, Czech Repulic), lithium bromide (99+%, Thermo Scientific), sodium hydroxide (Lach-Ner, Czech Republic), ethylene glycol (AFT Bratislava, Slovakia) and 3-(cyclohexylamino)-2-hydroxypropane sulfonic acid, CAPSO (Sigma-Aldrich), were used as received. Poly(methacrylic acid)-block-poly(ethylene oxide), PMAA–PEO, was purchased from Polymer Source, Inc. (Dorval, Canada); the number-averaged molar masses of the PMAA block, of the PEO block, and dispersity of the copolymer were 16.2 kg mol−1, 30.0 kg mol−1 and 1.45, respectively.Synthesis of MFC
In a 25 mL round-bottom flask, equipped with a magnetic stirring bar and a reflux condenser, water (4.9 mL) and HCl (1.64 mL, 7.55 M, 0.012 mol) were added to metformin hydrochloride (8.200 g, 0.050 mol) and paraformaldehyde (1.859 g, 0.062 mol, purity taken into account). The flask was placed into an oil bath pre-heated to 80 °C, and the mixture was stirred for 3 h. Afterward, the reaction mixture was cooled to r.t., diluted with 14 mL of H2O, and the product (10.214 g) was isolated by freeze-drying.Preparation of PMAA–PEO/MFC complexes
As MFC precipitated from aqueous solutions in the presence of bivalent anions like phosphate or tetraborate, we used a buffer based on zwitterionic 3-(cyclohexylamino)-2-hydroxypropane sulfonic acid (CAPSO). Both PMAA–PEO and MFC were dissolved in 50 mM aqueous CAPSO solution, the pH of which was adjusted to 8.5 with sodium hydroxide. For SANS measurements, the same buffer was used by water was replaced with deuterium oxide. The samples were prepared by mixing 0.1 mL (light scattering) or 0.2 mL (SANS) of 10 mg mL−1 PMAA–PEO stock solution with various amounts of 10 mg mL−1 stock solution of MFC, covering MFC-to-PMAA–PEO mass ratios, w, from 0.1 to 5. After mixing the components under stirring, the mixtures were diluted with the buffer to the final volume of 1 mL so that the final PMAA–PEO concentrations were 1 mg mL−1 for light scattering and 2 mg mL−1 for SANS and Cryo-TEM, and the mixtures were left standing for at least 24 h prior to the measurements.Isothermal titration calorimetry (ITC)
ITC measurements were performed at 25 °C using a Nano ITC isothermal titration calorimeter (TA Instruments – Waters LLC, New Castle, DE), equipped with 24-karat gold reference and sample cells, both with a volume of 183 μL. The sample cell was connected to a 50 μL syringe, whose needle was equipped with a flattened, twisted paddle at the tip to ensure continuous mixing of the solutions in the cell, rotating at 250 rpm. Titration was carried out by consecutive 1.01 μL injections of an aqueous solution of 10 mg mL−1 MFC in 50 mM CAPSO buffer from the syringe into the sample cell, which was filled with an aqueous solution of 0.5 mg mL−1 PMMA–PEO block copolymer in 50 mM CAPSO buffer. A total of 48 consecutive injections were performed, with a delay of 300 s between consecutive injections. These injections replaced part of the solution in the sample volume, and the changing concentration was considered in the calculation of the sample concentration. By this method, the differential heat of mixing was determined for discrete changes in composition. The data were evaluated using the NanoAnalyze software.Cryogenic transmission electron microscopy (Cryo-TEM)
Cryo-TEM micrographs were obtained with a Tecnai G2 Spirit Twin 12 microscope (FEI, Czech Republic) equipped with a cryo-attachment (Gatan, CA, USA). All micrographs were recorded using bright field imaging at the accelerating voltage of 120 kV. 3 μL of the sample solution were dropped to an electron microscopy grid covered with a lacey carbon supporting film (electron microscopy science), which was hydrophilized just before the experiment by means of glow discharge (Expanded Plasma Cleaner, Harrick Plasma, NY, USA). The excess of the solution was removed by blotting (Whatman no. 1 filter paper) for 1 s, and the grid was plunged into liquid ethane held at 181 °C. The frozen sample was then immediately transferred into the microscope and observed at −173 °C.Nuclear magnetic resonance (NMR)
1D and 2D NMR Spectra were recorded using Bruker Avance NEO 400 spectrometer operating at 400.13 MHz for 1H and 100.62 MHz for 13C nuclei. Typical experimental conditions were as follows: for proton spectra, the width of 1H NMR 90° pulse was 16.5 μs, relaxation delay 10 s, acquisition time 3.28 s, number of scans 32 for metformin and 200 for MFC samples. In case of carbon measurements, the width of 13C NMR 90° pulse was 10 μs, relaxation delay 10![[thin space (1/6-em)]](https://www.rsc.org/images/entities/char_2009.gif) s, acquisition time 1.18 s, number of scans 1000 for metformin and at least 6000 for MFC. 2D 1H–1H COSY NMR spectra were recorded on the same spectrometer using “cosyphpr” pulse program, with 5882 Hz spectral window in f1 and f2. A total of 12 scans were accumulated over 512 t1 increments with a relaxation delay of 3 s. 2D 1H–13C multiplicity edited HSQC NMR spectra were recorded using “hsqcedetgpsp.3” pulse program, with 10
s, acquisition time 1.18 s, number of scans 1000 for metformin and at least 6000 for MFC. 2D 1H–1H COSY NMR spectra were recorded on the same spectrometer using “cosyphpr” pulse program, with 5882 Hz spectral window in f1 and f2. A total of 12 scans were accumulated over 512 t1 increments with a relaxation delay of 3 s. 2D 1H–13C multiplicity edited HSQC NMR spectra were recorded using “hsqcedetgpsp.3” pulse program, with 10![[thin space (1/6-em)]](https://www.rsc.org/images/entities/char_2009.gif) 000 Hz 1H and 25155 Hz 13C spectral windows. A total of 20 (metformin) 40 (MFC) scans were accumulated over 256 t1 increments with a relaxation delay of 3 s. 2D 1H–13C HMBC NMR spectra were measured using “hmbcgpndqf” pulse program, with 8196 Hz 1H and 25155 Hz 13C spectral windows. A total of 22 (metformin) 40 (MFC) scans were accumulated over 256 t1 increments with a relaxation delay of 3 s. All samples were acquired at 298 K using D2O as a solvent.
000 Hz 1H and 25155 Hz 13C spectral windows. A total of 20 (metformin) 40 (MFC) scans were accumulated over 256 t1 increments with a relaxation delay of 3 s. 2D 1H–13C HMBC NMR spectra were measured using “hmbcgpndqf” pulse program, with 8196 Hz 1H and 25155 Hz 13C spectral windows. A total of 22 (metformin) 40 (MFC) scans were accumulated over 256 t1 increments with a relaxation delay of 3 s. All samples were acquired at 298 K using D2O as a solvent.
Size-exclusion chromatography (SEC)
The setup for the SEC analysis of the MFC polycation29 consisted of a degasser, a pump 515, an autosampler 717, a column heater, and a 2414 refractive index detector (Waters, USA). The sample was dissolved at the concentration of 15 mg mL−1 in the aqueous eluent containing 0.3 mol L−1 formic acid and 0.035 mol L−1 LiBr and filtered through a 0.45 μm nylon membrane filter (Millex®-HN, Millipore, Ireland) prior to the injection (100 μL injection volume) on the columns. The separation was achieved by using a PSS Novema MAX column system (Polymer Standards Service, Mainz, Germany) consisting of an 8 × 50 mm guard and three 8 × 300 mm 100 + 1000 + 3000 Å columns with 10 μm particle size, placed in a column heater at 40 °C. The flow rate of 1.0 mL min−1 was controlled by using ethylene glycol as a flow marker. The PSS WinGPC®UniChrom software (Polymer Standards Service, Germany) was employed for data acquisition and evaluation. Narrow-distributed pullulan standards of the molar mass ranging from 342 to 780![[thin space (1/6-em)]](https://www.rsc.org/images/entities/char_2009.gif) 000 g mol−1 were used for conventional calibration; the determined molar mass is thus relative to pullulan standards.
000 g mol−1 were used for conventional calibration; the determined molar mass is thus relative to pullulan standards.
Light scattering
The static (SLS) and dynamic (DLS) light scattering measurements were conducted simultaneously, using an ALV CGS-3 light scattering photometer (ALV, Germany) equipped with a 100 mW diode-pumped solid-state laser with wavelength λ = 660 nm, two high quantum efficiency avalanche photodiode photon counting modules operated in a pseudo-crosscorrelation mode and an ALV 5004 multiple-tau digital correlator. The measurements were conducted in cylindrical glass cells at ambient temperature of 23 °C in the angular range of 50°–150° corresponding (in aqueous solutions) to the q range, 6.6 to 24.5 μm−1, where q is the magnitude of scattering vector, q = (4πn/λ)sin(θ/2), n being solvent refractive index and θ scattering angle. Time-averaged static scattering intensities, I(q) = 〈I(q,t)〉 and intensity autocorrelation functions, g(2)(q,τ) = 〈I(q,t)I(q,t + τ)〉/〈I(q,t)〉2, where τ is the lag time, were acquired simultaneously in 10° angular steps.The g(2)(q,τ) functions were fitted using an inverse Laplace transform by means of a constrained regularization algorithm (CONTIN) and the obtained distribution functions of relaxation times A(τR) were recalculated to the distribution functions of apparent hydrodynamic radii using the relation RHapp = kTτRq2/6πη, where k is the Boltzmann constant, T temperature and η is solvent viscosity. The g(2)(q,τ) functions exhibiting monomodal RHapp distributions were further fitted using the 2nd cumulant expansion, g(2)(q,τ) = 1 + βexp[−2Γ1(q)τ + Γ2(q)τ2], where β is the coherence factor Γ1(q) and Γ2(q) are the 1st and the 2nd cumulant.
Small-angle neutron scattering (SANS)
SANS data were measured on the D22 diffractometer at the Institut Laue-Langevin – The European Neutron Source (ILL), Grenoble, France.The front detector was positioned at 1.4 m from the sample at an angle of 20°, the rear detector was at 17.6 m or 5.6 m, the beam was collimated at 17.6 or 5.6 m with a source aperture of 40 × 55 mm2 and a sample aperture of 7 × 10 (h × v) mm2. A wavelength of λ = 0.6 nm (relative full width at half maximum 10%) was selected, allowing to cover a continuous q-range of 0.025–6.5 nm−1 for 17.6 m and 0.085–6.5 nm−1 for 5.6 m, where q is the magnitude of the scattering vector, q = 4π/λsin(θ/2), θ being the scattering angle. Samples were kept in quartz cuvettes (type 100-QS, Hellma GmbH, Müllheim, Germany) of 2 mm pathway, on a thermalized rack at 20 °C. Data were reduced with the program Grasp V.10.25f30 normalizing with monitor, subtracting the contribution from the empty cell, taking into account noise from the measurement with a sintered 10B4C piece at the sample position, and using for transmission the intensity transmitted by a semi-transparent beam stop. Parallax from the detector and from the sample attenuation were corrected for, and a flat field was used. The absolute scale was obtained from the measurement of the direct beam with a calibrated attenuator (flux of 1.64 MHz for 17.6 m and 13.8 MHz for 5.6 m). After reduction, the scattering from the buffer was subtracted.
Electrophoretic light scattering
Zeta potential measurements were conducted on a Zeta Sizer Nano ZS (Malvern, United Kingdom) using dip cells with palladium electrodes. Zeta potentials ζ were calculated from electrophoretic mobilities μ using Henry equation in the Smoluchowski limit, ζ = μη/ε, where ε is solvent permittivity. The values are averages of 5 measurements, each consisting of 3–10 runs.Results and discussion
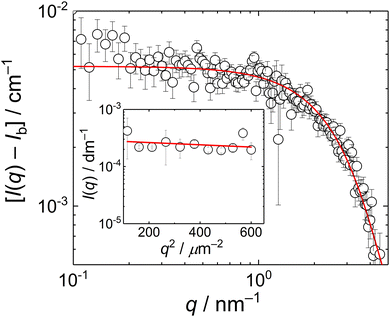
The biguanide-based polycation used in this study was synthesized by the polycondensation reaction between paraformaldehyde and metformin hydrochloride performed in water under acidic conditions. The obtained metformin-formaldehyde condensate, denoted here as MFC, was isolated through freeze-drying. The presumed structure of MFC (disregarding possible branching) is provided in Scheme 1. The product was characterized by size-exclusion chromatography (SEC) and NMR spectroscopy. The SEC analysis using relative calibration against pullulan standards (Fig. S1, ESI†) revealed a multimodal molar mass distribution, with Mn of 5200 g mol−1 (apparent value) and Đ = 2.1. These characteristics, including the presence of a significant low-molar mass fraction, are similar to those of the standard PMCG condensates synthesized previously.27 NMR analysis confirmed the expected structural features and also the presence of a lower-molar mass fraction. For detailed NMR characterization of MFC, including comparative spectra of the starting metformin hydrochloride, see Fig. S2–S10 (ESI†) and the accompanying discussion.The solution behaviour of MFC was studied by SANS (0.1–4 nm−1) and SLS (11–25 μm−1); Both SANS and SLS scattering curves (Fig. 1) were fitted with the Guinier equation, I(q) = I(0)exp(−Rg2q2/3) + Ib, where Ib is the background from the incoherent scattering in SANS; SLS data were fitted with the set value Ib = 0. The fits provided gyration radii, RgSANS = 0.6 nm and RgSLS = 24 nm.
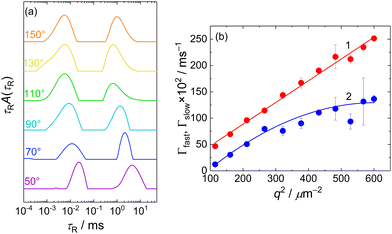
The presence of two types of scatterers differing in the size was confirmed by DLS measurement which exhibited a bimodal distribution of relaxation times, τR (Fig. 2a). The mean relaxation rates of both modes, Γfast = 1/〈τR〉fast and Γslow = 1/〈τR〉slow are shown in Fig. 2b as functions of q2. The fast mode was purely diffusive, Γfast(q) = Dfastq2, with the corresponding apparent diffusion coefficient, Dfast = Γfast(q)/q2 = 4.1 × 10⁻¹⁰ m2 s−1, and the corresponding hydrodynamic radius of RH = kT/6πηDfast = 0.6 nm (k being the Boltzmann constant, T temperature and η solvent viscosity), equal to Rg obtained from the SANS data. This confirmed that the fast mode can be attributed to the diffusion of free MFC chains.
The slow mode (reflected also by the Guinier regime observed in static light scattering) was most likely caused by MFC dynamics slowed by attractive interactions between polyelectrolyte chains. A similar slow mode has frequently been observed in DLS from aqueous solutions of polyelectrolytes and the origin of this behaviour has been extensively debated,31–33 with its presence explained as diffusive motion of metastable domains of concentrated polyelectrolyte solution, stabilized by shared clouds of counterions. In the case of MFC, the behaviour in DLS was more complex as the dependence of Γslow on q2 was not linear, suggesting a contribution of non-diffusive fluctuations to the slow relaxation (most likely internal dynamics in the domains). We would like to note that Cryo-TEM measurement (Fig. S11a, ESI†) was not able to reveal any inhomogeneities in the MFC solution, indicating that MFC concentration in the domains was only slightly higher than its average concentration in the solution, so the formed aggregates were very loose.
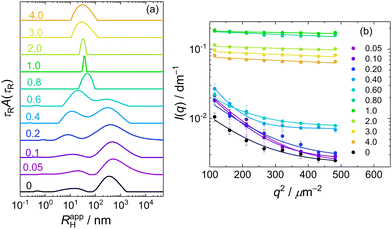
A similar behaviour, that is, a bimodal distribution of relaxation times, was found for DLS of PMAA–PEO aqueous solution (Fig. 3a, curve 0; τR scale is recalculated to apparent hydrodynamic radii RHapp = kTq2τR/6πη). The mean RH for the fast mode, corresponding to the diffusion of free PMAA–PEO chains, was 10 nm.
Mixing PMAA–PEO with MFC led to the IPEC formation, which, when followed by DLS (Fig. 3a), was manifested by the increase in the amplitude and mean RHapp of the fast mode, indicating the aggregation of PMAA–PEO with MFC while the slow mode of PMAA–PEO gradually disappeared. For w > 0.6, the RHapp distribution became monomodal, dominated by the IPEC particles of PMAA–PEO and MFC. The transformation of loose aggregates to small compact NPs was apparent also from the static light scattering data (Fig. 3b) where the loose aggregates manifested themselves by the steeply decreasing scattering intensity with q in the low region up to w = 0.6. For w > 0.6, scattering became nearly isotropic and its intensity increased by an order of magnitude, indicating that the formed NPs were small but had high molar mass.
Gyration radius, Rg, and hydrodynamic radius, RH (Fig. 4) of the NPs formed at MFC-to-PMAA–PEO ratios above 0.6 were evaluated from SLS (from the Zimm equation, I(0)/I(q) = 1 + Rg2q2/3) and DLS (from the diffusion coefficient obtained as linear extrapolation of Γ1(q)/q2 to q = 0). The concomitant increase in Rg and decrease in RH with w could be explained by different contributions to Rg and to RH: The hydrodynamic radius reflected rather the overall radius of the NPs which decreased both with the collapse of PMAA chains and with the decrease in the aggregation number at higher w. On the contrary, dominant contributions to the gyration radius originated from the NP cores, thus growing as the amount of MFC (with higher dn/dc than that of both PMAA and PEO) in the core increased.
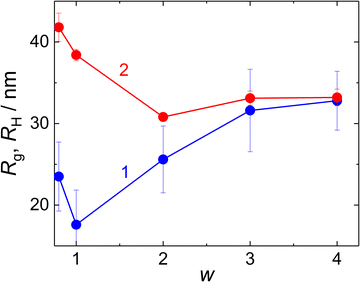 | ||
| Fig. 4 Gyration radius, Rg (curve 1), and hydrodynamic radius, RH (curve 2) of MFC/PMAA–PEO particles, as functions of w. | ||
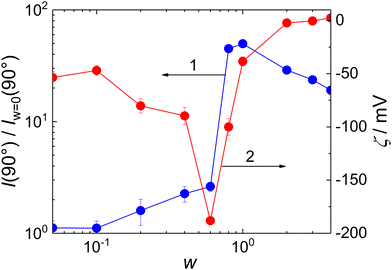
Scattering intensity at θ = 90°, I(90°), is shown as a function of w in Fig. 5, curve 1. It exhibited a maximum at w = 0.8, indicating that the stability of the formed particles reached its maximum at this composition; the further addition of MFC led to a decrease in aggregation number.
It is worth mentioning that the stoichiometric ratio between the MFC and the PMAA monomeric units would correspond to the mass ratio w = 0.75, assuming that 25% of MFC monomeric units bear CH2OH groups (see Scheme 1) as would correspond to the used stoichiometric ratio between metformin and CH2O monomeric units of paraformaldehyde, 1![[thin space (1/6-em)]](https://www.rsc.org/images/entities/char_2009.gif) :
:![[thin space (1/6-em)]](https://www.rsc.org/images/entities/char_2009.gif) 1.25, used for the MFC synthesis. It was thus much lower than the mass ratio corresponding to the isoelectric point of the complex, which was reached at w = ∼2 (Fig. 5, curve 2). Moreover, the zeta potential of MFC/PMAA–PEO was decreasing with the increasing content of MFC up to w = 0.6. Similar, albeit less pronounced behaviour, was observed during DNA condensation by cationic surfactants,34 where the conformational changes of the DNA chain induced by the bound surfactant ions exposed charges which were initially screened, thus making the zeta potential more negative. In the case of the MFC/PMAA–PEO system, the aggregation of PMAA chains with MFC was triggered while the net charge of the complex was still strongly negative, and the increased electrophoretic mobility of MFC/PMAA–PEO particles in comparison with loose aggregates of PMAA–PEO chains caused the increase in the negative zeta potential.
1.25, used for the MFC synthesis. It was thus much lower than the mass ratio corresponding to the isoelectric point of the complex, which was reached at w = ∼2 (Fig. 5, curve 2). Moreover, the zeta potential of MFC/PMAA–PEO was decreasing with the increasing content of MFC up to w = 0.6. Similar, albeit less pronounced behaviour, was observed during DNA condensation by cationic surfactants,34 where the conformational changes of the DNA chain induced by the bound surfactant ions exposed charges which were initially screened, thus making the zeta potential more negative. In the case of the MFC/PMAA–PEO system, the aggregation of PMAA chains with MFC was triggered while the net charge of the complex was still strongly negative, and the increased electrophoretic mobility of MFC/PMAA–PEO particles in comparison with loose aggregates of PMAA–PEO chains caused the increase in the negative zeta potential.
To check whether the compact particles formed by the MFC/PMAA–PEO complex had a core/corona structure with the core formed by the MFC/PMAA complex and the corona of PEO chains, we conducted a SANS measurement for the mass ratio, w = 4. The scattering curve (Fig. 6) fitted well to the Pedersen–Gerstenberg (PG) model of the homogeneous sphere surrounded by Gaussian chains35 with an additional term for incoherent scattering. The fit, performed with scattering lengths of the core block (that is, a complex of a PMAA chain with MFC chains), bsph, and the corona block, bchain, provided the following results: sphere radius, rsph = 18 ± 3 nm, the chain gyration radius, rchain = 9 ± 2 nm, and bsph/bchain = 0.8 ± 0.1. The overall particle radius from SANS was thus, rsph + 2rchain = 36 ± 7 nm which was in accordance with the light scattering data.
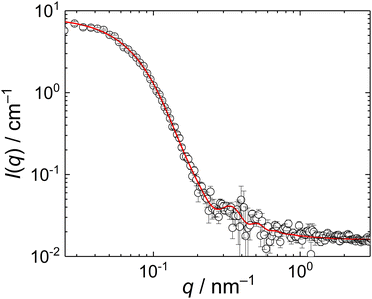 | ||
| Fig. 6 SANS curve of MFC/PMAA–PEO mixture (PMAA–PEO concentration 2 mg mL−1, w = 4). The red line is the fit of the data with the PG model. | ||
MFC/PMAA–PEO NP morphology was further investigated by cryogenic transmission electron microscopy for MFC-to-PMAA mass ratios, w = 1, 2 and 4. Cryo-TEM measurements revealed no substantial differences among NPs with different compositions. Fig. 7 shows the Cryo-TEM image for w = 1 together with the frequency histogram of NP sizes. The images for w = 2 and w = 4 are shown in ESI† (Fig. S11b and c). Assuming that the hydrated coronas did not have sufficient contrast to be imaged and only NP cores were visible, the results for w = 4 could be compared with the SANS analysis which provided the radius of the spherical core from the PG model, rsph = 18 ± 3 nm. The core radius from Cryo-TEM was twice lower, 9 ± 2 nm, which was the difference that could not explained only by the increased weight of larger NPs in the SANS data in contrast to number-averaged value from Cryo-TEM.
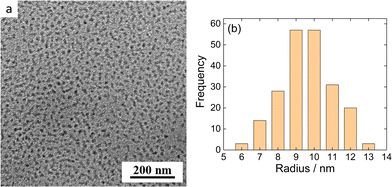 | ||
| Fig. 7 (a) Cryo-TEM micrograph of MFC/PMAA–PEO aqueous solution (w = 4). (b) Frequency histogram of the radii of nanoparticles shown in Fig. 7a. | ||
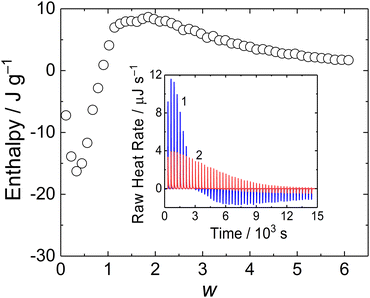
In order to investigate thermodynamics of MFC/PMAA–PEO complex formation, we conducted an ITC experiment. The binding isotherm is shown in Fig. 8. The interpretation of the thermodynamic behaviour was complicated by the enthalpy change associated with the dilution of MFC (Fig. 8 inset, curve 2), which was not negligible as compared with the enthalpy of MFC mixing with PMAA–PEO.
The enthalpy curve showed that the process was exothermic up to w = 1, followed by the endothermic process for w > 1. A similar two-step behavior was reported for coacervation of oppositely charged polyelectrolytes where the exothermic process was associated with pairing of oppositely charged polyions while the following segregation of the complex into coacervate was endothermic.36 In the case of the MFC/PMAA–PEO system, the comparison with light scattering data showed that the exothermic-to-endothermic behaviour transition occurred after the formation of the NPs so that the endotherm corresponded to their rearrangement (swelling) and disruption.
Conclusions
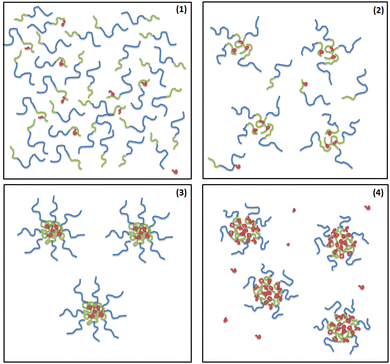
Using scattering techniques, supported with ITC and Cryo-TEM, we examined a system composed of a cationic polyelectrolyte MFC and an anionic diblock polyelectrolyte PMAA–PEO in dilute weakly basic aqueous solution. From the scattering behaviour, we were able to distinguish four regimes according to the value of MFC to PMAA–PEO mass ratio, w (Fig. 9).Zeta potential measurements showed that aggregation of PMAA chains upon the interaction with MFC occurred at low MFC amounts, thus yielding particles with high charge density in the core and hence strongly negative zeta potential. This finding confirms the role of non-electrostatic interactions (such as the formation of guanidinium ion pairs, allowing for cooperative binding of MFC to PMAA chains) in the stability of interpolyelectrolyte complexes involving biguanide polycations.
Author contributions
Miroslav Štěpánek, Vladimír Raus, Igor Lacík: conceptualization, methodology, data curation, validation. Miroslav Štěpánek, visualization, data analysis, writing – original draft, review, and editing. Vladimír Raus, Igor Lacík: writing – review and editing. Patricia Montes, Tania Chopra, Rafał Konefał, Pavla Hájovská, Miroslav Šlouf, Mariusz Uchman: investigation, data acquisition, data analysis. Miroslav Štěpánek, Igor Lacík: funding acquisition.Data availability
The authors confirm that the data supporting the findings of this study are available within the article or have been included in the ESI.†Conflicts of interest
There are no conflicts to declare.Acknowledgements
This work was supported by the Ministry of Education, Youth and Sports of the Czech Republic (Operational Programme Research, Development and Education: “Excellent Research Teams”, Project No. CZ.02.1.01/0.0/0.0/15_003/0000417-CUCAM, by Slovak Research and Development Agency under contract numbers APVV-18-0480 and APVV-22-056, and by Slovak Academy of Sciences (project PD2024:APD0132). We thank Dr Sylvain Prévost at the Institut Laue-Langevin – The European Neutron Source, Grenoble, France, for SANS measurements on D22.References
- G. Petzold and S. Schwarz, in Polyelectrolyte Complexes in the Dispersed and Solid State II: Application Aspects, ed. M. Müller, Springer, Berlin, 2014, pp. 25–65 Search PubMed.
- S. M. R. Shaikh, M. S. Nasser, I. Hussein, A. Benamor, S. A. Onaizi and H. Qiblawey, Sep. Purif. Technol., 2017, 187, 137–161 CrossRef CAS.
- F. N. Ajjan, M. Ambrogi, G. A. Tiruye, D. Cordella, A. M. Fernandes, K. Grygiel, M. Isik, N. Patil, L. Porcarelli, G. Rocasalbas, G. Vendramientto, E. Zeglio, M. Antonietti, C. Detrembleur, O. Inganäs, C. Jérôme, R. Marcilla, D. Mecerreyes, M. Moreno, D. Taton, N. Solin and J. Yuan, Polym. Int., 2017, 66, 1119–1128 CrossRef CAS.
- A. Bertin, in Polyelectrolyte Complexes in the Dispersed and Solid State II: Application Aspects, ed. M. Müller, Springer, Berlin, 2014, pp. 103–195 Search PubMed.
- L. Zhao, M. Skwarczynski and I. Toth, ACS Biomater. Sci. Eng., 2019, 5, 4937–4950 CrossRef CAS PubMed.
- D. V. Pergushov, A. Zezin, A. B. Zezin and A. H. E. Müller, in Polyelectrolyte Complexes in the Dispersed and Solid State I: Principles and Theory, ed M. Müller, Springer, Berlin, 2014, pp. 173–225 Search PubMed.
- M. Gradzielski and I. Hoffmann, Curr. Opin. Colloid Interface Sci., 2018, 35, 124–141 CrossRef CAS.
- J. C. Fu and J. B. Schlenoff, J. Am. Chem. Soc., 2016, 138, 980–990 CrossRef CAS PubMed.
- M. A. Cohen Stuart, N. A. M. Besseling and R. G. Fokkink, Langmuir, 1998, 14, 6846–6849 CrossRef.
- J. R. Magana, C. C. M. Sproncken and I. K. Voets, Polymers, 2020, 12, 1953 CrossRef CAS PubMed.
- L. Zhou, H. Shi, Z. Li and C. He, Macromol. Rapid Commun., 2020, 41, 2000149 CrossRef CAS PubMed.
- A. V. Dobrynin and M. Rubinstein, Prog. Polym. Sci., 2005, 30, 1049–1118 CrossRef CAS.
- Y. L. Liu, C. F. Santa Chalarca, R. N. Carmean, R. A. Olson, J. Madinya, B. S. Sumerlin, C. E. Sing, T. Emrick and S. L. Perry, Macromolecules, 2020, 53, 7851–7864 CrossRef CAS.
- K. Sadman, Q. Wang, Y. Chen, B. Keshavarz, Z. Jiang and K. R. Shull, Macromolecules, 2017, 50, 9417–9426 CrossRef CAS.
- S. M. Lalwani, K. Hellikson, P. Batys and J. L. Lutkenhaus, Macromolecules, 2024, 57, 4695–4705 CrossRef CAS PubMed.
- K. Sadman, Q. Wang and K. R. Shull, ACS Macro Lett., 2019, 8, 117–122 CrossRef CAS PubMed.
- S. Kim, M. Lee, W. B. Lee and S.-H. Choi, Macromolecules, 2021, 54, 7572–7581 CrossRef CAS.
- M. Vazdar, J. Heyda, P. E. Mason, G. Tesei, C. Allolio, M. Lund and P. Jungwirth, Acc. Chem. Res., 2018, 51, 1455–1464 CrossRef CAS PubMed.
- S. Kim, W. B. Lee, N. R. de Souza and S.-H. Choi, Polymer, 2023, 264, 125525 CrossRef CAS.
- K. E. S. Locock, T. D. Michl, J. D. P. Valentin, K. Vasilev, J. D. Hayball, Y. Qu, A. Traven, H. J. Griesser, L. Meagher and M. Haeussler, Biomacromolecules, 2013, 14, 4021–4031 CrossRef CAS PubMed.
- J. N. Hunt, K. E. Feldman, N. A. Lynd, J. Deek, L. M. Campos, J. M. Spruell, B. Hernandez, E. J. Kramer and C. J. Hawker, Adv. Mater., 2011, 23, 2327–2331 CrossRef CAS PubMed.
- M. Hori, H. Cabral, K. Toh, A. Kishimura and A. Kataoka, Biomacromolecules, 2018, 19, 4113–4121 CrossRef CAS PubMed.
- Z. Cao, P. I. Gordiichuk, K. Loos, E. J. R. Sudhölter and L. C. P. de Smet, Soft Matter, 2016, 12, 1496–1505 RSC.
- F. Gao, W. Shi, R. Dai and Z. Wang, ACS ES&T Water, 2022, 2, 237–246 Search PubMed.
- T. Wang, I. Lacík, M. Brissová, A. V. Anilkumar, A. Prokop, D. Hunkeler, R. Green, K. Shahrokhi and A. C. Powers, Nat. Biotechnol., 1997, 15, 358–362 CrossRef CAS PubMed.
- Z. Kronekova, M. Pelach, P. Mazancova, L. Uhelska, D. Trelova, F. Razga, V. Nemethova, S. Szalai, D. Chorvat, D. J. J. McGarrigle, M. Omami, D. Isa, S. Ghani, E. Majkova, J. Oberholzer, V. Raus, P. Siffalovic and I. Lacik, Sci. Rep., 2018, 8, 1637 CrossRef PubMed.
- F. Dorchei, A. Heydari, Z. Kroneková, J. Kronek, M. Pelach, Z. Cseriová, D. Chorvát, F. Zúñiga-Navarrete, P. D. Rios, J. McGarrigle, S. Ghani, D. Isa, I. Joshi, K. Vasuthas, A. M. A. Rokstad, J. Oberholzer, V. Raus and I. Lacík, Biomacromolecules, 2024, 25, 4118–4138 CrossRef CAS PubMed.
- W. C. Knowler, E. Barrett-Connor, S. E. Fowler, R. F. Hamman, J. M. Lachin, E. A. Walker and D. M. Nathan, New Engl. J. Med., 2002, 346, 393–403 CrossRef CAS PubMed.
- A. Urbanová, I. H. Ezenwajiaku, A. N. Nikitin, M. Sedlák, H. M. Vale, R. A. Hutchinson and I. Lacík, Macromolecules, 2021, 54, 3204–3222 CrossRef.
- C. D. Dewhurst, J. Appl. Cryst., 2023, 56, 1595–1609 CrossRef CAS PubMed.
- J. F. Li, T. Ngai and C. Wu, Polym. J., 2010, 40, 609–625 CrossRef.
- M. Sedlák and E. J. Amis, J. Chem. Phys., 1992, 96, 826–834 CrossRef.
- M. Sedlák, J. Chem. Phys., 2002, 116, 5256–5262 CrossRef.
- X. F. Zhao, Y. Z. Shang, H. L. Liu and Y. Hu, J. Colloid Interface Sci., 2007, 314, 478–483 CrossRef CAS PubMed.
- J. S. Pedersen and M. C. Gerstenberg, Macromolecules, 1996, 29, 1363–1365 CrossRef CAS.
- L. Aberkane, J. Jasniewski, C. Gaiani, J. Scher and C. Sanchez, Langmuir, 2010, 26, 12523–12533 CrossRef CAS PubMed.
Footnote |
| † Electronic supplementary information (ESI) available: Molar mass distribution of MFC from size exclusion chromatography, 1H, 13C, 1H–13C HSBC and 1H–13C HSQC NMR spectra of metformin hydrochloride, 1H, 13C, 1H–1H COSY, 1H–13C HSBC and 1H–13C HSQC NMR spectra of MFC, discussion of NMR spectra and Cryo-TEM images of MFC and MFC/PMAA–PEO aqueous solutions. See DOI: https://doi.org/10.1039/d4sm00851k |
| This journal is © The Royal Society of Chemistry 2024 |

