Composite of knitted fabric and soft matrix. I. Crack growth in the course direction†
Fengkai
Liu
a,
Xi
Chen
a,
Zhigang
Suo
 *b and
Jingda
Tang
 *a
*a
aState Key Lab for Strength and Vibration of Mechanical Structures, International Center for Applied Mechanics, Department of Engineering Mechanics, Xi’an Jiaotong University, Xi’an, China. E-mail: tangjd@mail.xjtu.edu.cn
bJohn A. Paulson School of Engineering and Applied Sciences, Kavli Institute for Bionano Science and Technology, Harvard University, Cambridge, MA, USA. E-mail: suo@seas.harvard.edu
First published on 26th November 2024
Abstract
A composite of a knitted fabric and a soft matrix enables applications that require low stiffness and high crack resistance. Examples include heart valves and stretchable strain sensors. Here we study processes of crack growth in such a composite under monotonic and cyclic stretch. We fabricate a composite using a knitted fabric of nylon yarn and an elastomer matrix of polycarbonate urethane. We precut a sample with a crack, monotonically stretch the sample, and observe the growth of the crack. The crack grows in the matrix as the yarn slips and breaks. The stretch is converted to energy release rate G. We identify two critical energy release rates, GA and GB. When G < GA, the yarn does not slip, and the crack does not grow in the matrix. When GA < G < GB, the yarn slips but does not break, and the crack grows in the matrix stably and arrests when the stretch stops increasing. When G = GB, the yarn slips and breaks, while the crack grows unstably. When the sample is subject to cyclic stretch, we observe analogous behavior of crack growth and arrest, as well as yarn slip and yarn break. However, the two critical values, Ga and Gb, are much smaller than the corresponding values under monotonic stretch.
1. Introduction
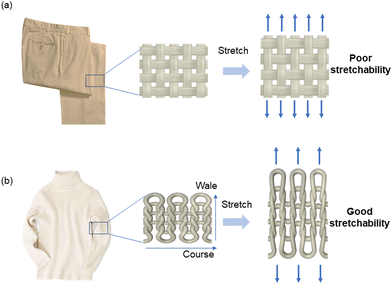
Biological tissues, such as skins and heart valves, consist of collagen fibers embedded in a matrix of proteoglycan and glycosaminoglycans.1–3 The collagen fibers are crimped and form a network, while the matrix is soft. Such a tissue has a J-shaped stress–stretch curve.4 When the stretch is small, the collagen fibers are crimped, and the modulus of the composite is small. When the stretch is large, the collagen fibers become de-crimped, and the stress–stretch stiffens steeply. The tissue also exhibits extraordinary fatigue resistance.5These biological tissues have inspired the development of synthetic composites of fabrics and soft matrices.6–10 Attention here is focused on fabrics in which yarns are made of a much stiffer material than the matrix, such that the yarns are regarded as being inextensible. Consider fabrics of two types: woven and knitted. Yarns in a woven fabric bend negligibly, so that the woven fabric is nearly inextensible in the directions of the yarns (Fig. 1a). The yarn in a knitted fabric bends substantially, so that the knitted fabric is stretchable11,12 (Fig. 1b). This paper studies the composite of knitted fabric and soft matrix. Such a composite has been developed as artificial muscles and strain sensors.13 High tear resistance has been reported for knitted fabrics14 and composites.13
Here we focus on the microscopic processes of crack growth in knitted fabrics and composites. Consider a knitted fabric consisting of a single yarn. A row of loops along the yarn is called a course, and a crack grows in the course direction by yarn slip and yarn break (Fig. 2a). A column of intermeshed loops is called a wale, and a crack grows in the wale direction by yarn ladder and yarn break (Fig. 2b). The crack growth in the course direction is studied in this paper, and the crack growth in the wale direction will be reported in a subsequent paper.
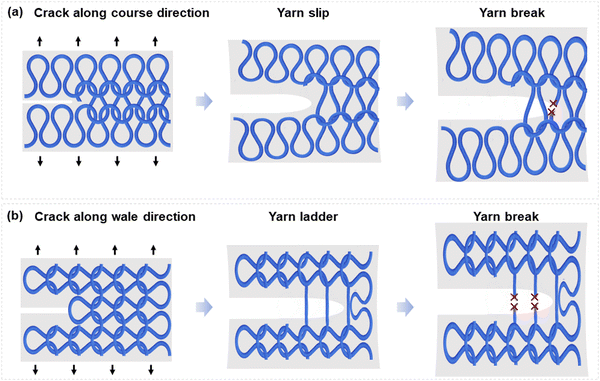 | ||
| Fig. 2 (a) Crack in the course direction results in yarn slip and yarn break. (b) Crack in the wale direction results in yarn ladder and yarn break. | ||
The composite is prepared by embedding a nylon knitted fabric in a matrix of polycarbonate urethane (PCU). We precut a crack in a sample, in the course direction, and stretch the sample monotonically. The stretch is converted to the energy release rate, G. Two critical energy release rates are identified, GA and GB. When G < GA, the yarn does not slip, and the crack in the matrix does not grow. When GA < G < GB, the yarn slips but does not break, while the crack grows and arrests. When G = GB, the yarn slips and breaks, while the crack in the matrix grows unstably. Under cyclic stretch, the crack growth shows similar behaviors to monotonic stretching. However, the two critical energy release rates, Ga and Gb, are much reduced. It is hoped that this study will provide insight for designing novel woven structures15 and fatigue-resistant soft composites for applications including artificial tissues, stretchable sensors.
2. Methods
2.1. Materials
Polycarbonate urethane (PCU) (Carbothane™ AC-4075A, Lubrizol, Wilmington, Massachusetts, Mw = 480 kDa). Tetrahydrofuran (THF) (Aladdin AR, 99.0%). Nylon knitted fabric was purchased from Fanjiati silk stocking company. The course direction has 26.3 unit cells per 1 cm, and the wale direction has 7.5 unit cells per 1 cm. Nylon woven fabric was purchased from Cloth Plus Fabric company. The warp direction has 9 unit cells per 1 cm, and the weft direction has 8.2 unit cells per 1 cm.2.2. Preparation of knit-PCU composite and weave-PCU composite
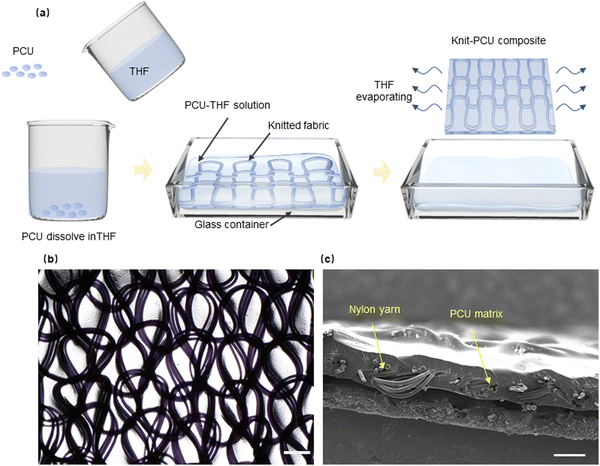
We mixed 20 g of polycarbonate urethane (PCU) particles and 180 g of THF in a bottle, and stirred the mixture in a water bath at 60 °C for 2 hours. Then we cut a nylon knitted fabric or woven fabric into pieces of 90 mm × 140 mm × 80 μm. These pieces were immersed in a glass container with 20 g of PCU-THF solution. The glass container was subsequently placed in a fume cupboard overnight to let THF evaporate and PCU coat the fabric. The resulting sheet of composite had a thickness of 175.5 ± 10.4 μm. The weight ratio between the yarn and the PCU matrix is 44 wt%.2.3. Optical microscopy observation
In this study, optical microscopy (RENYUE-4K) was used to observe crack propagation within the composite. This technique offers real-time visualization of micro-scale phenomena, allowing for detailed tracking of yarn slip and crack growth in the matrix.2.4. Monotonic test
The toughness of the composite was measured using the pure shear test. Both intact and precut samples were cut into a rectangular shape with a width of 50 mm and height of 30 mm. The edges of the specimens were fixed to the acrylic sheet to ensure that the gauge height H was 10 mm. To prepare a precut sample, a sharp blade was used to create a 20 mm long cut at one side of the sample (Fig. S1, ESI†). All mechanical tests were performed using a tensile tester (SHIMADZU AGS-X) with a load cell of 1000 N and a stretching speed of 50 mm min−1. All mechanical tests are conducted at about 25 °C. Every test was repeated for three times for assess repeatability and variations. Photos and videos during the test were captured using a microscope (RENYUE-4K). The modulus was calculated by the initial slope of the stress–stretch curve between the stretch of λ = 1 and λ = 1.2.2.5. Cyclic test
The sample in the cyclic test had the same geometry as that used in the monotonic test. In one cycle, the sample was stretched to a prescribed displacement and then unloaded. For samples without precut cracks, cyclic loads were applied to observe the change of stress–stretch curves. For precut samples, a camera was used to observe the propagation of the cracks. Both stretching and unloading were under a constant speed of 1 mm s−1. A digital camera was used to take a sequence of photos every 15 minutes. For every sequence of photos, we selected the one near to the zero stretch and measured the crack length.3. Sample preparation and stress–stretch curves
We dissolve polycarbonate urethane (PCU) particles in tetrahydrofuran (THF) solvent and submerge in the solution a knitted nylon fabric (Fig. 3a). After the solvent evaporates, the PCU coats the nylon fabric, forming a knit-PCU composite. The PCU matrix is transparent, and the nylon fabric is clearly visible under an optical microscope (Fig. 3b). The structure of the fabric does not change during the fabrication of the composite. We cut the composite and observe the cross section under a scanning electron microscope (Fig. 3c). The thickness of the composite is 175.5 ± 10.4 μm, and the fabric is mostly embedded in the matrix. Similarly, we prepare a composite of woven nylon fabric and PCU matrix.We cut a sample in a rectangular shape, clamp the two long edges of the sample, and monotonically stretch the sample until rupture. We repeat the experiment with three materials: the neat PCU, the knit-PCU composite, and the weave-PCU composite (Fig. 4a). The modulus of the knit-PCU composite (∼10 MPa) is similar to that of the neat PCU matrix (∼7 MPa) and is much lower than that of the weave-PCU composite (∼100 MPa) (Fig. 4b). In this study, the ultimate stretch is defined as the stretch at maximum stress, reflecting the failure of the composite (Fig. S2, ESI†). The maximum stress for both the polycarbonate urethane (PCU) matrix and the knit composite is close to each other. This can be attributed to the strength of the knit fabric, which does not enhance the overall strength of the composite. The ultimate stretch of knit-PCU composite is smaller than that of the neat PCU but is much larger than that of the weave-PCU composite (Fig. 4c). Because the yarn in a knit structure is crimped, the knit-PCU composite has a low modulus and a large ultimate stretch. By contrast, because the yarns in a weave are nearly straight, the weave-PCU composite has a high modulus and a small ultimate stretch.
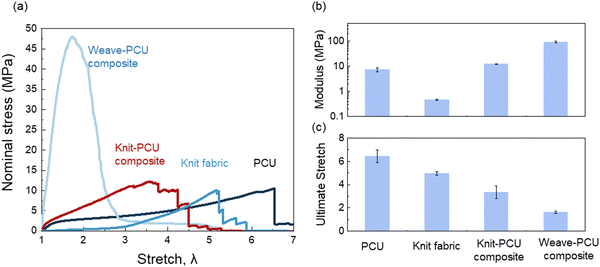 | ||
| Fig. 4 (a) Stress–stretch curves of four materials: PCU, knit fabric, knit-PCU composite, and weave-PCU composite. (b) Moduli and (c) ultimate stretches of the three materials. | ||
We stretch the knit-PCU composite under an optical microscope (Fig. 5). Define the stretch λ by the length of the deformed sample divided by the length of the undeformed sample. When λ < 1.2, the knit and the matrix are stretched concurrently. Neither the interface debonds, nor the yarn and matrix damage. In this stage, the stress–stretch curve of the composite is almost the same as that of PCU. The yarn curls and does not hinder the composite from deforming. When 1.2 < λ < 2, the yarn debonds from the matrix and cuts the matrix, but the yarn itself does not break (Fig. S3, ESI†). The yarn straightens to bear the load, so that the stress–stretch curve of the composite is above that of the neat PCU (Fig. 4a). The debond results in a channel in the matrix along the yarn (Movie S1, ESI†). When λ > 3.5, the yarn breaks, and large holes grow in the matrix till the sample separates into two parts.
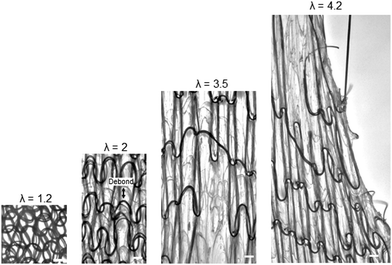 | ||
| Fig. 5 Snapshots of a knit-PCU composite stretched under an optical microscope. Scale bars are 200 μm. | ||
4. Crack growth under monotonic stretch
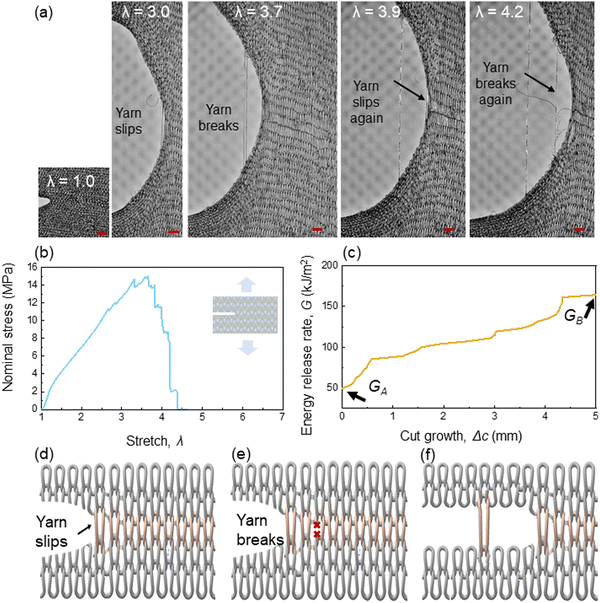
We then stretch the knit-PCU composite with a precut crack (Fig. 6a and Movie S2, ESI†). When the sample is not stretched, λ = 1, the precut crack cuts the yarn, so that the crack edges roll. When λ = 3, the yarn slips, and the crack grows in the matrix. The yarn does not break, and the friction between the yarn and the matrix resists the crack growth. When λ = 3.7, the yarn breaks at a location ahead of the precut crack tip, and the crack grows substantially in the matrix. When λ = 3.9, the broken segment of the yarn still bridges the crack but bears little force. Meanwhile, the yarn ahead of the crack tip slips, and the crack grows further in the matrix. When λ = 4.2, the yarn breaks again at a location ahead of the crack tip, and the crack grows further in the matrix.The stress–stretch curve is recorded during the test (Fig. 6b). The curve gradually rises to a peak. At the peak stress, the yarn breaks. The curve then descends in steps. Each step represents an additional yarn break. We convert the stretch to the energy release rate G by G = HW(λ), where W(λ) is the area under the stress–stretch curve of the intact sample, and H is the height of the sample.16 The crack growth Δc is recorded using a microscope and is plotted as a function of the energy release rate (Fig. 6c). We identify two critical energy release rates GA and GB. The energy release rate at Δc = 0 is taken as GA, which is 50 kJ m−2. We take GB as the peak energy release rate of the G–Δc curve, which is 170 kJ m−2. When G < GA, the yarn does not slip, and the crack does not grow in the matrix. When G = GB, the yarn slips and breaks, and the crack grows in the matrix.
The processes of yarn slip and yarn break are illustrated schematically (Fig. 6d–f). The yarn slips against friction between the yarn and the matrix. As the yarn slips, the matrix also damages. The friction and the strength of the matrix together resist the yarn slip. The end of the yarn bears no force. Tension in the yarn builds up along the length of the yarn. If the friction is low and the matrix is weak, a long length of the yarn carries a low tension, and the yarn breaks at a location many loops ahead of the crack tip. If the friction is high and the matrix is strong, a short length of the yarn carries a high tension, and the yarn breaks at a location a few loops ahead of the crack tip. In our experiment, the yarn breaks at a location about 3–8 loops ahead of the crack tip.
5. Cyclic stretch
We subject samples without precut to cyclic stretch. Long rectangular shaped samples are stretched cyclically with a prescribed amplitude of stretch (Fig. 7a). The stress–stretch curve shows a large hysteresis loop in the first cycle (Fig. 7b). After the first cycle, hysteresis becomes much smaller. The maximum stress drops from 6.74 MPa to 3.62 MPa after 10![[thin space (1/6-em)]](https://www.rsc.org/images/entities/char_2009.gif) 000 cycles. In subsequent cycles, the stress–stretch curve changes negligibly. Before the test, the sample has a smooth surface and embeds the yarn inside. After the test, there are many cracks on the surface of the matrix, and the yarn is exposed (Fig. 7c). Cyclic stretch causes the yarn to cut the matrix repeatedly, and the interface debonds. The yarn/matrix debonding contributes to the observed hysteresis. In addition, we test the hysteresis of PCU matrix (Fig. S5, ESI†) and find inherent viscoelasticity of the matrix also plays a significant role in the hysteresis.
000 cycles. In subsequent cycles, the stress–stretch curve changes negligibly. Before the test, the sample has a smooth surface and embeds the yarn inside. After the test, there are many cracks on the surface of the matrix, and the yarn is exposed (Fig. 7c). Cyclic stretch causes the yarn to cut the matrix repeatedly, and the interface debonds. The yarn/matrix debonding contributes to the observed hysteresis. In addition, we test the hysteresis of PCU matrix (Fig. S5, ESI†) and find inherent viscoelasticity of the matrix also plays a significant role in the hysteresis.
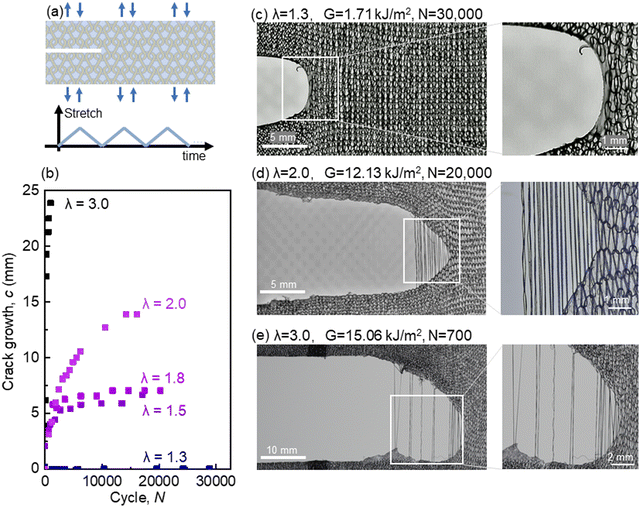
We then subject a sample with a precut crack to cyclic stretch. The sample is of a long rectangular shape and is gripped along the long edges. For each cycle, the sample is loaded to a prescribed amplitude of stretch and is then unloaded until the crosshead returns to the initial position of the unstretched sample (Fig. 8a). The crack growth is plotted as a function of the number of cycles (Fig. 8b). Several samples are tested at various amplitudes of stretch. Depending on the amplitude of stretch, three types of behavior are identified. For a low amplitude of stretch, λ = 1.3, the crack does not grow in the matrix after 30![[thin space (1/6-em)]](https://www.rsc.org/images/entities/char_2009.gif) 000 cycles. The tip of the precut crack shows negligible damage (Fig. 8c). For an intermediate amplitude of stretch, λ = 2.0, the crack grows in the matrix in the initial hundreds of cycles, and then arrests. Near the crack tip, the yarn slips out of the matrix cycle by cycle but does not break (Fig. 8d). The yarn slips against friction and bridges the crack. When the friction stops the yarn from slipping, the crack arrests. For a high amplitude of stretch, λ = 3.0, the crack grows unstopped as the yarn slips and breaks (Fig. 8e). When the yarn breaks in the bridging zone, the crack suddenly grows forward, a new bridging zone forms gradually under cyclic loading, and the yarn breaks again.
000 cycles. The tip of the precut crack shows negligible damage (Fig. 8c). For an intermediate amplitude of stretch, λ = 2.0, the crack grows in the matrix in the initial hundreds of cycles, and then arrests. Near the crack tip, the yarn slips out of the matrix cycle by cycle but does not break (Fig. 8d). The yarn slips against friction and bridges the crack. When the friction stops the yarn from slipping, the crack arrests. For a high amplitude of stretch, λ = 3.0, the crack grows unstopped as the yarn slips and breaks (Fig. 8e). When the yarn breaks in the bridging zone, the crack suddenly grows forward, a new bridging zone forms gradually under cyclic loading, and the yarn breaks again.
Recall that, after an intact sample is loaded for ∼10![[thin space (1/6-em)]](https://www.rsc.org/images/entities/char_2009.gif) 000 cycles, the stress–stretch curve changes negligibly and reaches a steady curve (Fig. 9b). Let Ws(λ) be the area under the stress–stretch curve of the 10
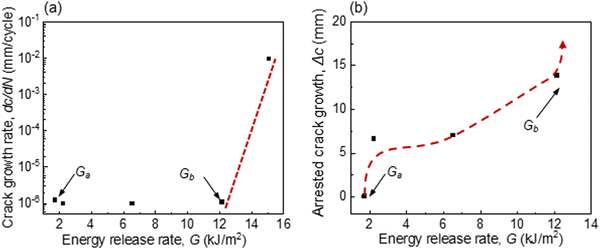
000 cycles, the stress–stretch curve changes negligibly and reaches a steady curve (Fig. 9b). Let Ws(λ) be the area under the stress–stretch curve of the 10![[thin space (1/6-em)]](https://www.rsc.org/images/entities/char_2009.gif) 000th cycle. We convert the amplitude of stretch to the amplitude of the energy release rate by G(λ) = HWs(λ).17,18 We identify two thresholds of the amplitude of energy release rate, Ga and Gb. Ga = 1.71 kJ m−2 and Gb = 12.13 kJ m−2. Here Ga is approximately the fatigue threshold of the neat PCU. When G < Ga, the crack cannot initiate even in the matrix. When Ga < G < Gb, the crack will grow and then arrest. When G > Gb, the crack will grow unstopped.
000th cycle. We convert the amplitude of stretch to the amplitude of the energy release rate by G(λ) = HWs(λ).17,18 We identify two thresholds of the amplitude of energy release rate, Ga and Gb. Ga = 1.71 kJ m−2 and Gb = 12.13 kJ m−2. Here Ga is approximately the fatigue threshold of the neat PCU. When G < Ga, the crack cannot initiate even in the matrix. When Ga < G < Gb, the crack will grow and then arrest. When G > Gb, the crack will grow unstopped.
The slope of the c–N curve changes concurrently with the cyclic crack growth. We linearly fit the part of the c–N curve corresponding to the steady crack growth or arrest and record the slope as the crack growth rate dc/dN. The crack growth rate dc/dN increases with the energy release rate G (Fig. 9a). When the crack growth rate is less than 10−5 mm per cycle, we take the corresponding energy release rate as the threshold, that is Gb = 12.13 kJ m−2. We take the length of crack growth before arrest as the arrest crack growth. When the arrest crack growth is less than 0.1 mm, we take the corresponding energy release rate as the threshold Ga = 1.71 kJ m−2. The arrest crack growth increases with the energy release rate (Fig. 9b). It is noticed that the arrest crack growth (∼10 mm) in the knit-PCU composite is very large compared to other materials, such as ceramics or a composite with epoxy matrix, where the crack arrests after propagating for <1 mm.19–21
6. Conclusions and discussion
We have studied the crack growth in the knit-PCU composite under both monotonic stretch and cyclic stretch. The crack grows in the matrix as the yarn slips and breaks. Under monotonic loading, we identify two critical energy release rates, GA and GB. When G < GA, the yarn does not slip, and the crack does not grow in the matrix. When GA < G < GB, the yarn slips but does not break, and the crack grows in the matrix. The growth is stable in that the crack arrests when the load stops increasing. When G = GB, the yarn slips and breaks, while the crack grows unstably. When the sample is subject to cyclic stretch, we observe analogous behavior of crack growth and arrest, as well as yarn slip and break. However, the two critical values, Ga and Gb, are much smaller than the corresponding values under monotonic load.G A and Ga represent the critical values for crack initiation. Under monotonic stretch, an energy release rate G = GA will cause cracks to initiate growth within the matrix, where the yarns start to slip. GA is related to the toughness of the matrix and the yarn-matrix interface strength. Similarly, Ga under cyclic stretch relates to the fatigue threshold of the matrix and the interface endurance strength. Thus, the fact that Ga is much smaller than GA is due to two factors: the fatigue threshold of the PCU being much lower than the toughness, and the interface endurance strength is much lower than the interface strength.22,23
G B and Gb represent the critical values for yarn break. Under monotonic stretch, the yarn breaks when the tension in the yarn reaches the strength. GB is related to the strength of the yarn and the strength of the interface.24 Similarly, Gb is related to the yarn endurance strength and interface endurance strength (Fig. S4, ESI†). Both the yarn endurance strength and interface endurance strength are much lower than the yarn strength25 and interface strength.26 Thus, Gb is much lower than GB.
In this study, we have examined crack growth in the course direction of a knitted fabric-reinforced composite. Future work will extend this investigation to the fracture behavior in the wale direction, where yarn laddering and breakage may play distinct roles in the crack propagation. Investigating the crack growth in this perpendicular direction will provide a more comprehensive view for the fracture of this composite. Polymer matrix exhibits temperature and rate-dependent properties that may affect the crack initiation and propagation behavior. Furthermore, four critical energy release rates are identified, with each corresponding to different failure modes. These energy release rates are influenced by factors such as yarn strength, interface strength, and matrix toughness. Understanding how these parameters affect the crack growth behavior enables more informed and targeted material design.
Author contributions
F. L. and X. C. designed the research. F. L. and X. C. carried out the experiments. J. T. and Z. S. supervised the work. All authors contributed to the writing of the paper.Data availability
Data for this article, including curves and bar charts are available at Science Data Bank at https://doi.org/10.57760/sciencedb.13605.Conflicts of interest
There are no conflicts to declare.Acknowledgements
This research was supported by the National Natural Science Foundation of China (Grant no. 12422204). J. T. acknowledges the support of K. C. Wong Education Foundation.Notes and references
- P. Fratzl, Collagen: structure and mechanics, Springer, 2008, pp. 1–13 Search PubMed.
- I. Vesely, J. Biomech., 1997, 31, 115–123 CrossRef PubMed.
- V. Ottani, M. Raspanti and A. Ruggeri, Micron, 2001, 32, 251–260 CrossRef CAS PubMed.
- Y. J. No, M. Castilho, Y. Ramaswamy and H. Zreiqat, Adv. Mater., 2019, 32, e1904511 CrossRef PubMed.
- L. Zeng, F. Liu, Q. Yu, C. Jin, J. Yang, Z. Suo and J. Tang, Sci. Adv., 2023, 9, eade7375 CrossRef CAS PubMed.
- W. Cui, Y. Huang, L. Chen, Y. Zheng, Y. Saruwatari, C.-Y. Hui, T. Kurokawa, D. R. King and J. P. Gong, Matter, 2021, 4, 3646–3661 CrossRef CAS.
- W. Cui, D. R. King, Y. Huang, L. Chen, T. L. Sun, Y. Guo, Y. Saruwatari, C. Y. Hui, T. Kurokawa and J. P. Gong, Adv. Mater., 2020, 32, e1907180 CrossRef PubMed.
- D. R. King, T. L. Sun, Y. Huang, T. Kurokawa, T. Nonoyama, A. J. Crosby and J. P. Gong, Mater. Horiz., 2015, 2, 584–591 RSC.
- G. Zhang, T. Yin, G. Nian and Z. Suo, Extreme Mech. Lett., 2021, 48, 101434 CrossRef.
- H. Fan and J. P. Gong, Macromolecules, 2020, 53, 2769–2782 CrossRef CAS.
- X. P. Ruan and T. W. Chou, Compos. Sci. Technol., 1996, 56, 1391–1403 CrossRef CAS.
- S. Poincloux, M. Adda-Bedia and F. Lechenault, Phys. Rev. X, 2018, 8, 021075 CAS.
- R. Chang, Z. Chen, C. Yu and J. Song, J. Appl. Mech., 2019, 86, 011012 CrossRef.
- T. J. Dann, D. J. Carr, R. M. Laing, B. E. Niven and J. Kieser, Forensic Sci. Int., 2012, 217, 93–100 CrossRef CAS PubMed.
- W. P. Moestopo, S. Shaker, W. Deng and J. R. Greer, Sci. Adv., 2023, 9, eade6725 CrossRef PubMed.
- R. S. Rivlin and A. G. Thomas, J. Polym. Sci., 2003, 10, 291–318 CrossRef.
- R. Bai, Q. Yang, J. Tang, X. P. Morelle, J. Vlassak and Z. Suo, Extreme Mech. Lett., 2017, 15, 91–96 CrossRef.
- W. Zhang, J. Hu, J. Tang, Z. Wang, J. Wang, T. Lu and Z. Suo, ACS Macro Lett., 2019, 8, 17–23 CrossRef CAS PubMed.
- L. Ewart and S. Suresh, J. Mater. Sci., 1987, 22, 1173–1192 CrossRef CAS.
- T. T. Shih and J. Opoku, Eng. Fract. Mech., 1979, 12, 479–498 CrossRef CAS.
- Y. Charles and F. Hild, Int. J. Fract., 2002, 115, 251–272 CrossRef.
- G. Scetta, E. Euchler, J. Ju, N. Selles, P. Heuillet, M. Ciccotti and C. Creton, Macromolecules, 2021, 54, 8726–8737 CrossRef CAS.
- G. Scetta, N. Selles, P. Heuillet, M. Ciccotti and C. Creton, Polym. Test., 2021, 97, 107140 CrossRef CAS.
- M. D. Thouless and A. G. Evans, Acta Metall., 1988, 36, 517–522 CrossRef CAS.
- P. Alam, D. Mamalis, C. Robert, C. Floreani and C. M. Ó. Brádaigh, Composites, Part B, 2019, 166, 555–579 CrossRef CAS.
- F. Liu, Z. Suo and J. Tang, J. Mech. Phys. Solids, 2022, 158, 104659 CrossRef.
Footnote |
| † Electronic supplementary information (ESI) available. See DOI: https://doi.org/10.1039/d4sm01114g |
| This journal is © The Royal Society of Chemistry 2024 |

