 Open Access Article
Fast hydrolysis for chemical recycling of polyethylene terephthalate (PET)†
Patrícia
Pereira
 a,
Willem
Slear
 a,
Angelo
Testa
 a,
Kevin
Reasons
 a,
Peter
Guirguis
 a,
Phillip E.
Savage
 *a and
Christian W.
Pester
 *ab
*ab
aDepartment of Chemical Engineering, The Pennsylvania State University, University Park, PA 16802, USA. E-mail: psavage@psu.edu; pester@psu.edu
bDepartment of Chemistry, Department of Materials Science and Engineering, The Pennsylvania State University, University Park, Pennsylvania 16802, USA
First published on 11th April 2024
Abstract
Chemical recycling of post-consumer polyethylene terephthalate (PET) provides a path toward circular production and use of this material. This article reports the effect of reaction severity and PET/water mass ratio on fast hydrolysis of PET, which can lead to complete depolymerization to monomers in tens of seconds. Rapid heating (5–10 °C s−1) during fast hydrolysis can promote hydrolytic PET depolymerization. This non-isothermal, non-catalytic reaction provided recovery of terephthalic acid (TPA), one of PET's monomers, exceeding 90% for reaction times as short as 75–95 seconds. More severe conditions (higher temperature and longer time) increased TPA decomposition while lower severities reduced PET depolymerization. Initial PET/water mass ratios of 1/10 or 1/8 gave the highest TPA yields and lowest values for the environmental energy impact metric associated with the depolymerization reaction. We determined an environmental energy impact factor of 436 ± 66 °C min, which is the lowest to date and surpasses the performance of isothermal PET hydrolysis, whether performed in neutral water (as is done here) or under acid catalysis. Byproducts, including phthalic acid, isophthalic acid, bis(2-hydroxyethyl)terephthalate, and benzoic acid, were also observed during the process.
Sustainability spotlightThis study delves into the chemical recycling of post-consumer polyethylene terephthalate (PET). The fast hydrolysis process described herein, uses a rapid heating rate of 5–10 °C s−1, and produces over 90% yield of terephthalic acid (TPA) in just 75–95 seconds. This non-isothermal, non-catalytic methodology provides the lowest environmental energy impact reported to date for PET hydrolysis. This work aligns with UN Sustainable Development Goal 12 (Responsible Consumption and Production), by working toward a circular solution for sustainable PET use. |
Introduction
Polyethylene terephthalate (PET) is a widely used thermoplastic, prevalent in consumer products such as water bottles, food containers, and textiles. The recycling rate of postconsumer PET in the United States was 29% in 2021, with most of the waste plastic going to landfill due to costly collecting and sorting processes, and PET's susceptibility to degradation during mechanical recycling.1,2Chemical recycling, i.e., depolymerizing PET into its monomers, has emerged as a potential alternative. PET is a condensation polymer with water being a synthetic byproduct. Hence, the reverse reaction pathway, hydrolysis of ester bonds, can depolymerize the plastic into its monomers: terephthalic acid (TPA) and ethylene glycol (EG). This is usually performed under isothermal conditions, being neutral, alkaline, or acidic.3–12
In preliminary work,12 we reported that fast hydrolysis of PET in neutral water produced nearly 80% TPA yield in less than one minute. This approach uses rapid heating at about 5–10 °C s−1 and total reaction times of tens of seconds. The non-isothermal process is akin to fast pyrolysis and fast hydrothermal liquefaction,13–18 which use rapid heating to decompose the biopolymers in biomass. Conventional neutral hydrolysis or catalyzed hydrolysis under isothermal conditions has an environmental energy impact metric of at least 104 °C min.9,19 This metric is widely used in this field, and it accounts for environmental impacts related to energy demand, waste production, and product yield. Using microwave heating during base-catalyzed hydrolysis can decrease the environmental energy impact metric by one order of magnitude.19 However, for catalyst-free, rapid-heating, fast hydrolysis, the environmental energy impact metric can be reduced by two orders of magnitude, indicating it is an even more environmentally friendly approach.12 Previously, PET hydrolysis has been achieved in under three minutes, however, it has required more complex processes, including the use of microwave heating combined with acid or base catalysts, or a sequential solvolysis approach.20–22
This article explores fast hydrolysis systematically over a range of batch holding times from 15 seconds to 3 minutes, a range of heat source set point temperatures (which control the heating rate experienced by the reactor) from 300 °C to 570 °C, and a range of PET/water mass feed ratios from 1/10 to 1/2. The overall goal is to map out the relevant parameter space and identify reaction conditions that give high yields of TPA with low environmental energy impacts.
Experimental section
Materials
Post-consumer PET was obtained from green 16.9 oz. Perrier® sparkling water bottles purchased locally. The labels and caps of the bottles were removed, and the bottles were subsequently cut into small chips with average dimensions of 6 ± 2 mm × 8 ± 2 mm. The bottle body had a thickness of 0.5 mm, while the bottom was slightly thicker, measuring 2 mm. Information about the plastic bottle chips is provided elsewhere.12 The melting point of the post-consumer PET was determined to be 250 °C using differential scanning calorimetry (DSC). Dimethyl sulfoxide (DMSO), which was used to dissolve reaction products, was purchased from Millipore Sigma. Terephthalic acid (TPA) and isophthalic acid (both 99% purity, TCI), phthalic acid (≥99.5%, Sigma Aldrich), bis(2-hydroxyethyl)terephthalate (BHET, Sigma Aldrich), and benzoic acid (99%, Thermo Scientific Chemicals) were employed for high performance liquid chromatography (HPLC) calibration purposes. Deionized water, obtained from an in-house water purification system comprising ion exchange, reverse osmosis, high-capacity ion exchange, UV sterilization, and submicron filtration units, served as the reaction medium.Experimental procedure for PET fast hydrolysis
Swagelok reactors were assembled from a stainless-steel port connector and two caps, resulting in an internal volume of about 4 mL. Some reactors were equipped with thermocouples that measured the internal temperature. The reactors were loaded with PET and deionized water, sealed, and placed in a Techne fluidized sand bath, which had been preheated to set point temperatures ranging from 300 °C to 570 °C, for batch holding times from 15 to 175 seconds. Higher set point temperatures provided faster heating. Additional runs were done with PET/water mass ratios (mPET/mw) of 1/8, 1/6, 1/4, 1/3, and 1/2. Table S1† provides information on all reactor loadings. To terminate the reaction, reactors were withdrawn from the sand bath and immediately submerged in room-temperature water. The cooled reactors were then opened. Small amounts of deionized water (10 mL in total) were pipetted into the reactor, withdrawn, and filtered through grade 1 cellulose filter paper (from Whatman) using a reusable 25 mm filter holder (from Cole-Parmer) to isolate solids. These solids, comprising unconverted PET and the reaction product (as a white solid based on visual observation), were recovered by drying the filters, syringes, and reactors overnight at 80 °C. The aqueous filtrate was dried in an oven at 45 °C overnight to recover any dissolved solids. We performed at least three independent hydrolysis runs at each experimental condition and report the mean values as the best estimates for product yields. Standard deviations were employed to assess run-to-run variability.Analysis of hydrolysis products
To dissolve any TPA in the solid-phase, 5 mL of DMSO was added. The resulting solution was filtered using a 25 mm diameter PTFE membrane filter with a pore size of 1 μm. The solids remaining after filtration comprised unconverted PET and DMSO-insoluble byproducts, which we refer to as undissolved solids (US). Solids recovered by evaporating the aqueous filtrate were also dissolved in DMSO. Both DMSO solutions were analyzed using a HPLC equipped with a Waters reverse-phase symmetry C18 column (5 μm particle size, 150 mm × 4.6 mm) operating at 40 °C. Detection was performed with a photodiode array detector (SPD-M20A) set at 240 nm. The mobile phase consisted of HPLC-grade acetonitrile at 0.1 mL min−1 and a 0.1 v% H3PO4 aqueous solution at 0.3 mL min−1. A sample injection volume of 1 μL was used. Calibration curves were established by analyzing standard solutions with known TPA, phthalic acid, isophthalic acid, BHET, and benzoic acid concentrations in DMSO. These calibrations and HPLC analysis of the reaction products provided the number of moles of each molecular reaction product. Molar yields were calculated as the moles of a given product divided by the moles of PET repeat units initially loaded into the reactor as we reported in a previous publication.12Machine learning analysis
We used the RandomForestRegressor function in the sklearn module in Python to determine whether the severity index, which combines both temperature and time effects, or the PET/water mass ratio had the larger influence on TPA yield. To enhance the predictive accuracy of the model and to minimize errors, we varied the number of trees from 1 to 1000. We reserved 10% of the dataset to test predictions and another 10% of the remaining data for model optimization. The balance of the dataset was allocated for training the model.Results and discussion
PET hydrolysis
The objective of fast hydrolysis is to accomplish PET depolymerization while minimizing overreaction and formation of undesirable byproducts. Reaction conditions need to be severe enough, with respect to temperature and time, for effective depolymerization, but not so severe that the TPA product decomposes and/or unwanted side reactions occur. Fig. 1 shows that the reactor temperature profiles for the different set point temperatures (TSP) collapse onto a single curve when represented by a dimensionless temperature (θ), defined as | (1) |
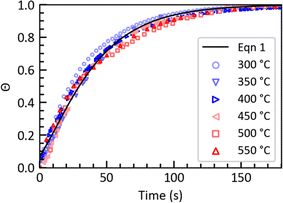 | ||
| Fig. 1 Measured reactor temperature profiles (discrete points) at different TSP and calculated viaeqn (1) (solid line). | ||
Table S2† presents the product yields from all the fast hydrolysis experiments. As a check on the completeness of product recovery, we calculated the “ring balance” for each experimental condition. The ring balance is the ratio of the moles of aromatic rings in the quantified products to the moles of aromatic rings loaded into the reactor in the initial PET. The hydrothermal reaction conditions are expected to leave aromatic rings intact. Results from experimental conditions that gave a ring balance that differed by more than ±15% from 100% or that had a mean value that differed from 100% by a statistically significant margin (p < 0.05) were excluded from figures displayed herein.
Table S2† shows that negligible TPA yield (<2%) was observed even after 175 seconds at a set point temperature of 300 °C. This is likely due to the relatively low temperature inside the reactor and the short reaction time, which prevented the depolymerization reaction from proceeding effectively. At TSP = 350 °C, YTPA increased to 11 ± 10% after 115 seconds and further to 35 ± 13% after 175 seconds. At the 350 °C set point, the internal temperature of the reactor exceeds the melting point of PET in about 55 seconds. Hydrolysis of PET in neutral water is much faster above its melting point.
Fig. 2a presents the temporal variation of the TPA yield (YTPA) and yield of undissolved solids (YUS, wt%) from fast hydrolysis at TSP = 400 °C. YTPA increased steadily with time (achieving 87 ± 9% at 175 s) and YUS steadily decreased. At set point temperature of 510 °C (Fig. 2b), YTPA reached a maximum and then declined, likely due to TPA degradation. This behavior appeared at TSP = 480 °C to 570 °C.
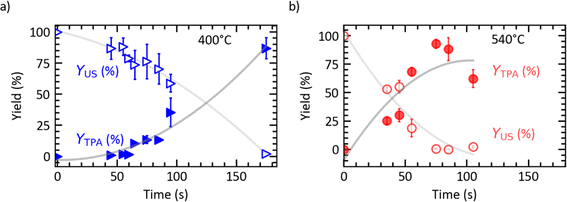 | ||
| Fig. 2 Effects of batch holding time on yields of TPA and undissolved solids from PET fast hydrolysis at TSP of (a) 400 °C and (b) 540 °C (mPET/mw = 1/10). The grey lines are a guide to the eyes. | ||
At set point temperatures above 480 °C, increasing the set point temperature decreases YTPA at 175 seconds. This indicates more TPA decomposition under the more severe reaction conditions. In addition, the higher the set point temperature, the less time is required for YTPA to achieve a maximum value. For example, at TSP = 480 °C YTPA starts decreasing after 95 seconds and at TSP = 510 °C it decreases after 75 seconds. The highest YTPA values obtained were 94 ± 3% at TSP = 510 °C and 75 seconds and 93 ± 4% at TSP = 540 °C and 75 seconds.
The contour plot in Fig. 3a summarizes how the combination of batch holding time and sand bath set point temperature influence the TPA yield from PET fast hydrolysis. Times less than 50 seconds give low YTPA, regardless of the TSP, within the range studied. Times greater than 130 seconds also gave low YTPA, provided the TSP is below 350 °C (where hydrolysis is slow) or above 510 °C (where TPA decomposes). At intermediate temperatures (TSP = 400 to 480 °C), YTPA values around 80% are accessible. This range further extends to higher TSP where yields surpassing 90% are attainable within shorter intervals (e.g., 500 °C, 75 s). It appears that high TPA yields from fast hydrolysis are not confined to a specific set of conditions but are attainable over a wide range of set point temperatures and holding times. This flexibility in operating conditions is an important feature as it can facilitate process optimization at scale to minimize cost and environmental impact.
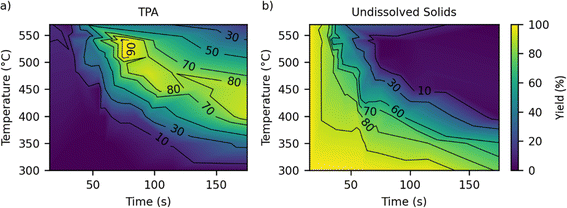 | ||
| Fig. 3 Contour plot illustrating effects of set point temperature and batch holding time on (a) TPA yield and (b) yield of undissolved solids from fast hydrolysis of PET (mPET/mw = 1/10). | ||
Fig. 3b presents the contour plot for the yields of undissolved solids from the fast hydrolysis experiments. There is a continuous decrease in the yield of undissolved solids as the reaction time increases for each set point temperature. Higher set point temperatures result in faster conversion of the undissolved solids. For example, 175 s, 95 s, and 75 s are required for the yield of undissolved solids to become <5% for TSP = 400 °C, 480 °C, and 510 °C, respectively.
A typical HPLC chromatogram can be found in Fig. S3.† Fig. S4 and S5† provide contour plots describing the yields of isophthalic acid and benzoic acid from PET hydrolysis at mPET/mw = 1/10. The isophthalic acid yields reach up to 21 ± 3% and depend on the reaction conditions. However, because the isophthalic acid content of commercial PET carbonated drink bottles is 1–3 wt%,23 the isophthalic acid byproduct cannot solely originate from release in commercial bottles during depolymerization. Čolnik et al.24 also observed the production of isophthalic acid during PET hydrolysis, and its yield was also dependent on temperature and reaction time. Further investigations are required to elucidate the pathway(s) for isophthalic acid formation during fast hydrolysis of PET. Table S2† shows that YBA increased with temperature and time, particularly under conditions where the yields of TPA begins decreasing.25 This behavior is consistent with benzoic acid being a decomposition product of TPA and perhaps isophthalic acid. The presence of these compounds indicates that the TPA produced is not pure. Some separations and purification of TPA would be needed before repolymerization to make PET. Methods for TPA purification include hydrogenation, use of activated carbon, re-crystallization, and filtration.26,27
Table S2† provides data for other byproducts. Phthalic acid, another TPA isomer, was also present, but in quantities too small to draw meaningful conclusions regarding variations in yield with reaction conditions. Bis(2-hydroxyethyl)terephthalate (BHET) is an additional byproduct. YBHET was <10% at mPET/mw = 1/10 and showed no clear correlation with reaction conditions.
Severity index
Fast hydrolysis is a non-isothermal process wherein the reactor temperature continually increases with time. This complicates the ability to compare results from runs at different set point temperatures. Therefore, we used an empirical severity index (SI),28 which combines the effects of temperature and time to facilitate the comparison of results over the wide range of reaction conditions used in these experiments. The severity index can be calculated as9 | (2) |
Fig. 4a illustrates TPA yield variations as a function of SI. YTPA is essentially zero up to log(SI) = 9. The yield then increases with increasing severities to reach over 90% at log(SI) ≈ 18. At more severe conditions, YTPA decreases due to increased side reactions. Fig. 4a shows that TPA yields published previously for isothermal hydrolysis of PET in neutral water12 follow the same trends with SI as the present TPA yields from fast hydrolysis.
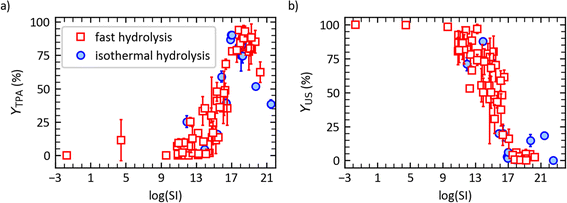 | ||
| Fig. 4 (a) TPA molar yield and (b) yield of undissolved solids vs. log of the severity index for isothermal hydrolysis12 (“filled circles”) and fast hydrolysis (“empty squares”) of post-consumer PET. | ||
Fig. 4b shows the yields of undissolved solids as a function of log(SI). For log(SI) < 12, YUS was above 80% (low PET conversion). The yield decreases sharply around log(SI) = 14 to 16, and it ultimately levels out at 0–20% for log(SI) > 16. The decline corresponds to the depolymerization of the solids. As was the case for TPA yields, the yields of undissolved solids from both fast and isothermal hydrolysis of PET follow the same correlation with log(SI).
Effect of mPET/mw on fast hydrolysis of PET
For fast hydrolysis to be conducted at scale, reducing the amount of water (relative to PET) would reduce material and energy inputs and environmental impacts (e.g., less wastewater). While the experiments discussed above were performed at a fixed PET/water mass ratio of 1/10, this section describes results from experiments with PET/water mass ratios of 1/8, 1/6, 1/4, and 1/2.Fig. 5a shows there is no statistically significant difference in TPA yield whether using a PET/water mass ratio (mPET/mw) of 1/10 or 1/8 across different set point temperatures and reaction times. However, Fig. 5b shows that further decreasing the amount of water decreases YTPA for hydrolysis at a TSP = 510 °C. Notably, this decrease is not related to insufficient water being present for hydrolysis. For PET hydrolysis, stoichiometry would require mPET/mw = 1/0.166, and even at mPET/mw = 1/2, water is present in large stoichiometric excess.
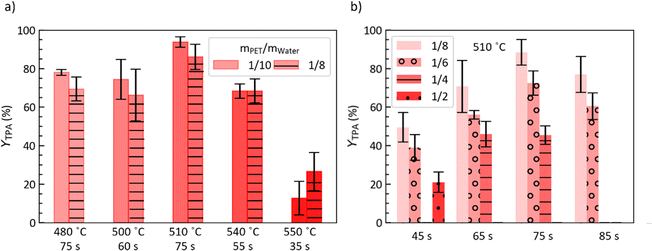 | ||
| Fig. 5 TPA yield from fast hydrolysis of post-consumer PET for (a) mPET/mw = 1/10 and 1/8 at TSP and t indicated, and (b) different mPET/mw and t at TSP = 510 °C. | ||
Table S2† shows that unlike YTPA, Yisophthalic acid i-TPA, YUS, and YBHET show little systematic variation with mPET/mw for a given batch holding time. This suggests the possibility of additional reactions occurring at higher PET/water mass ratios, potentially involving product interconversion and/or an equilibrium between byproducts and intermediates. Such reactions would include interconversion from TPA to isophthalic acid and TPA decarboxylation to benzoic acid.25 Overall, these results suggest a practical upper bound of mPET/mw of 1/8 for PET fast hydrolysis.
We performed additional analysis to determine which variable predominantly affects the YTPA: the severity index, reflecting the temperature–time interplay, or the PET/water mass ratio. Insights derived from a machine learning random forest regression analysis reveal that the normalized logarithm of severity index exerts a significantly greater influence on the TPA yield than does the normalized PET/water mass ratio. The respective contributions are 94.7% and 5.3%. Fig. S1† shows the model did a good job fitting the experimental data, and Fig. S2† shows the predictive capability.
Environmental energy impact
The environmental energy impact metric, ξ, quantifies the environmental impact of the process.19,29 | (3) |
Temperature (T) is in units of celsius (°C) and time (t) is in minutes. Lower ξ values indicate a more environmentally friendly process (higher TPA yields, lower temperature, shorter time, and less waste). This metric has found wide use in prior studies as it incorporates energy requirements, waste generation, and product yield.19,30 In accordance with established practice, 10% of the reaction medium (mw) was assumed to be replenished due to losses.
Table S2† details ξ for each batch holding time, TSP, and mPET/mw ratio. The lowest ξ values at mPET/mw = 1/10 appeared for hydrolysis for 75 seconds at TSP = 510 °C (ξ = 455 ± 31 °C min) and 540 °C (ξ = 481 ± 43 °C min). Fig. S6† shows that within the vicinity of these conditions, there is a larger area where the ξ values remain relatively low and are less than 1000. However, the environmental energy impact equation shows that, all other conditions being equal, ξ can be reduced by using less water. Fig. 6 shows ξ is statistically indistinguishable for the experiments at TSP = 510 °C with mPET/mw = 1/10, 1/8, and 1/6 at 75 seconds.
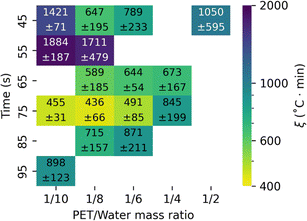 | ||
| Fig. 6 Effect of batch holding time and mPET/mw on the environmental energy impact metric from fast hydrolysis of post-consumer PET at TSP = 510 °C. | ||
The environmental energy impact metrics for fast hydrolysis are lower than those for isothermal hydrolysis, whether in neutral water or acid/base-catalyzed. Isothermal processes typically have ξ around 104 °C min.9,19 The previous lowest ξ (235 ± 44 °C min) was achieved from fast hydrolysis at a set point temperature of 500 °C with a reaction time of 1 minute and a PET/water mass ratio of 1/3.12 This value was based on three independent experimental runs. As we did additional replicates at this condition, however, the average ξ increased to 630 ± 420 °C min, with the uncertainty largely due to variability in TPA yield (51 ± 17%, Table S2†). Thus, the combinations of TSP = 510 °C, 75 seconds, and a mPET/mw = 1/10, 1/8, or 1/6 give the lowest ξ among the conditions tested to date for fast hydrolysis of post-consumer PET.
Remarks on fast hydrolysis at scale
Given the promise that fast hydrolysis shows for effective depolymerization of PET (e.g., potential technical feasibility), it is important to consider economic feasibility, especially relative to conventional isothermal hydrolysis. Fast hydrolysis experiments that led to high yields of TPA involved the reaction temperature reaching T = 443 °C (510 °C set point after 75 seconds, Table S2†) just before the reaction was quenched. In contrast, isothermal hydrolysis can be conducted effectively at a lower temperature (e.g., 310 °C). We assume, for simplicity, that the reactor energy demand is the heat duty required to increase the enthalpy of the water in the reactor, as it has the greatest thermal mass in the system. The heat duty, assuming no heat loss for the reacting system, would be 2.8 MJ kg−1 (enthalpies obtained from the steam tables)31 for fast hydrolysis. This is approximately twice the heat duty needed for isothermal hydrolysis (1.3 MJ kg−1). This greater amount of energy would need to be supplied over a shorter time scale, meaning the power requirement for fast hydrolysis would be greater than that for isothermal hydrolysis. Of course, a mitigating factor with the energy demand is heat integration, which would be part of any well-designed chemical process. That is, at steady state, the actual energy input would be less than ΔH for the reactor, as thermal energy would be recovered from the hot effluent stream and used to heat the feed stream. A second mitigating factor is the short residence time. Reaction severity is determined by the combination of the temperature profile and the reaction time. The severity index for fast hydrolysis at a set point temperature of 510 °C for 75 s (log(SI) = 17.8) is less than that for isothermal hydrolysis at 310 °C for 30 min (log(SI) = 18.2). Thus, when assessing the severity of reaction conditions, one needs to consider the reaction time and not reaction temperature alone. Further, a fast hydrolysis reactor would only require about 5% of the volume of an isothermal hydrolysis reactor because fast hydrolysis required 75 seconds of residence time, while isothermal hydrolysis requires 1800 seconds. For a given flow rate, reactor volume is proportional to the residence time required. Thus, one expects the capital cost for the reactor section in a fast hydrolysis process to be lower than that for isothermal hydrolysis.32If fast hydrolysis were to be done at scale, continuous tubular reactors would likely be used. These offer superior heat and mass transfer rates, and they have been used in pilot plants for continuous hydrothermal liquefaction processes.33 Naphtha cracking is a current industrial process that requires high temperatures and short reactor residence times. In a typical cracker, the reactor coils are at 750–900 °C, the hydrocarbon feedstock flows through the reactor in 0.1–0.6 seconds, and the flowing fluid absorbs heat at a rate of 50–80 kW m−2.34 These conditions are even more demanding than those anticipated for fast hydrolysis at scale.
Adaptability is another issue that is important when considering scalability. That is, how effective is the fast hydrolysis approach in processing other condensation polymers and mixed plastics, beyond just post-consumer PET, which was the focus of this study? Previous work35 demonstrated that TPA can be produced in high yields from PET via isothermal hydrolysis of a binary mixture of plastics. In fact, the second plastic enhanced the yield of TPA and reduced the yields of byproducts. Experiments are underway in our lab to address these important questions regarding fast hydrolysis.
An issue related to feedstock flexibility is separation of TPA from other hydrolysis products and production of pure TPA at scale. As noted earlier in this article, methods have been developed for TPA purification.26,27 These would need to be assessed and perhaps adjusted as part of the scale-up research and development portfolio.
This brief discussion highlights just a few key process differences for fast and isothermal hydrolysis. Additional differences could be expected as these processes receive additional scrutiny and further details emerge (e.g., design of separation systems). Of course, complete technoeconomic assessments beyond these considerations would be needed to holistically identify all relative advantages and disadvantages of a fast hydrolysis process at scale.
Conclusions
We investigated the potential of fast hydrolysis for chemical recycling of post-consumer polyethylene terephthalate (PET). Herein we show the lowest environmental energy impact metrics to date for neutral hydrolysis of PET and even for acid/base-catalyzed hydrolysis. TPA yield can be correlated and predicted by employing an empirical severity index that accounts for temperature and time. Higher severities led to TPA decomposition, while lower severities result in insufficient TPA production. TPA yields from isothermal neutral hydrolysis of PET followed the same correlation with SI as did yields from fast hydrolysis. Given this general ability of SI to correlate TPA yields, temperature, time, and heating rate can be manipulated to optimize TPA production from PET hydrolysis. Severity index was shown to have a higher impact on the TPA yield than did the PET/water mass ratio. We observed a practical upper bound of mPET/mw of 1/8 for PET fast hydrolysis, above which TPA yield decreased. As is often the case in engineered systems, there are tradeoffs when comparing fast hydrolysis and isothermal hydrolysis. A fast hydrolysis reactor would be smaller than an isothermal reactor, due to the holding time being about one minute instead of tens of minutes. This feature means reduced capital costs. Fast hydrolysis involves rapid heating to temperatures higher than those used in isothermal hydrolysis, so greater thermal energy would be required. Of course, heat recovery would be part of any well-engineered process, and this could offset some of the higher energy demand.Conflicts of interest
There are no conflicts to declare.Acknowledgements
This material is based upon work supported by the National Science Foundation under Grant EFRI E3P number 2029397.References
- K. Ghosal and C. Nayak, Mater. Adv., 2022, 3, 1974–1992 RSC.
- NAPCOR, PET Recycling Reports, https://napcor.com/reports-resources/, accessed 7 April 2023 Search PubMed.
- C. N. Onwucha, C. O. Ehi-Eromosele, S. O. Ajayi, M. Schaefer, S. Indris and H. Ehrenberg, Ind. Eng. Chem. Res., 2023, 62, 6378–6385 CrossRef CAS.
- W. Yang, J. Wang, L. Jiao, Y. Song, C. Li and C. Hu, Green Chem., 2022, 24, 1362–1372 RSC.
- G. P. Karayannidis, A. P. Chatziavgoustis and D. S. Achilias, Adv. Polym. Technol., 2002, 21, 250–259 CrossRef CAS.
- S. Ügdüler, K. M. Van Geem, R. Denolf, M. Roosen, N. Mys, K. Ragaert and S. De Meester, Green Chem., 2020, 22, 5376–5394 RSC.
- J. V. Valh, B. Vončina, A. Lobnik, L. F. Zemljič, L. Škodič and S. Vajnhandl, Text. Res. J., 2020, 90, 1446–1461 CrossRef CAS.
- W. Yang, R. Liu, C. Li, Y. Song and C. Hu, Waste Manage., 2021, 135, 267–274 CrossRef CAS PubMed.
- P. Pereira, P. E. Savage and C. W. Pester, Green Chem., 2024, 26, 1964–1974 RSC.
- S. D. Mancini and M. Zanin, Prog. Rubber, Plast. Recycl. Technol., 2004, 20, 117–132 CrossRef CAS.
- D. Stanica-Ezeanu and D. Matei, Sci. Rep., 2021, 11, 4431 CrossRef CAS PubMed.
- P. Pereira, C. W. Pester and P. E. Savage, ACS Sustain. Chem. Eng., 2023, 11, 7203–7209 CrossRef CAS.
- B. Motavaf and P. E. Savage, ACS ES&T Eng., 2021, 1, 363–374 Search PubMed.
- D. S. Scott, S. R. Czernik, J. Piskorz and D. A. St G Radlein, Energy Fuels, 1990, 4, 407–411 CrossRef CAS.
- J. Ni, L. Qian, Y. Wang, B. Zhang, H. Gu, Y. Hu and Q. Wang, Fuel, 2022, 327, 125135 CrossRef CAS.
- Q.-V. Bach, M. V. Sillero, K.-Q. Tran and J. Skjermo, Algal Res., 2014, 6, 271–276 CrossRef.
- B. Hu, Z. Zhang, W. Xie, J. Liu, Y. Li, W. Zhang, H. Fu and Q. Lu, Fuel Process. Technol., 2022, 237, 107465 CrossRef CAS.
- L. Zhu, M. Huang, Z. Ma, B. Cai, W. Zhang, H. Peng and D. Chen, Fuel, 2023, 349, 128734 CrossRef CAS.
- E. Barnard, J. J. R. Arias and W. Thielemans, Green Chem., 2021, 23, 3765–3789 RSC.
- A. Căta, M. N. Ştefănuţ, I. M. C. Ienaşcu, C. Tănasie and M. Miclău, Rev. Roum. Chim., 2017, 62, 531–538 Search PubMed.
- J. J. R. Arias and W. Thielemans, Green Chem., 2021, 23, 9945–9956 RSC.
- M. Azeem, M. B. Fournet and O. A. Attallah, Arabian J. Chem., 2022, 15, 103903 CrossRef CAS.
- M. Atkins, N. Curry and S. Evans, Polymer Recycling, WO2022171874A1, 2021, https://patents.google.com/patent/US5869543A/en Search PubMed.
- M. Čolnik, Ž. Knez and M. Škerget, Chem. Eng. Sci., 2020, 223, 116389 Search PubMed.
- J. B. Dunn, M. L. Burns, S. E. Hunter and P. E. Savage, J. Supercrit. Fluids, 2003, 27, 263–274 CrossRef CAS.
- H. L. Lee, C. W. Chiu and T. Lee, Chem. Eng. J. Adv., 2021, 5, 100079 CrossRef CAS.
- Y. Peng, J. Yang, C. Deng, Y. Fu and J. Deng, Nat. Commun., 2023, 14, 3249 CrossRef CAS PubMed.
- L. Qian, S. Wang and P. E. Savage, Appl. Energy, 2020, 260, 114312 CrossRef CAS.
- A. M. Al-Sabagh, F. Z. Yehia, G. Eshaq, A. M. Rabie and A. E. ElMetwally, Egypt. J. Pet., 2016, 25, 53–64 CrossRef.
- J. J. R. Arias and W. Thielemans, Green Chem., 2021, 23, 9945–9956 RSC.
- A. H. Harvey, Thermodynamic Properties of Water: Tabulation from the IAPWS Formulation 1995 for the Thermodynamic Properties of Ordinary Water Substance for General and Scientific Use, https://www.nist.gov/srd/nistir5078, accessed 12 September 2021 Search PubMed.
- J. R. Couper, D. W. Hertz and F. L. Smith, in Perry's Chemical Engineers' Handbook, ed. D. W. Green and R. H. Perry, The McGraw-Hill Companies, Inc., New York, 8th edn, 2008, pp. 9 Search PubMed.
- I. Johannsen, B. Kilsgaard, V. Milkevych and D. Moore, Processes, 2021, 9, 1–18 CrossRef.
- Kirk-Othmer Concise Encyclopedia of Chemical Technology, ed. Kirk-Othmer, Wiley-Interscience, New York, 4th edn, 1985 Search PubMed.
- S. M. Subramanya, Y. Mu and P. E. Savage, ACS Eng. Au, 2022, 2, 507–514 CrossRef.
Footnote |
| † Electronic supplementary information (ESI) available: Water and PET loadings. Summary of experimental results for each fast hydrolysis condition examined. Contour plots of yields of byproducts. Environmental energy impact vs. holding time and set point temperature. See DOI: https://doi.org/10.1039/d4su00034j |
| This journal is © The Royal Society of Chemistry 2024 |
