Ambient and sub-ambient temperature direct air CO2 capture (DAC) by novel supported in situ polymerized amines†
Akram A.
Al-Absi
 ,
Anne M.
Benneker
 and
Nader
Mahinpey
 *
*
Department of Chemical and Petroleum Engineering, Schulich School of Engineering, University of Calgary, Calgary, AB T2N 1S4, Canada. E-mail: Nader.mahinpey@ucalgary.ca
First published on 27th March 2024
Abstract
With the dramatic increase in CO2 emissions over the last few decades and the subsequent increase in global temperatures leading to climate change, substantial efforts have been directed towards the development of materials designed for the direct capture of CO2 from the atmosphere, a process known as direct air capture (DAC). DAC stands out as one of the primary negative emission technologies (NETs) expected to play a pivotal role in achieving negative CO2 emissions. However, most of the reported sorbent performances have been focused on ambient temperatures (around 25 °C) or higher, specifically under dry conditions, with very few exceptions. This limitation has posed a significant obstacle to the widespread deployment of DAC, as a substantial portion of the world experiences sub-ambient temperatures and non-zero humidity levels. In this study, we evaluate the in situ cationic ring-opening polymerization of three different 2-oxazolines monomers initiated by CPTMS or IPTMS, which are chemically tethered to mesoporous silica foam (MSF) and large-pore alumina-silica (LPAlSi) supports, and their performance for CO2 capture under various conditions. Among all combinations of supports, initiators, and monomers, the MSF–C–EtOX sorbent demonstrated exceptional utilization of the support, initiator, and monomer properties, resulting in superior CO2 uptakes under various conditions. The optimum adsorption temperature under dry conditions was found to be 40 °C, achieving a CO2 uptake of 1.72 mmol g−1. Further testing under sub-ambient dry adsorption conditions at −20 °C showed a CO2 capacity of 0.80 mmol g−1. The introduction of moisture significantly enhanced CO2 uptakes, reaching 2.45 mmol g−1 at 20 °C. Under humid conditions, the sorbent exhibited robust performance at low temperatures, with CO2 uptakes of 1.88 and 1.40 mmol g−1 at 0 °C and −20 °C, respectively. Importantly, the sorbent demonstrated stable cycling capacity over 50 and 10 cycles under dry and humid conditions, respectively. The findings presented in this study suggest that supported in situ polymerized amines are promising materials for DAC under ambient-temperature and low-temperature conditions. There are additional prospects for fine-tuning these materials to facilitate the large-scale implementation of DAC facilities under diverse environmental conditions.
1. Introduction
Global warming is primarily fueled by the accumulation of greenhouse gases (GHGs), with carbon dioxide (CO2) contributing to approximately 75% of GHGs.1,2 To put this into perspective, in just the span of a few decades, we have witnessed a drastic shift in atmospheric CO2 content. In 1958, the worldwide CO2 emissions from industry and fossil fuels amounted to less than 9 billion tons, with a CO2 concentration in the atmosphere of 315 parts per million (ppm).3,4 However, the scenario today is vastly different, with our current CO2 emissions exceeding 37 billion tons per year, not even accounting for land use changes.4 This dramatic transformation is attributed to a surging global population, increased energy demands, evolving lifestyles, and the proliferation of fossil fuel-based material consumption. Consequently, the CO2 level has surged to 425 ppm, according to data from the National Aeronautics and Space Administration (NASA).3–5This remarkable increase in GHGs has already had far-reaching consequences around the world, manifesting as widespread droughts on nearly every continent (excluding Antarctica), an elevated risk of heatwaves in Europe, the retreat of glaciers, a notable surge in wildfires in the USA and Canada, and significant disruptions to marine ecosystems. These include ocean acidification, destabilization of coastal ice sheets, and increasing sea levels.1,6–8 According to the Intergovernmental Panel on Climate Change (IPCC), should mitigation efforts falter, CO2 emissions could potentially soar to a staggering 70 billion tons of CO2 per year in 2100, resulting in an approximate 5 °C increase in the Earth's average temperature from its current level.1,6 The climate-related consequences we've already witnessed are expected to intensify if we fail to take action.6
Numerous studies have proposed solutions to mitigate the increase in the atmospheric CO2 concentration. These solutions include reducing our reliance on fossil fuels, transitioning to green and renewable energy sources, and minimizing CO2 point source emissions through methods such as chemical looping, oxy-combustion, amine absorption, or other CO2 capture techniques before its release into the atmosphere.9–16 However, it's important to note that these strategies primarily have the potential to slow the rate of increase of CO2 in the atmosphere, as they may not fully address non-point sources of CO2 emissions.17,18
To address the challenge of increasing CO2 concentrations and work towards achieving the goal of limiting the increase in Earth's average temperature to 1.5 °C or 2 °C by 2100, an alternative approach involves the use of negative emissions technologies (NETs).1 NETs focus on directly removing CO2 from the atmosphere, offering a means of reversing CO2 concentrations. Among various NETs, direct air capture of CO2 (DAC) stands out as a highly promising option due to its location-independence and possibility of upscaling.11,19 DAC facilities can be strategically located in areas with access to renewable energy sources and in close proximity to CO2 utilization plants, eliminating the need for extensive transportation.20,21
DAC has garnered significant attention, with numerous technologies proposed for practical deployment. Among these, aqueous hydroxide and supported amine-based technologies are the most frequently discussed and promising solutions.11,22,23 Supported amine-based sorbents, in particular, have gained favor due to their lower regeneration temperature, which results in reduced energy consumption per ton of captured CO2.24–26 Solid amine-based sorbents fall into different categories based on their preparation methods and bonds formed between the amines and the support material.24,26 In class I, amines are physically impregnated into supports via physical bonding such as van der Waals. Class II sorbents are characterized by the chemical bonding of supports and amine compounds through silane linkages.24 Lastly, class III sorbents are synthesized via an in situ polymerization route where amines are covalently linked to supports. Even though class II and class III are similar in terms of the covalent bonding between the amines and the support, class III is focused on the in situ polymerization of monomers while in class II, amine compounds are already pre-synthesized.26 Each class has its own set of pros and cons. Class I sorbents are the easiest to prepare and offer higher amine loadings,2,27,28 but they suffer from stability issues due to amine leaching.29 Class II sorbents are more stable due to chemical tethering but have lower CO2 uptake and involve a more complex synthesis process.30 Class III sorbents, a relatively recent addition, are characterized by both high capacity and stability but entail the most complex synthesis process.31
In class III, several factors play a significant role in determining the properties of tethered amines, including the starting monomer, initiator, support material, and mechanism of polymerization. Most of the existing research focuses on uncontrolled aziridine polymerization, resulting in branched amines that can lead to diffusion limitations of CO2 within the sorbent. There has been relatively little investigation into oxazolone polymerization, which produces linear amines with fewer diffusion limitations.24,32 Only 2-methyl-2-oxazoline as a monomer initiated with 3-iodopropyltrimethoxysilane is reported.17,25,33 This leaves room for many factors to be further explored and understood.
An ideal DAC sorbent should possess several key characteristics, including high capacity, selectivity for CO2 even at ultra-low concentrations, rapid kinetics, appropriate binding energy with CO2, and versatility to operate across a wide range of adsorption conditions.34 However, the majority of reported materials have primarily focused on adsorption at ambient and above-ambient temperatures. Only a few exceptions have explored materials such as impregnated MIL-101(Cr),11 zeolites,19 impregnated alumina,27 and amine impregnated MIL-101(Cr) fibers35 for DAC under sub-ambient conditions, with only two studies considering the availability of moisture. This limited focus has resulted in significant knowledge gaps that hinder the practical implementation of DAC on a global scale.36 Moreover, many regions around the world experience average temperatures below 25 °C, with some areas undergoing significant temperature variations throughout the year as shown in Fig. 1 and S.1†.37 Therefore, it is essential to thoroughly investigate and understand the behavior of sorbents under real-world adsorption conditions, including temperature and relative humidity, to facilitate the widespread deployment of DAC plants.
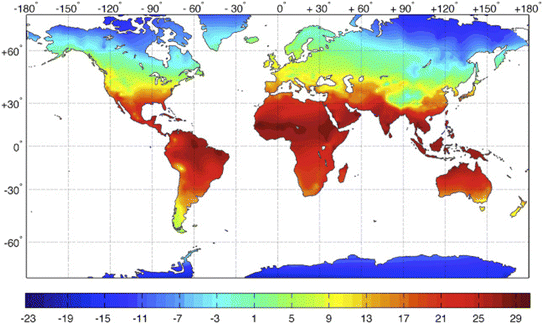 | ||
| Fig. 1 Global distribution of annual mean temperature (°C). Copyright 2016 Elsevier.37 | ||
In this study, we explore the impact of novel in situ cationic ring-opening polymerization using different monomers (MeOX, EtOX, and PhOX) and different initiators (IPTMS and CPTMS) onto two supports, MSF and LPAlSi. We examine the resulting amine loadings and the performance of the various final sorbents under diverse adsorption conditions that mimic practical DAC operations, encompassing temperatures ranging from −20 to 60 °C and relative humidity levels from 0% to 83%, where there is a huge knowledge gap in the literature. We confirm the properties of the supports and the functionalized materials using various characterization techniques. This work offers a comprehensive analysis of CO2 adsorption kinetics, isotherms, thermodynamics, and cyclic adsorption–desorption behavior under different adsorption conditions.
Notably, the use of CPTMS as an initiator and EtOX as a monomer in MSF resulted in the highest CO2 adsorption capacity with exceptional selectivity. We found that 40 °C was the optimal temperature for dry adsorption, while 20 °C showed superior performance under humid conditions, with an optimal humidity level of 62%. In addition, the sorbent was capable of capturing 1.40 mmol g−1 at −20 °C and 62 RH%. Importantly, the sorbent demonstrated remarkable stability during long-term cyclic temperature swing adsorption–desorption. These results, for the first time, highlight the great promise of in situ polymerization-based sorbents and their high potential for deployment in DAC under various relevant operating conditions.
2. Results and discussion
2.1 Characterization
The nitrogen isotherms of both the support (LPAlSi) and the final sorbents are depicted in Fig. 2a. They all exhibit a type IV isotherm (IUPAC classification) with hysteresis between the adsorption and desorption branches, a characteristic of mesoporous solids.38,39 As detailed in Table 1, the surface area and pore volume of LPAlSi were measured at 959 m2 g−1 and 2.13 cm3 g−1, respectively, surpassing values reported in the literature (716 m2 g−1 and 1.56 cm3 g−1).39 Likewise, the MSF support exhibited a type IV isotherm, as previously reported in our earlier publication,17 with around a 20% increase in surface area (attributed to differences in the aging process) compared to the previous support. The pore size distribution of LPAlSi was narrow, centered at around 9 nm, while MSF had a distribution peaking at 30 nm, as displayed in Fig. 2c and d.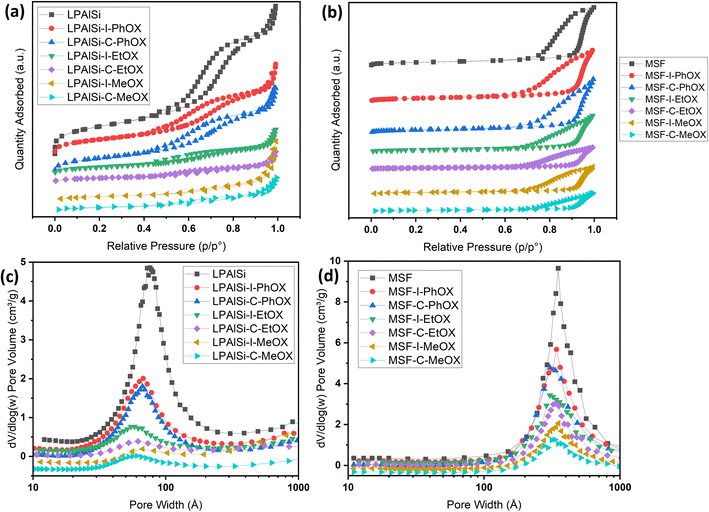 | ||
| Fig. 2 (a) and (b) N2 adsorption–desorption isotherms at −195.8 °C of the supports and the final sorbents. Note that isotherms are separated for clarity and isotherms with the Y-axis are provided in Fig. S.2;† (c) and (d) BJH pore size distributions of the supports and the final sorbents. | ||
| Material | S BET (m2 g−1) | V P (cm3 g−1) | D P (nm) |
|---|---|---|---|
| a Number in parentheses obtained via XRF (X-ray fluorescence) analysis. | |||
| LPAlSi-15 (13.1)a | 959 | 2.13 | 8.82 |
| LPAlSi–C–MeOX | 126 | 0.43 | 12.71 |
| LPAlSi–I–MeOX | 152 | 0.63 | 9.60 |
| LPAlSi–C–EtOX | 131 | 0.49 | 11.30 |
| LPAlSi–I–EtOX | 232 | 0.86 | 9.23 |
| LPAlSi–C–PhOX | 480 | 1.23 | 8.67 |
| LPAlSi–I–PhOX | 489 | 1.28 | 8.82 |
| MSF | 522 | 2.93 | 30.13 |
| MSF–C–MeOX | 93 | 0.76 | 30.38 |
| MSF–I–MeOX | 140 | 1.13 | 31.13 |
| MSF–C–EtOX | 118 | 0.90 | 27.12 |
| MSF–I–EtOX | 195 | 1.28 | 29.29 |
| MSF–C–PhOX | 290 | 2.12 | 29.06 |
| MSF–I–PhOX | 302 | 2.23 | 27.15 |
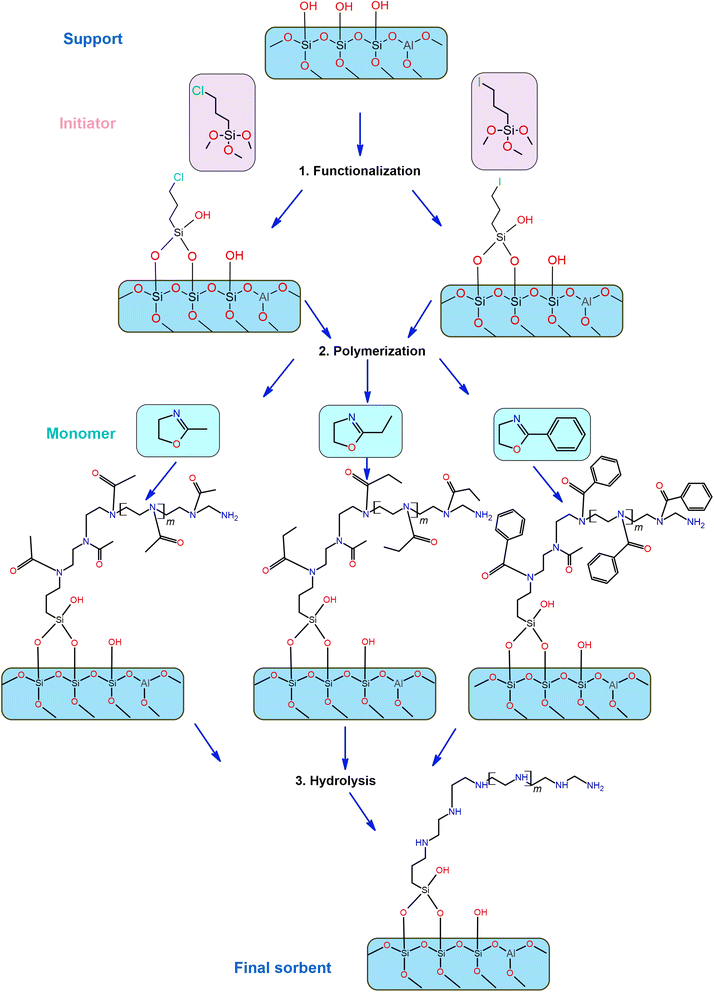
Following the functionalization and in situ polymerization of both supports, there was a noticeable and consistent decrease in surface area and pore volume for all the final sorbents, indicating pore filling by amines with different loadings. In general, functionalization with chlorine “C” resulted in higher amine loadings and greater reductions in surface area and pore volume (Table 1) than that with iodine “I” while using the same monomer. This difference in loadings can be attributed to variations in electrophilicity indices, which measure a molecule's ability to attract electrons. Chlorine, with an electrophilicity index of 3.67, exhibits higher electrophilicity compared to iodine, which has an index of 3.09.40,41 The enhanced electrophilicity of chlorine facilitates the initiation of the polymerization reaction. In this reaction, the nucleophilic attack originates from the lone pair of nitrogen in the 2-oxazoline monomer, targeting the electrophilic initiator (chlorine in this instance). This interaction results in the formation of an oxazolinium cation, which serves as the starting point for the polymerization reaction. Subsequently, during the propagation phase, the 2-oxazoline monomer engages with the cationic oxazolinium intermediate, leading to the formation of the polyoxazoline backbone through ring-opening and the creation of an amide, while the living oxazolinium chain-end remains.42
Another crucial observation from Table 1 pertains to the influence of different monomers on the surface area and pore volume of the resulting sorbents, which corresponds to the amine loadings. MeOX had the most significant impact, resulting in the greatest reduction in porosity of the supports. Following this, EtOX had a milder effect, and PhOX had the least impact on porosity. As illustrated in Fig. 12, MeOX is characterized by its small molecule size, leading to fewer diffusion limitations during the in situ polymerization process within the pores of the supports. Consequently, it exhibits a higher degree of polymerization and a greater amine loading. PhOX, with its larger benzene side group, limits the number of monomers available for in situ polymerization within the pores, resulting in the lowest amine loadings among the monomers. EtOX demonstrated an intermediate behavior compared to MeOX and PhOX. Furthermore, during the hydrolysis of EtOX-based sorbents, the removal of side amide chains created a favorable diffusion pathway for CO2 molecules into the inner adsorption sites, reducing resistance in comparison to MeOX-based sorbents.
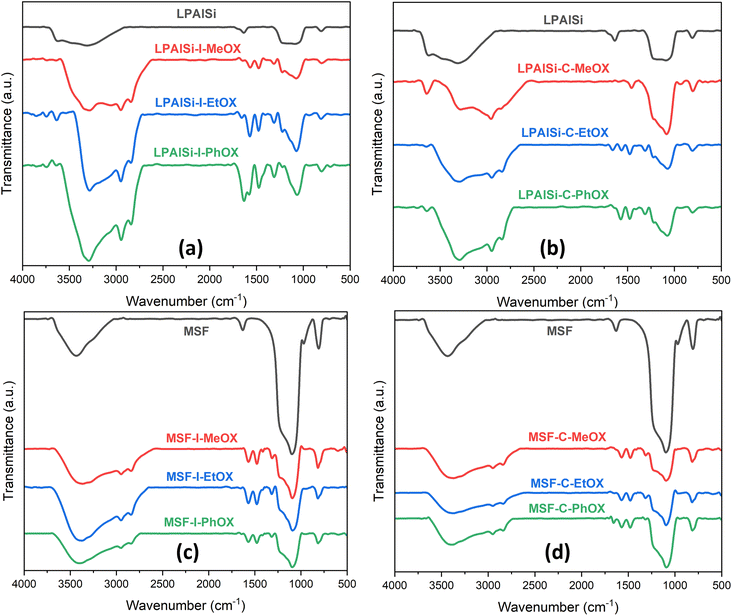
The FTIR spectra, as shown in Fig. 3, for both supports (LPAlSi and MSF) exhibit characteristic peaks typical of silica-based materials, including the asymmetric stretching of Si–O–Si at 1095 cm−1 and the symmetric stretching of the same functional group at 808 cm−1. In Fig. 3, it is evident that all final sorbents, irrespective of the support, initiator, or monomer used, exhibited PEI chemically tethered structure to the support after undergoing the necessary washing steps and the final harsh hydrolysis reaction. This is corroborated by the presence of characteristic peaks, including N–H2 vibration (1553 cm−1), N–H bending vibration (1650 cm−1), C–H stretching vibration (1470 cm−1 and 2950 cm−1), and C–H2 bending vibration (1410 cm−1 and 2850 cm−1). Other functional groups of PEI were challenging to identify due to overlapping with the support's peak signals, such as N–H stretching vibrations (3430 cm−1), C–N stretching vibrations (1095 cm−1), and C–N stretching (1250–1020 cm−1).17,25,33,43–46
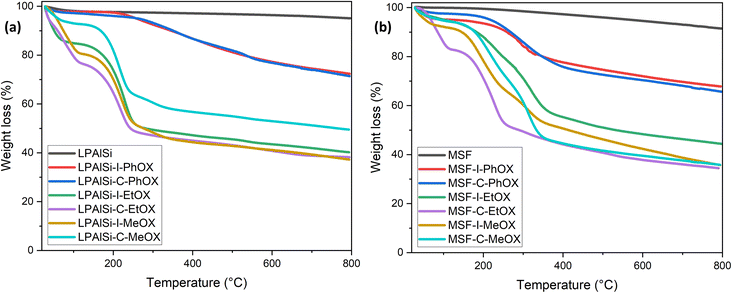
The stability of the materials and the resulting amine loadings, determined based on mass changes, were assessed using TGA thermal decomposition. As seen in Fig. 4a and b, the LPAlSi and MSF supports exhibited remarkable stability against elevated temperatures, with LPAlSi showing minimal weight loss and MSF experiencing a relatively higher loss due to pre-adsorbed water.17 This stability is also an indicator of the complete removal of structuring agents, P123 and CTAB, used during synthesis. Functionalized supports displayed two significant drops in weight during decomposition. The first, occurring at low temperatures, is mainly caused by the moisture and pre-adsorbed gases. The second one, more pronounced, is linked to the amine's decomposition, commencing at 150 °C, as depicted in Fig. 4. It is crucial to note the temperature at which the tethered amines begin to decompose in order to regenerate the sorbent at a lower temperature, thus avoiding a permanent loss of adsorption sites.
As shown in Fig. 4, the initiation temperature for amine decomposition varies based on the initiator (“C” or “I”) and the starting monomer (“MeOX,” “EtOX,” or “PhOX”). These differences are attributed to the variation in the molecular weight of the tethered amines; lower molecular weight corresponds to a lower decomposition temperature. Different supports, initiators, and monomers yield different degrees of polymerization due to the electrophilicity index of “C” and “I” and the confined pore space (pore volume) within the support, as explained previously. Further elevation in temperature results in the complete removal of amines. Table 2 presents the calculated amine loading based on the TGA decomposition weight percentages measured. A comparison of the same initiator and monomer reveals that MSF leads to higher loadings due to its greater pore volume than LPAlSi, as indicated in Table 2. This difference also leads to a shift in decomposition temperature to higher values due to the higher molecular weights of the amines.17,33 The total amine loadings, calculated based on TGA, were corroborated by CHN elemental analysis, with values closely matching. MeOX-based sorbents demonstrated the highest nitrogen content, reaching 13.31 mmol N per g sorbent, one of the highest reported values in the literature,24,47,48 followed by EtOX-based materials and PhOX, as shown in Table 2.
| Sorbent | C | H | N | Total | Organic content% | Amine loadingb |
|---|---|---|---|---|---|---|
| a Calculated based on the difference between 150 °C and 800 °C from TGA. b mmol N per g sorbent. | ||||||
| LPAlSi | 0 | 0.84 | 0.02 | 0.86 | 2.74 ± 0.03 | 0.01 |
| LPAlSi–I–PhOX | 14.02 | 3.77 | 7.65 | 25.43 | 25.93 ± 0.29 | 5.46 |
| LPAlSi–C–PhOX | 14.36 | 3.89 | 7.58 | 25.82 | 26.14 ± 0.33 | 5.41 |
| LPAlSi–I–EtOX | 24.45 | 6.37 | 14.39 | 45.21 | 46.03 ± 0.53 | 10.28 |
| LPAlSi–C–EtOX | 25.66 | 7.33 | 14.98 | 47.96 | 48.81 ± 0.59 | 10.70 |
| LPAlSi–I–MeOX | 27.66 | 7.28 | 15.71 | 50.65 | 51.46 ± 0.61 | 11.22 |
| LPAlSi–C–MeOX | 27.97 | 7.78 | 16.23 | 51.98 | 53.00 ± 0.63 | 11.59 |
| MSF | 0 | 0.34 | 0 | 0.34 | 8.37 ± 0.09 | 0 |
| MSF–I–PhOX | 17.41 | 4.19 | 7.23 | 28.83 | 28.41 ± 0.29 | 5.16 |
| MSF–C–PhOX | 18.09 | 5.04 | 8.84 | 31.97 | 32.45 ± 0.33 | 6.31 |
| MSF–I–EtOX | 28.90 | 7.52 | 14.83 | 51.25 | 52.25 ± 0.53 | 10.59 |
| MSF–C–EtOX | 31.83 | 8.37 | 16.37 | 56.57 | 57.70 ± 0.59 | 11.69 |
| MSF–I–MeOX | 33.20 | 8.89 | 16.93 | 59.01 | 60.11 ± 0.61 | 12.09 |
| MSF–C–MeOX | 33.45 | 8.41 | 18.64 | 60.50 | 61.53 ± 0.63 | 13.31 |
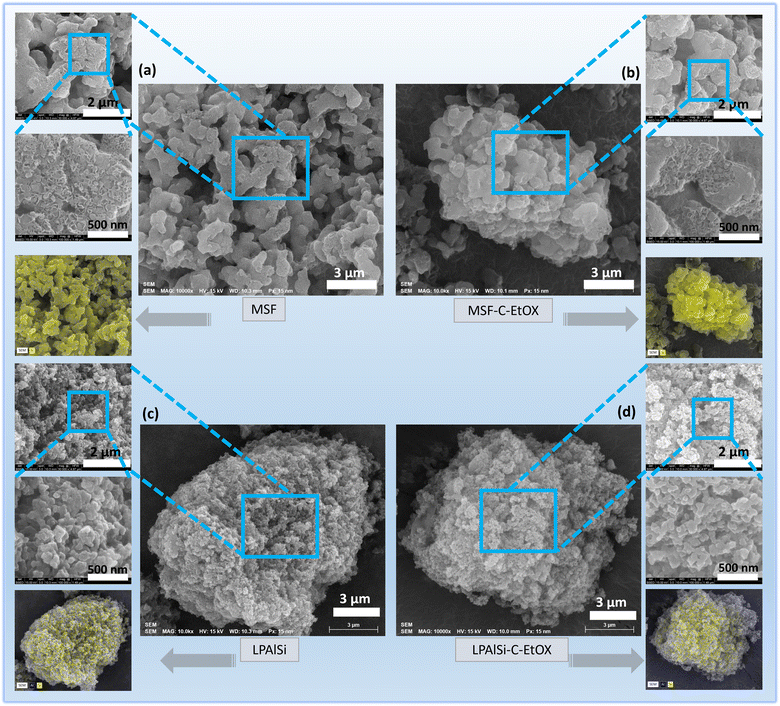
As shown in Fig. 5, the comparison between the surface structures of the supports and final sorbents (MSF–C–EtOX and LPAlSi–C–EtOX are shown as examples) indicates successful functionalization of the support with amines, consistent with the findings of other characterization techniques. However, it is evident that a few areas within the EtOX-based sorbents remain unfunctionalized with amines, a behavior consistent with previous reports following the functionalization of supports.17,25,49,50 The surface of the material was not fully functionalized due to a limited amount of initiators, which were not expected to react with all the available OH groups (see Fig. 12). These initiators are necessary to initiate the in situ polymerization process. Furthermore, this was evidenced by the surface area and porosity results, indicating incomplete filling of the support pores. Furthermore, the elemental mapping images reveal a uniform distribution of elements across the samples, with silicon “Si” detected in MSF-based samples and both silicon “Si” and aluminum “Al” observed in LPAlSi-based samples.
2.2 Effect of adsorption conditions
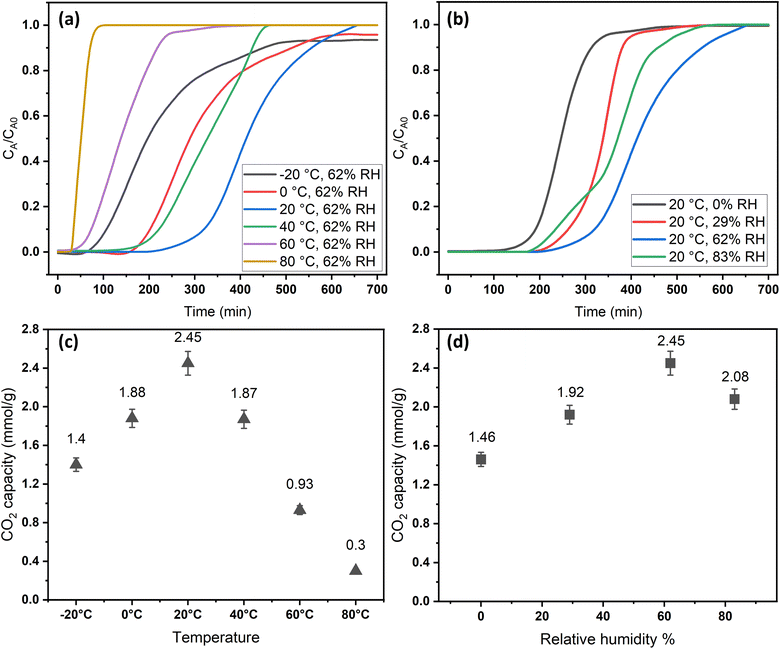
The adsorption temperature is a critical factor that significantly affects CO2 adsorption capacity. To study its impact, the relative humidity was held constant at 62%. Within the specified range (−20–80 °C), the quantity of adsorbed CO2 exhibited a proportional relationship with increasing temperature up to a certain point, as shown in Fig. 6a and c. The adsorption capacity versus temperature showed an optimum point at 20 °C with a CO2 capacity of 2.45 mmol g−1, and then it dropped to 0.3 mmol g−1 at 80 °C. This observation implies that CO2 adsorption for DAC applications under humid conditions is unfavorable at elevated temperatures. Adsorption at sub-ambient temperatures showed significant CO2 uptakes of 1.4 and 1.88 mmol g−1 at −20 and 0 °C, respectively. To the best of our knowledge, the only previously reported values for CO2 uptakes under humid conditions at −20 °C were with amines impregnated into alumina, with 1.80 and 1.88 mmol g−1 on 40 wt% PEI–Al2O3 and 20 wt% TEPA–Al2O3, respectively,27 indicating that our materials are comparable to the impregnated sorbents. However, the same materials adsorption capacities at 25 °C were 2.0 and 1.5 mmol g−1, respectively,27 making the MSF–C–EtOX sorbent in general better due to the chemical bonding of the amine versus impregnation and the improved performance in a wide range of adsorption conditions. In general, temperature has two opposing effects on the adsorption of CO2 in amine-based materials. The first effect reduces the adsorption rate at higher temperatures due to the exothermic nature of the adsorption reaction. Conversely, temperature can enhance adsorption up to an optimum point before it starts to decrease. This is caused by the positive effect of temperature on the adsorption rate, the activated chemisorption effect, and the reduction in diffusion limitations. The diffusion of CO2 is influenced by the increased kinetic energy of CO2 molecules entering the pores of the support, as well as the increased flexibility of the long amine chains at higher temperatures. This results in more available adsorption sites within the support's pores.17,33,51–55The presence of moisture is a critical factor that must be carefully considered in the design of practical DAC sorbents and the selection of DAC plant locations, as atmospheric moisture is inevitable. Consequently, the CO2 adsorption performance of MSF–C–EtOX was evaluated at various relative humidities (0–83%) while maintaining a constant temperature of 20 °C. As depicted in Fig. 6b and d, compared to dry adsorption conditions (0% RH), the presence of moisture considerably improved the adsorption uptake, increasing from 1.46 to 2.45 mmol g−1 at 62% RH. The availability of moisture in the air can lead to two main positive effects on the adsorption capacity. First and foremost is the alteration of the reaction mechanism between the amino groups and CO2 molecules. Under dry conditions (eqn (1) and (2)), both primary and secondary amines require two amine groups to produce ammonium carbamate from one CO2 molecule. In contrast, in the presence of moisture (eqn (3) and (4)), ammonium bicarbonate is produced, utilizing only one amine group per CO2 molecule.56–58 This theoretically doubles the efficiency compared to the reaction under dry conditions. Several research groups have reported the same behavior, highlighting the improved utilization of amine groups under humid conditions versus dry conditions.51,59–61 The second effect of moisture is that water may facilitate the movement of amine chains, resulting in improved diffusion of CO2 molecules into inner adsorption sites.28 However, an excessive amount of humidity can negatively impact adsorption, as water can block access to adsorption sites by condensing in the pores, as demonstrated by a further increase in RH to 83% (Fig. 6b and d).28,58
| CO2 + 2RNH2 ↔ RNH3+ + RNHCOO− | (1) |
| CO2 + 2R1R2NH ↔ R1R2NH2+ + R1R2NHCOO− | (2) |
| CO2 + RNH2 + H2O ↔ RNH3+HCO3− | (3) |
| CO2 + R1R2NH + H2O ↔ R1R2NH2+HCO3− | (4) |
The breakthrough time and shape were notably influenced by temperature and relative humidity. As depicted in Fig. 6a, the breakthrough time was significantly reduced at higher temperatures due to the increased rate of desorption and a decrease in adsorption capacity. Moreover, at elevated temperatures, the breakthrough curves exhibited sharper profiles compared to lower temperatures, attributed to the positive impact of temperature on the reaction rate, resulting in faster saturation of the sorbent. The effect of relative humidity on the breakthrough time initially showed a positive trend, which then declined at 83%, consistent with the behavior of adsorption capacity, which peaked at 62% before decreasing.
2.3 Adsorption kinetics
Adsorption kinetics is a crucial aspect of sorbents. The kinetics of adsorption and desorption reveal the speed of the CO2 capture process, influenced by various factors, such as the type, branching, and density of the amine, the pore size and volume of the support, boundary layer diffusion, intrinsic chemical reaction rates, and mass transfer in and out of the pores.32,62 Sorbents with rapid kinetics are preferred because they can reduce cycle times, subsequently lowering overall process costs. Several kinetic models are used to calculate the adsorption capacity over time, such as the pseudo-first order (eqn (5)), pseudo-second order (eqn (6)), and Avrami (eqn (7)) models.33,63 The Avrami fractional order kinetic model posits that the rate of CO2 adsorption is directly proportional to the available surface of the sorbent, indicating that the rate of adsorption is directly linked to the quantity of active sites on the adsorbent's surface and not limited by diffusion. This model further suggests that CO2 adsorption follows a nucleation and growth process, where small clusters of CO2 molecules initiate on the adsorbent's surface and subsequently expand into larger clusters until they eventually cover the entire surface.55,64 | (5) |
 | (6) |
 | (7) |
 | (8) |
 | (9) |
 | (10) |

As shown in Fig. S.3 and Table S.1,† neither the pseudo-first-order nor the pseudo-second-order kinetic models were able to fit the experimental data for the adsorption of CO2 onto MSF–C–EtOX under different adsorption conditions. Despite the R2 values indicating a good fit, other factors such as ARE, RSS, the error in equilibrium capacity, and plotting the experimental data against the models showed that these models did not match the experimental data effectively.
On the other hand, the Avrami model showed a good representation of the experimental data under various adsorption conditions, at different temperatures and relative humidities, as shown in Fig. 7a and b. Table 3 reveals that the maximum error in adsorption capacity was around 5.3%, all RSS values were less than 5%, and the R2 values were very close to unity. The Avrami rate constant, kA, represents a complex kinetic constant that encompasses aspects of adsorption kinetics and the distribution of adsorption sites.67 An increase in adsorption temperature at a constant relative humidity led to a general increase in kA except for −20 °C (Table 3), indicating a higher, faster, and easier rate for the sorbent to reach saturation at elevated temperatures. On the other hand the increase in relative humidity resulted in a drop in kA values except at 83%. This behavior was also reported by Shi et al.55 All values of nA fell within the range of 1.14–1.54, indicating a combination of both adsorption mechanisms. This conclusion has also been reported by a few researchers.17,55
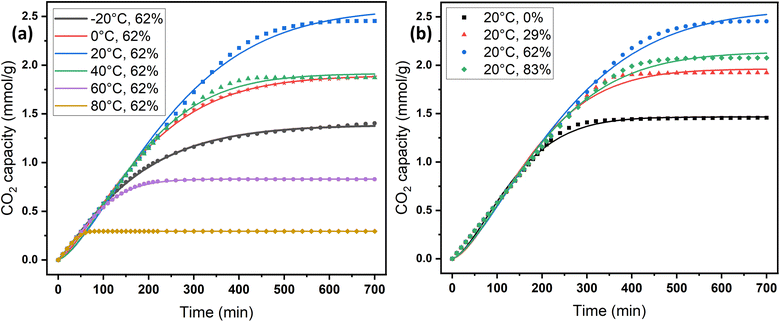 | ||
| Fig. 7 Experimental CO2 adsorption data versus the Avrami kinetics model: (a) at different temperatures and (b) at different relative humidities. | ||
| Adsorption conditions | k A (min−1) | q e | m | R 2 | ARE% | RSS% | q exp | Δqe (%) |
|---|---|---|---|---|---|---|---|---|
| a mmol CO2 per g. b g per mmol CO2 per min. | ||||||||
| 20 °C, 0% RH | 0.0065 | 1.47 | 1.51 | 0.9994 | 5.5 | 2.7 | 1.46 | 0.6 |
| 20 °C, 29% RH | 0.0049 | 1.96 | 1.54 | 0.9989 | 8.0 | 4.9 | 1.92 | 2.1 |
| 20 °C, 62% RH | 0.0036 | 2.58 | 1.43 | 0.9992 | 7.5 | 4.7 | 2.45 | 5.3 |
| 20 °C, 83% RH | 0.0044 | 2.14 | 1.46 | 0.9992 | 7.0 | 4.2 | 2.08 | 3.0 |
| −20 °C, 62% RH | 0.0057 | 1.39 | 1.14 | 0.9999 | 1.4 | 1.1 | 1.40 | 1.1 |
| 0 °C, 62% RH | 0.0048 | 1.89 | 1.35 | 0.9998 | 3.9 | 1.8 | 1.88 | 0.6 |
| 40 °C, 62% RH | 0.0049 | 1.91 | 1.47 | 0.9993 | 6.6 | 3.7 | 1.87 | 2.2 |
| 60 °C, 62% RH | 0.0106 | 0.83 | 1.37 | 0.9999 | 2.0 | 0.7 | 0.83 | 0.3 |
| 80 °C, 62% RH | 0.0319 | 0.30 | 1.52 | 0.9999 | 0.7 | 0.2 | 0.30 | 0.1 |
It's important to mention that the previously discussed adsorption kinetics, as measured in the packed bed flow system, do not represent true adsorption kinetics. Instead, they are a result of a combination of process-related effects, including intrinsic chemical reaction rates and internal mass transfer effects, gas mixing, bypass etc. These findings should be regarded as dependent on experimental conditions and not necessarily transferable to larger scales. Hence, it is not advisable to employ them in the calculation of mass transfer coefficients. Instead, they should be considered as indications of a kinetic pattern, suggesting that, particularly in this simulated packed-bed experiment, the adsorbents demonstrate Fickian transport characteristics, and diffusion might be characterized using a partial immobilization model. Nevertheless, a thorough quantitative kinetic assessment will necessitate further experimental investigations.11,68,69
2.4 Activation energy and thermodynamics
Typically, in addition to exceptional adsorption capacity and kinetics, favorable thermodynamic performance is a critical factor when evaluating the practical utility of adsorbents in industrial applications. The activation energy of adsorbents serves as a valuable indicator of the difficulty associated with adsorption and desorption processes, thus playing a significant role in assessing the industrial feasibility of these adsorbents.70Activation energy, denoted as Ea, represents the energy required for a molecule to transition from an inert state to an active state where chemical reactions readily occur, and its magnitude reflects the complexity of CO2 capture on a certain sorbent. The Arrhenius equation can be employed to determine Ea:I
 | (11) |
The Arrhenius equation exhibited an outstanding fit, achieving an R2 value of 0.9925. The activation energy for CO2 adsorption at a relative humidity of 62% was determined to be 47.2 kJ mol−1, while the pre-exponential factor was found to be A = 3.08 × 10⁵. Notably, this activation energy closely aligns with our prior study on CO2 adsorption in a long chain of polymers, where we obtained a value of 40.0 kJ mol−1 at 25% RH.17
The thermodynamics of CO2 adsorption onto MSF–C–EtOX were studied by solving the Van't Hoff equation (eqn (12)) and the Gibbs free energy equation (eqn (13)).
 | (12) |
| ΔG° = ΔH° − TΔS°I | (13) |
The Van't Hoff equation provided an excellent fit for the experimental data, with an R2 value of 0.9746. The standard enthalpy was calculated to be −21.3 kJ mol−1 (Table 4). Negative numbers of the standard enthalpy change represent the exothermicity of adsorption.71 Increasing with temperature and positive standard Gibbs free energy values suggest that adsorption becomes less favorable at higher temperatures which is expected.72
| T (°C) | ΔG° (kJ mol−1) | ΔH° (kJ mol−1) | ΔS° (J mol−1 K) |
|---|---|---|---|
| 20 | 19.0 | −21.3 | −64.8 |
| 40 | 20.3 | ||
| 60 | 21.6 | ||
| 80 | 22.9 |
2.5 Adsorption isotherms and selectivity
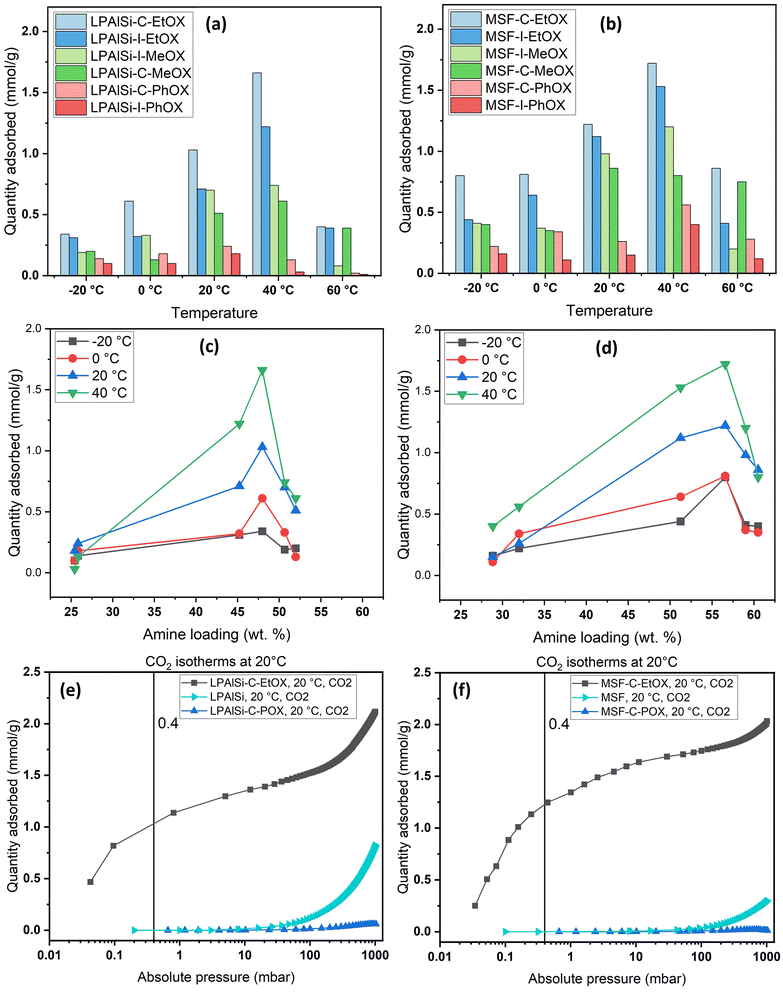
Volumetric single-component adsorption isotherms for CO2 or N2 provide an alternative approach to assess sorbent performance under various partial pressures. These isotherms yield essential physical parameters, including selectivity, Henry's law constants, and heat of adsorption.68Fig. 8 displays CO2 adsorption isotherms over a temperature range of −20 to 60 °C for both pristine and functionalized supports, particularly in the low-pressure region (less than 10 mbar), which is crucial for direct air capture (DAC) applications. Both the MSF and LPAlSi supports exhibited minimal CO2 uptakes, consistent with prior studies.17,33,39 Notably, significant increases in CO2 uptakes were observed following successful support functionalization, indicating the attachment of primary and secondary amines to the supports due to the reaction mechanism with CO2 in the absence of humidity.
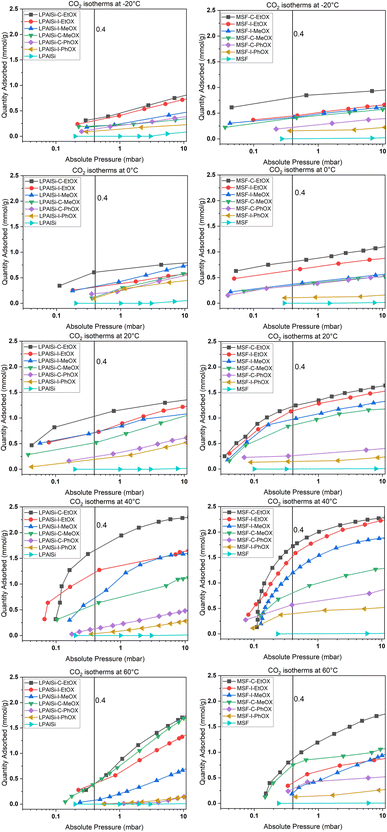 | ||
| Fig. 8 Experimental adsorption isotherms for CO2 over the supports and the sorbents at different temperatures. | ||
Fig. 8 and 9 clearly demonstrate that MSF-based sorbents outperformed LPAlSI-based sorbents in terms of CO2 uptakes, primarily due to their higher amine loadings, as previously discussed in the TGA decomposition curves and CHN elemental analysis. The higher pore volume of MSF allowed for greater amine accommodation, consistent with findings by other researchers.73–75
As previously explained, temperature has two opposing effects on CO2 uptakes, significantly influenced by the CO2 concentration, amine loading, amine chain length, and moisture availability. Similar to humid conditions, where CO2 uptake went through a maximum versus temperature, dry conditions had the same behavior but at a different temperature. Here, CO2 uptakes initially increased and reached a maximum around 40 °C before declining, as seen in Fig. 9a and b. This divergence in behavior aligns with our earlier research,17 where we explored adsorption at different temperatures under both dry and humid conditions, highlighting a substantial difference in activation energy (Ea). Specifically, Ea was 65.0 kJ mol−1 for dry adsorption and 40.0 kJ mol−1 for humid adsorption.17 In other words, under dry conditions, a higher energy barrier needs to be overcome for adsorption to occur. This energy barrier is further enhanced at higher temperatures, eventually reaching a point where the desorption rate exceeds the adsorption rate due to the exothermic nature of the process.33
The effect of the initiator (“C” or “I”) and monomer (“MeOX,” “EtOX,” or “PhOX”) on adsorption performance could be directly linked to the corresponding amine loadings. Generally, increased amine loading led to higher CO2 uptakes, as it provided more amine sites for CO2 adsorption. However, beyond a certain loading point, excessive amine loading resulted in pore blockage, leading to reduced CO2 uptakes. Fig. 9c and d display CO2 uptakes as a function of amine loadings based on CHN elemental analysis. For the LPAlSi-based sorbent, the optimal loading was approximately 48 wt% (LPAlSi–C–EtOX), while the MSF-based sorbent performed best at around 57 wt% (MSF–C–EtOX). The higher amine loading for the MSF support can be attributed to its larger pore volume in comparison to LPAlSi. This phenomenon is consistent with the effect of amine loadings on adsorption capacity, which has been extensively studied within the impregnated-amine-based sorbents due to their simple preparation.11,76–80
It is worth mentioning that before the final step of sorbent synthesis, which involved acid hydrolysis (as shown in Fig. 12), polyoxazolines were tethered to the supports. These polyoxazolines had tertiary amines, which do not react with CO2 under dry conditions, and side chains of amides. CO2 adsorption isotherm experiments were conducted, as seen in Fig. 9c and d. The materials without HCl hydrolysis (LPAlSi–C–POX and MSF–C–POX) did not adsorb any CO2, unlike the final sorbents. This confirms the success of the hydrolysis step in removing the amide side groups and creating primary and secondary amines, which play a significant role in CO2 adsorption. The pure supports exhibited higher CO2 uptakes at elevated pressures compared to the unhydrolyzed materials. This can be attributed to the high surface area, with LPAlSi having a larger surface area than MSF, and the surface condensation of CO2 (physisorption). Another potential explanation might involve the formation of non-covalent complexes between CO2 molecules and the –OH groups present on the surface of the support.81
Adsorption isotherm modeling is a crucial facet of adsorption research because it enables the mathematical interpretation of experimental data. This representation is valuable for determining the sorbent CO2 capacity under varying conditions. Identifying the best model for experimental data is of paramount importance in order to enhance the efficiency of the adsorption process's design.82 The experimental results for MSF–C–EtOX and LPAlSi–C–EtOX, the best performing sorbent for each support as an example, were fitted with three models: Freundlich (eqn (14)), Langmuir (eqn (15)), and Langmuir dual site (LDS, eqn (16)). The detailed description and theories behind every model are given else were.63,72,83
 | (14) |
 | (15) |
 | (16) |
| Parameter | Temperature | ||||
|---|---|---|---|---|---|
| −20 °C | 0 °C | 20 °C | 40 °C | 60 °C | |
| MSF–C–EtOX | |||||
| n A | 0.99 | 1.03 | 1.60 | 2.31 | 1.84 |
| b A | 20.02 | 19.98 | 8.93 | 6.53 | 1.80 |
| n B | 0.72 | 0.53 | 0.54 | 0.39 | 0.46 |
| b B | 8.66 × 10⁻⁴ | 3.87 × 10⁻³ | 2.30 × 10⁻³ | 2.78 × 10⁻³ | 1.57 × 10⁻³ |
| RSS% | 1.6 | 3.9 | 3.8 | 2.9 | 4.4 |
| ARE% | 0.6 | 2.7 | 2.6 | 1.0 | 4.3 |
![[thin space (1/6-em)]](https://www.rsc.org/images/entities/char_2009.gif) |
|||||
| LPAlSi–C–EtOX | |||||
| n A | 1.06 | 0.84 | 1.40 | 2.30 | 1.93 |
| b A | 0.50 | 6.19 | 10.01 | 7.03 | 0.70 |
| n B | 3.09 | 1.06 | 2.18 | 0.56 | 0.73 |
| b B | 4.53 × 10⁻⁴ | 5.81 × 10⁻⁴ | 4.80 × 10⁻⁴ | 2.72 × 10⁻³ | 7.95 × 10⁻³ |
| RSS% | 4.0 | 1.9 | 2.0 | 2.6 | 2.5 |
| ARE% | 2.8 | 1.4 | 0.7 | 0.9 | 1.7 |
The Langmuir model was unable to accurately represent the isotherms, resulting in RSS values ranging between 8.7% and 13.1% for MSF–C–EtOX and 11.6% to 20.2% for LPAlSi–C–EtOX. A similar trend was observed for the ARE, as shown in Table S.2.† A better agreement with experimental data was noticed with the use of the Freundlich model at lower temperatures. However, as the temperature increased, there was a significant increase in the RSS, reaching 20.8% at 60 °C for MSF–C–EtOX. LDS modeling parameters are presented in Table 5. As indicated in the table, the LDS model provided the best representation of the CO2 adsorption isotherms with the lowest RSS and ARE. This outstanding agreement with the experimental data could be attributed to the model's ability to describe adsorption at two distinct sites, represented by nA and nB.66 These sites can represent the adsorption at the primary (NH3) and secondary amines (NH2).17
Due to the ultra-low concentration of CO2 in the atmosphere, the selectivity of sorbents toward CO2 is one of the most crucial characteristics when determining the suitability of a sorbent for large-scale use. As an example, N2 and CO2 adsorption isotherms were obtained at 20 °C for the supports, MSF and LPAlSi, as well as for the final sorbents, MSF–C–EtOX and LPAlSi–C–EtOX.
As shown in Fig. 10, the sorbent exhibited a significant preference for adsorbing CO2 over N2, especially at low pressures. The notable selectivity arises from the robust chemical reaction between the amines present in the sorbent and CO2. To quantify the selectivity, the adsorption capacity of CO2 at 0.4 mbar was compared to the N2 adsorption capacity at approximately 1013 mbar, representing a similar concentration of CO2 while neglecting the presence of oxygen. Both LPAlSi–C–EtOX and MSF–C–EtOX demonstrated remarkably high selectivities for CO2, with values of 393 and 266, respectively. Functionalized amine sorbents are widely recognized for their selectivity for CO2 over N2 and O2 in numerous publications.33,84,85
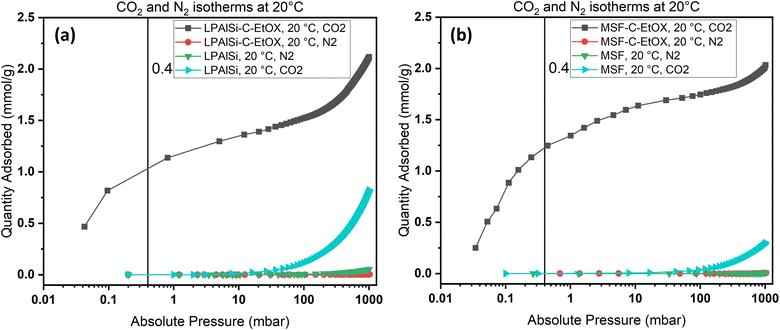 | ||
| Fig. 10 N2 and CO2 adsorption isotherms for (a) LPAlSi and LPAlSi–C–EtOX and (b) MSF and MSF–C–EtOX at various equilibrium adsorption pressures at 20 °C. | ||
While oxygen is a significant component of the air, our equipment did not allow us to study the selectivity of the sorbents for oxygen. However, a study by Belmabkhout et al.59 demonstrated that the adsorption of oxygen onto amine-functionalized silica was very similar to that of nitrogen. Therefore, we can reasonably conclude that the sorbents reported in this study will exhibit good selectivity for CO2 compared to other gases present in the air, namely nitrogen and oxygen.
2.6 Adsorption long-term cyclic stability
The long-term cyclic stability of sorbents and catalysts is a crucial factor in evaluating materials for industrial applications.70 To assess the performance of the designed sorbents, cyclic tests were conducted under both humid and dry conditions using a simple temperature swing adsorption (TSA) approach. Dry adsorption–desorption experiments were performed using TGA for the convenience of automated operation, enabling 50 cycles at 0% RH and a 30 °C adsorption temperature. In contrast, humid adsorption–desorption cyclic testing was conducted in the breakthrough setup, allowing up to 10 cycles, due to the manual operation mode. Under both conditions, the sorbent, MSF–C–EtOX, demonstrated highly stable adsorption capacity with minor fluctuations, as depicted in Fig. 11a and b. Notably, the adsorption capacity under humid conditions exhibited relatively higher fluctuations, mainly due to differences in equipment design, operation mode, and calculation methods, hence the resulting percentage error.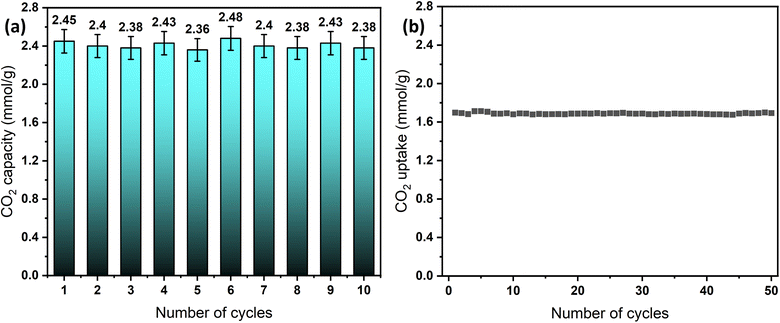 | ||
| Fig. 11 Long-term cycling stability of MSF–C–EtOX, (a) breakthrough results at 20 °C and 62% RH and (b) TGA results at 30 °C and 0% RH. | ||
The sustained cycling stability is credited to the chemical bonding of the amines to the support. This stability is maintained even at elevated regeneration temperatures, such as 100 °C, as noticed from the TGA decomposition graphs, which indicated that amine thermal decomposition begins at temperatures exceeding 200 °C.
Table 6 summarizes the adsorption performance of MSF–C–EtOX in comparison to that of reported materials. The CO2 uptakes of the synthesized sorbent not only exceeded the reported values in the same class of materials (in situ polymerization) and the grafted class but also equaled the value of impregnated PEI, which is 2.44 mmol CO2 per g sorbent into fumed silica.79
| Support | Monomer/amine | CO2 (ppm) | Tem. (°C) | RH (%) | Adsorption capacitya | Amine loadingb | Amine efficiencyc | Amine typesd | Method | Ref. |
|---|---|---|---|---|---|---|---|---|---|---|
| a mmol CO2 per g. b mmol N per g. c mmol CO2 per mmol N. d 1°: primary, 2°: secondary: 3°: tertiary. e Fully humid. | ||||||||||
| MSF | 2-Ethyl-2-oxazoline | 400 | 20 °C | 62 | 2.45 | 11.69 | 0.21 | 1°, 2° | Fixed bed | Current work |
| MSF | 2-Ethyl-2-oxazoline | 400 | −20 °C | 62 | 1.40 | 11.69 | 0.12 | 1°, 2° | Fixed bed | Current work |
| MSF | 2-Methyl-2-oxazoline | 400 | 25 °C | 65 | 1.50 | 9.52 | 0.16 | 1°, 2° | Fixed bed | 17 |
| SBA-15 | Lysine | 400 | 25 °C | 0 | 0.6 | 5.18 | 0.12 | 1°, 2° | TGA | 86 |
| SBA-15 | Aziridine | 400 | 25 °C | 1.72 | 9.90 | 0.17 | 1°, 2°, 3° | Fixed bed | 32 | |
| PE-MCM-41 | Grafted [2-(3-trimethoxysilylpropylamino)ethylamino]ethylamine | 400 | 25 °C | 0 | 0.98 | 7.90 | 0.12 | 1°, 2° | TGA | 59 |
| Silica gel | Grafted [N-(2-aminoethyl)-3-aminopropyl]trimethoxysilane | 400–440 | 25 °C | 40 | 0.44 | 2.48 | 0.18 | 1°, 2° | TGA | 87 |
| SBA-15 | Grafted N1-(3-trimethoxysilylpropyl)-diethylenetriamine | 415 | 25 °C | 60 | 1.10 | 5.12 | 0.21 | 1°, 2° | TGA | 88 |
| Nanofibrillated cellulose | Grafted 3-(2-aminoethylamino)propyl-dimethoxymethylsilane | 506 | 25 °C | 0 | 1.39 | 4.9 | 0.28 | 1°, 2° | Fixed bed | 89 |
| SBA-15 | Grafted 10% N1-(3-trimethoxysilylpropyl)diethylenetriamine | 400 | 25 °C | 0 | 0.64 | 5.7 | 0.11 | 1°, 2° | TGA | 90 |
| Fumed silica | 50% impregnated PEI (800) | 400 | 25 °C | 0 | 2.44 | — | — | 1°, 2°, 3° | TGA | 79 |
| MMOs | 67% impregnated PEI (800) | 400 | 25 °C | 0 | 2.27 | — | — | 1°, 2°, 3° | TGA | 91 |
| MIL-101 | 50% impregnated PEI (800) | 400 | −20 °C | 0 | 1.64 | 12.6 | 0.13 | 1°, 2°, 3° | Volumetric | 11 |
| MIL-101 | 50% impregnated PEI (800) | 400 | 25 °C | 0 | 1.81 | 12.9 | 0.14 | 1°, 2°, 3° | Volumetric | 11 |
| MIL-101 | 50% impregnated TEPA | 400 | −20 °C | 0 | 1.26 | 12.6 | 0.10 | 1°, 2° | Volumetric | 11 |
| MIL-101 | 50% impregnated TEPA | 400 | 25 °C | 0 | 2.14 | 12.9 | 0.16 | 1°, 2° | Volumetric | 11 |
| γ-Al2O3 | 20% impregnated TEPA | 400 | −20 °C | 70 | 1.88 | 11.4 | 0.31 | 1°, 2° | Fixed bed | 27 |
| γ-Al2O3 | 20% impregnated TEPA | 400 | 25 °C | 70 | 1.50 | 11.4 | 0.31 | 1°, 2° | Fixed bed | 27 |
| γ-Al2O3 | 40% impregnated PEI | 400 | −20 °C | 70 | 1.80 | 14.3 | 0.31 | 1°, 2°, 3° | Fixed bed | 27 |
| γ-Al2O3 | 40% impregnated PEI | 400 | 25 °C | 70 | 2.00 | 14.3 | 0.31 | 1°, 2°, 3° | Fixed bed | 27 |
| MIL-101(Cr)/CA fibers | 39% impregnated TEPA | 400 | −20 °C | 70 | 0.70 | 6.33 | 0.11 | 1°, 2° | Fixed bed | 35 |
| MIL-101(Cr)/CA fibers | 36% impregnated PEI | 400 | −20 °C | 70 | 0.99 | 5.23 | 0.19 | 1°, 2°, 3° | Fixed bed | 35 |
3. Experimental
3.1 Materials
Pluronic® P-123, sodium metasilicate (Na2SiO3), ammonium fluoride (NH4F, ≥98.0%), sodium aluminate (anhydrous, NaAlO2), hexadecyltrimethylammonium bromide (CTAB, ≥98%), mesitylene (98%), tetramethylammonium hydroxide solution (TMAOH, ∼40% in H2O (∼1.5 M), N,N-dimethylhexadecylamine (DMHA, ≥95%), 2-ethyl-2-oxazoline (EtOX, ≥99%), 2-methyl-2-oxazoline (MeOX, 98%), 2-phenyl-2-oxazoline (PhOX, 99%), 3-iodopropyltrimethoxysilane (IPTMS, ≥95.0%, 3-chloropropyltrimethoxysilane (CPTMS, ≥97.0%), sodium hydroxide (≥97.0%, pellets), hydrochloric acid (HCl, 37%), acetone (≥99.5%), diethyl ether (≥99.0%), benzonitrile (anhydrous, ≥99%), and xylenes (≥98.5% xylenes) were purchased from Sigma Aldrich. Fumed silica (Cab-O-Sil M-5, scintillation grade) was purchased from Fisher. All chemicals were used as received.3.2 Materials synthesis
Mesoporous silica foam (MSF), one of the supports used in this study, was synthesized using a slightly different procedure from that in our previously published work.17 To summarize the synthesis process, 10.10 g of P123 was dissolved in 180 ml of 1.6 M HCl in a 1.0 l round-bottom flask. Subsequently, 0.21 g of NH4F and 13.33 g of mesitylene were added. In another beaker, 10.41 g of sodium metasilicate was dissolved in 135.67 g of distilled water. Both solutions were heated to 47 °C. After 30 minutes of stirring, the contents of the first beaker were added to the round-bottom flask and stirred for an additional 10 minutes. Subsequently, the flask was left unstirred under reflux for 24 hours before transferring the contents to a PTFE autoclave, which was then placed in an oven at 100 °C for another 24 hours. The synthesis was completed by filtration, air drying, and calcination for 6 hours at 580 °C.Large-pore AlMCM-41 aluminosilicate (LPAlSi) was synthesized following the procedure published by Ziaei-Azad et al..92 In brief, 1.25 g of CAB-O-Sil was added to a beaker containing a solution of 15.6 g of TMAOH and 34.6 g of distilled water. In another beaker, 15 g of CTAB was dissolved in 125 g of distilled water along with 5.0 g of ammonia. After one hour of mixing, the desired amount of NaAlO2 was added (1.14 g for a 15 Si/Al molar ratio). Subsequently, 11.25 g of CAB-O-Sil was slowly introduced to the mixture and stirred for 30 minutes. Then, 11.25 g of DMHA was added as a pore-expanding agent, and the mixture was stirred for an additional 30 minutes. The resulting mixture was transferred to a PTFE autoclave and placed in a preheated oven at 70 °C for 72 hours. Finally, the material was filtered, air-dried, and calcined for 6 hours at 580 °C.
The supports were functionalized with IPTMS or CPTMS to act as an initiator for the in situ polymerization of MeOX, EtOX, and PhOX.17 To do this, 2.0 grams of the dried support were mixed with 3.0 grams of the initiator (IPTMS or CPTMS) in 50 ml of xylenes. The mixture was kept under stirring at room temperature for one hour under a nitrogen atmosphere, and then the temperature was raised to 90 °C, where it was maintained for 24 hours. Subsequently, 0.10 ml of distilled water was added, and the mixture was left for an additional 24 hours. The resulting material was filtered, washed with xylene and diethyl ether, and then dried in a vacuum oven at 80 °C.
The cationic ring-opening polymerization (CROP) of EtOX, MeOX, and PhOX to produce poly(2-ethyl-2-oxazoline), poly(2-methyl-2-oxazoline), and poly(2-phenyl-2-oxazoline), respectively, was conducted as follows.17 Initially, 5.0 grams of the monomer (MeOX, EtOX, or PhOX) were mixed with 0.5 grams of the dried functionalized support and 10.0 grams of benzonitrile at room temperature under a nitrogen atmosphere for one hour. Subsequently, the temperature of the mixture was increased to 90 °C and maintained for 48 hours or until the material solidified. The solid material was then dispersed in 50 ml of distilled water, followed by filtration and washing with water and acetone.
To hydrolyze poly(2-ethyl-2-oxazoline), poly(2-methyl-2-oxazoline), and poly(2-phenyl-2-oxazoline) in order to remove the amide functional groups and obtain linear polyethylenimine (LPEI), the materials were mixed with 5 M HCl and heated under reflux for 24 hours at 90 °C. This was followed by filtration, redispersion in 50 ml of distilled water, adjusting the pH to 10 with 1 M NaOH, another round of filtration, washing with acetone, and final drying in a vacuum oven at 40 °C. Fig. 12 illustrates a schematic diagram of the functionalization process starting with LPAlSi as the support.
3.3 Characterization
Various techniques and machines were used to characterize the synthesized materials. Porosimetry analysis was conducted using an ASAP 2020 analyzer from the USA, which utilized nitrogen adsorption isotherms at −195.8 °C. Approximately 100 mg of the material was degassed in stages under vacuum, with the first stage held at 40 °C for one hour, followed by a gradual temperature increase (2 °C min−1) to 130 °C for the supports and 100 °C for the sorbents for 6 hours. Subsequently, the sample tube was placed at the analysis port, and different amounts of N2 were dosed, allowing the sample to reach equilibrium at each partial pressure. The surface area was calculated based on the linear section of the BET equation within the 0.05 to 0.25 relative pressure range. Pore size and pore volume were determined using the BJH (Barrett, Joyner, Halenda) method. Furthermore, the stability of the supports and the decomposition of the sorbent to determine the organic content were tested using a thermogravimetric analyzer (TGA) 8000 from PerkinElmer, USA. In each run, approximately 10 mg of the material was placed in a ceramic crucible and heated to 800 °C under nitrogen, with a heating rate of 5 °C min−1. Organic elemental CHN content of the materials was measured using a Unicube CHNS elemental analyzer. In a typical analysis, approximately 2 mg of the materials were combusted in nitrogen. To gain insight into the available functional groups, the FTIR spectrum between 400 and 4000 cm−1 of the materials was recorded using a Spectrum Two FTIR spectrometer from PerkinElmer, USA. This was achieved by grinding the sample with KBr. Bulk chemical analysis of powdered samples was performed using a Bruker S2 PUMA ED-X-ray fluorescence spectrometer, USA, equipped with an Ag X-ray source and He-assist for quantitative light element analysis. Lastly, the morphology and surface structure of the prepared materials were examined using a scanning electron microscope (SEM) Quanta FEG 250, which was equipped with an EDX analyzer for elemental mapping, manufactured by the FEI Company in the USA.3.4 Adsorption measurements
The gravimetric absorption of CO2 under dry conditions was assessed using a TGA 8000 at a concentration of 400 ppm. This test aimed to simulate 50 cycles of adsorption/desorption stability due to the easier automotive operation compared to the manual breakthrough set-up. In a typical experiment, approximately 10 mg of the sorbent was loaded into a ceramic crucible, followed by degassing at 100 °C under nitrogen to remove any solvents or pre-adsorbed gases. Subsequently, the temperature was lowered to the desired adsorption temperature (30 °C), and equilibrium was established with nitrogen for 20 minutes before switching the gas to 80 ml min−1 of 400 ppm CO2 for four hours. The CO2 uptake by TGA can be calculated as: | (17) |
Volumetric CO2 and N2 isotherms were measured using a TriStar II Plus analyzer. After repeating the same degassing step conducted for porosity analysis, the sample was exposed to a specific amount of gas (CO2 or N2) and allowed to reach equilibrium. This process was repeated at various pressures, ranging from 0.04 mbar to 1000 mbar.17
Breakthrough adsorption experiments were conducted with varying humidity and temperatures using our in-house-built laboratory setup, as depicted in Fig. 13. About 0.1 g of the degassed sample was placed between glass wool layers in a double-pipe glass column with dimensions of 5.5 inches in length and a 0.5 inch internal diameter. The experiment began by performing a leak test by monitoring the pressure gauge after the system was pressurized with helium. Once the leak check was successfully completed, the mass spectrometer, Cirrus 2 from MKS Instruments, Inc. was calibrated via the bypass line. Next, adsorption conditions were set by adjusting the temperature of an oil bath circulating oil on the shell side of the adsorber and the relative humidity was adjusted by controlling the gas flowrate through a bubbler and the bypass line connected to the bubbler. A SensorPush HT1 was used to record the relative humidity while the bed temperature was recorded using a wireless sensor. The sample was then equilibrated with a nitrogen flow of 80 ml min−1 for 30 minutes, with flow rates regulated by mass flow controllers (MFCs). Subsequently, the gas was changed to 400 ppm of CO2, balanced with nitrogen. To regenerate the sorbent, the oil bath set point was raised to 100 °C and held there for 30 minutes under a nitrogen atmosphere.
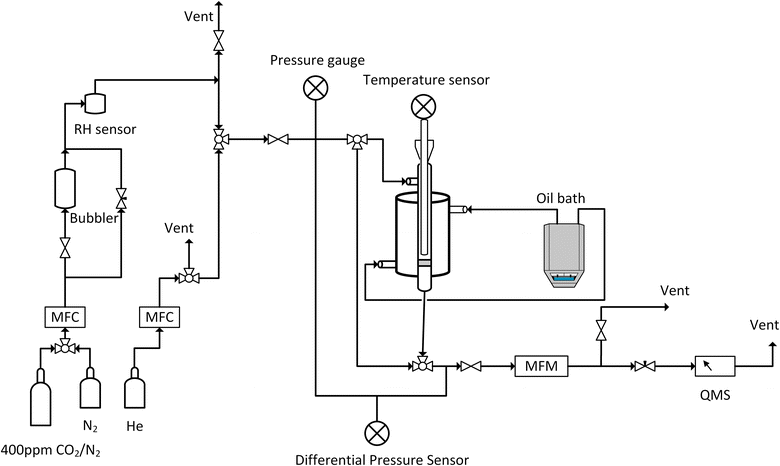 | ||
| Fig. 13 Schematic of the breakthrough setup, RH: relative humidity, MFC: mass flow controller, MFM: mass flow meter, and QMS: quadrupole mass spectrometer. | ||
The CO2 uptake can be calculated using a mass balance approach, which involves determining the accumulation term:
| nacc = nin − nout | (18) |
 | (19) |
4. Conclusions
In this research, we achieved different amine loadings by employing various initiators and monomers in the in situ cationic ring-opening polymerization of 2-oxazolines onto two distinct supports, MSF and LPAlSi. We evaluated the CO2 capture performance of these custom-made sorbents across a wide range of adsorption conditions, spanning temperatures from −20 °C to 60 °C and relative humidity (RH) levels from 0% to 83%, which accurately represent a realistic direct air capture (DAC) concept. CO2 uptake followed a specific trend based on the amine loadings. The higher the amine content, the greater the CO2 uptake, up to a certain point. Beyond this point, any additional increase in amine loadings resulted in a decline in CO2 uptakes. Several factors affected the amine loadings:The pore volume and pore size of the supports: MSF, with a pore volume of 2.93 cm3 g−1 and a pore size of 30 nm, exhibited higher loadings compared to the LPAlSI support, which had a pore volume of 2.13 cm3 g−1 and a pore size of 9 nm.
The choice of initiator: samples with CPTMS displayed higher loadings due to the greater degree of polymerization caused by the higher electrophilicity index of chlorine compared to iodine in IPTMS.
The size and branching of the monomer: increased branching led to less polymerization due to diffusion limitations and confined space within the pores of the supports, as well as the size of the amide side chain, which is cleaved during hydrolysis.
Taking these factors into account, the MSF–C–EtOX sorbent exhibited the highest CO2 uptakes among the other sorbents. The temperature's effect on adsorption was significant, resulting in an increase in CO2 uptake up to a certain temperature, after which it began to decrease. Under dry conditions, the volumetric CO2 uptakes were highest at 40 °C, with MSF–C–EtOX reaching 1.72 mmol g−1 at 0.4 mbar. Conversely, the presence of moisture affected the reaction mechanism, resulting in a different optimum adsorption temperature of 20 °C and a CO2 uptake of 2.45 mmol g−1 with significant uptakes at 0 and −20 °C of 1.88 and 1.40 mmol g−1, respectively. Relative humidity displayed a similar behavior, with CO2 uptakes enhanced up to an optimum adsorption relative humidity of 62%, after which they declined due to pore blockage by water molecules. The Avrami kinetic model and Langmuir dual site adsorption isotherm proved to be the best models for representing the experimental data under different adsorption conditions, with the lowest residual sum of squares (RSS%) and average relative error (ARE%) values and R2 values close to unity. Finally, due to the chemical bonding between the amines and the supports, the sorbent exhibited excellent stability during long-term cyclic operation, with 50 cycles under dry conditions and 10 cycles under humid conditions showing only minor fluctuations. These results indicate that in situ polymerized amines within silica and silica-alumina have high potential as DAC sorbents across a broad range of adsorption conditions that represent atmospheric conditions worldwide. While further investigation is required to optimize the sorbents and their shaping, rather than using them in powder form, to make them more industrially viable, these findings contribute to expanding the scope of DAC operating conditions, which is crucial for negative emission technologies.
Author contributions
Akram A. Al-Absi: conceptualization, investigation, visualization, formal analysis, and writing – original draft; Anne M. Benneker: supervision, funding acquisition, and writing – review and editing; Nader Mahinpey: conceptualization, supervision, funding acquisition, resources, project administration, and writing – review and editing.Conflicts of interest
There are no conflicts to declare.Acknowledgements
This research was undertaken thanks in part to funding from the Canada First Research Excellence Fund. We express our gratitude to Dr Christopher DeBuhr and Dr Robert Marr for their assistance with SEM and XRF characterization. Furthermore, we extend our sincere appreciation to Dr Nicholas Wilkins and Dr Mohanned Mohamedali for their guidance, help, and support during the design and construction of the breakthrough set-up.References
- H.-O. Pörtner, D. C. Roberts, E. S. Poloczanska, K. Mintenbeck, M. Tignor, A. Alegría, M. Craig, S. Langsdorf, S. Löschke and V. Möller, Summary for policymakers, in Climate Change 2022: Impacts, Adaptation and Vulnerability, Contribution of Working Group II to the Sixth Assessment Report of the Intergovernmental Panel on Climate Change, Cambridge University Press, 2022 Search PubMed.
- X. Shi, H. Xiao, H. Azarabadi, J. Song, X. Wu, X. Chen and K. S. Lackner, Angew. Chem., Int. Ed., 2020, 59, 6984–7006 CrossRef CAS PubMed.
- NASA, Carbon Dioxide, https://climate.nasa.gov/vital-signs/carbon-dioxide/, accessed 2024.03.27 Search PubMed.
- H. Ritchie, M. Roser and P. Rosado, Our World in Data Search PubMed.
- M. Fleurbaey, S. Kartha, S. Bolwig, Y. L. Chee, Y. Chen and E. Corbera, Sustainable development and equity, in Climate Change 2014: Mitigation of Climate Change, IPCC Working Group III Contribution to AR5, Cambridge University Press, 2014 Search PubMed.
- N. S. Wilkins, Characterizing Adsorbents for Pre-and Post-Combustion Carbon Capture, Masters thesis, University of Alberta, 2017.
- C. B. Field, V. R. Barros, K. J. Mach, M. D. Mastrandrea, R. A. van Aalst, W. N. Adger, D. J. Arent, J. Barnett and R. A. Betts, Technical summary, in Climate Change 2014: Impacts, Adaptation, and Vulnerability, Part A: Global and Sectoral Aspects, Contribution of Working Group II to the Fifth Assessment Report of the Intergovernmental Panel on Climate Change, Cambridge University Press, 2014 Search PubMed.
- F. G. Camacho, P. A. L. de Souza, L. D. Virla and N. Mahinpey, Chem. Eng. J., 2023, 471, 144458 CrossRef CAS.
- S. Daneshmand-Jahromi, M. H. Sedghkerdar and N. Mahinpey, Fuel, 2023, 341, 127626 CrossRef CAS.
- S. Daneshmand-Jahromi, M. H. Sedghkerdar and N. Mahinpey, Chem. Eng. J., 2022, 448, 137756 CrossRef CAS.
- G. Rim, F. Kong, M. Song, C. Rosu, P. Priyadarshini, R. P. Lively and C. W. Jones, JACS Au, 2022, 2, 380–393 CrossRef CAS PubMed.
- A. Abdalla, M. Mohamedali and N. Mahinpey, Catal. Today, 2023, 407, 21–51 CrossRef CAS.
- S. Daneshmand-Jahromi, D. Karami and N. Mahinpey, J. Environ. Chem. Eng., 2022, 10, 107204 CrossRef CAS.
- S. Daneshmand-Jahromi, D. Karami and N. Mahinpey, Ind. Eng. Chem. Res., 2021, 60, 8227–8235 CrossRef CAS.
- A. Cherevotan, J. Raj and S. C. Peter, J. Mater. Chem. A, 2021, 9, 27271–27303 RSC.
- R. Shawabkeh, A. Al-Absi, M. Shamlooh, M. Khaled and I. A. Hussein, Emerging Carbon Capture Technologies, 2022, pp. 161–191 Search PubMed.
- A. A. Al-Absi, M. Mohamedali, A. Domin, A. M. Benneker and N. Mahinpey, Chem. Eng. J., 2022, 137465 CrossRef CAS.
- X. Zhu, M. Lyu, T. Ge, J. Wu, C. Chen, F. Yang, D. O’Hare and R. Wang, Cell Rep. Phys. Sci., 2021, 2(7), 100484 CrossRef CAS.
- M. Song, G. Rim, F. Kong, P. Priyadarshini, C. Rosu, R. P. Lively and C. W. Jones, Ind. Eng. Chem. Res., 2022, 61, 13624–13634 CrossRef CAS.
- C. Hepburn, E. Adlen, J. Beddington, E. A. Carter, S. Fuss, N. Mac Dowell, J. C. Minx, P. Smith and C. K. Williams, Nature, 2019, 575, 87–97 CrossRef CAS PubMed.
- M. Erans, E. S. Sanz-Pérez, D. P. Hanak, Z. Clulow, D. M. Reiner and G. A. Mutch, Energy Environ. Sci., 2022, 15, 1360–1405 RSC.
- D. W. Keith, G. Holmes, D. S. Angelo and K. Heidel, Joule, 2018, 2, 1573–1594 CrossRef CAS.
- H. Chen, H. Dong, Z. Shi and A. K. SenGupta, Sci. Adv., 2023, 9, eadg1956 CrossRef CAS PubMed.
- E. S. Sanz-Perez, C. R. Murdock, S. A. Didas and C. W. Jones, Chem. Rev., 2016, 116, 11840–11876 CrossRef CAS PubMed.
- G. Qi, L. Fu and E. P. Giannelis, Nat. Commun., 2014, 5, 1–7 Search PubMed.
- S. A. Didas, S. Choi, W. Chaikittisilp and C. W. Jones, Acc. Chem. Res., 2015, 48, 2680–2687 CrossRef CAS PubMed.
- P. Priyadarshini, G. Rim, C. Rosu, M. Song and C. W. Jones, ACS Environ. Au, 2023, 3, 295–307 CrossRef CAS PubMed.
- E. Burentugs, L. Proaño, H. J. Moon, G. Rim, I. Nezam, A. Korde, S. Nair and C. W. Jones, JACS Au, 2023, 3(1), 62–69 CrossRef PubMed.
- M. Yang, C. Ma, M. Xu, S. Wang and L. Xu, Curr. Pollut. Rep., 2019, 5, 272–293 CrossRef CAS.
- B. Barkakaty, B. G. Sumpter, I. N. Ivanov, M. E. Potter, C. W. Jones and B. S. Lokitz, Environ. Technol. Innovation, 2017, 7, 30–43 CrossRef.
- X. Duan, G. Song, G. Lu, Y. Wang, J. Sun, A. Chen and X. Xie, Mater. Today Sustain., 2023, 23, 100453 CrossRef.
- S. Choi, J. H. Drese, P. M. Eisenberger and C. W. Jones, Environ. Sci. Technol., 2011, 45, 2420–2427 CrossRef CAS PubMed.
- A. A. Al-Absi, A. Domin, M. Mohamedali, A. M. Benneker and N. Mahinpey, Fuel, 2023, 333, 126401 CrossRef CAS.
- X. Zhu, W. Xie, J. Wu, Y. Miao, C. Xiang, C. Chen, B. Ge, Z. Gan, F. Yang and M. Zhang, Chem. Soc. Rev., 2022, 51(15), 6574–6651 RSC.
- M. Song, G. Rim, Y. Wang, I. Borne, C. W. Jones and R. P. Lively, Chem. Eng. J., 2023, 147135 CrossRef CAS.
- F. Kong, G. Rim, M. Song, C. Rosu, P. Priyadarshini, R. P. Lively, M. J. Realff and C. W. Jones, Korean J. Chem. Eng., 2022, 39, 1–19 CrossRef CAS.
- M. Mourshed, Renew. Energy, 2016, 94, 55–71 CrossRef.
- J. U. Keller and R. Staudt, Gas Adsorption Equilibria: Experimental Methods and Adsorptive Isotherms, Springer Science & Business Media, 2005 Search PubMed.
- J. M. Kolle and A. Sayari, Ind. Eng. Chem. Res., 2019, 59, 6944–6950 CrossRef.
- Y. Sarazin and P. M. Chapple, Calcium, Strontium and Barium Complexes in Organic Synthesis, Comprehensive Organometallic Chemistry IV, 2022, vol. 11, pp. 104–192 Search PubMed.
- R. G. Parr, L. v. Szentpály and S. Liu, J. Am. Chem. Soc., 1999, 121, 1922–1924 CrossRef CAS.
- M. Glassner, M. Vergaelen and R. Hoogenboom, Polym. Int., 2018, 67, 32–45 CrossRef CAS.
- J. F. Diaz, K. J. Balkus, F. Bedioui, V. Kurshev and L. Kevan, Chem. Mater., 1997, 9, 61–67 CrossRef CAS.
- A.-C. Franville, D. Zambon, R. Mahiou and Y. Troin, Chem. Mater., 2000, 12, 428–435 CrossRef CAS.
- M. A. Wahab, I. Kim and C.-S. Ha, J. Solid State Chem., 2004, 177, 3439–3447 CrossRef CAS.
- F.-Y. Chang, K.-J. Chao, H.-H. Cheng and C.-S. Tan, Sep. Purif. Technol., 2009, 70, 87–95 CrossRef CAS.
- J.-T. Anyanwu, Y. Wang and R. T. Yang, Chem. Eng. Sci., 2022, 254, 117626 CrossRef CAS.
- F. Bai, X. Liu, S. Sani, Y. Liu, W. Guo and C. Sun, Sep. Purif. Technol., 2022, 299, 121539 CrossRef CAS.
- Y. Uehara, D. Karami and N. Mahinpey, Adsorption, 2019, 25, 703–716 CrossRef CAS.
- A. R. Sujan, S. H. Pang, G. Zhu, C. W. Jones and R. P. Lively, ACS Sustain. Chem. Eng., 2019, 7, 5264–5273 CrossRef CAS.
- J. Zhang, Q. Zhao, S. Wang and X. Tan, Sep. Purif. Technol., 2022, 287, 120562 CrossRef CAS.
- K. Li, J. Jiang, S. Tian, F. Yan and X. Chen, J. Mater. Chem. A, 2015, 3, 2166–2175 RSC.
- A. Peeters, R. Ameloot and D. E. De Vos, Green Chem., 2013, 15, 1550–1557 RSC.
- S. Yang, L. Zhan, X. Xu, Y. Wang, L. Ling and X. Feng, Adv. Mater., 2013, 25, 2130–2134 CrossRef CAS PubMed.
- H. Shi, J. Yang, Z. Ahmad, H. Zhang and J. Chen, Sep. Purif. Technol., 2023, 325, 124608 CrossRef CAS.
- P. V. Danckwerts, Chem. Eng. Sci., 1979, 34, 443–446 CrossRef CAS.
- M. Caplow, J. Am. Chem. Soc., 1968, 90, 6795–6803 CrossRef CAS.
- S. A. Didas, A. R. Kulkarni, D. S. Sholl and C. W. Jones, ChemSusChem, 2012, 5, 2058–2064 CrossRef CAS PubMed.
- Y. Belmabkhout, R. Serna-Guerrero and A. Sayari, Ind. Eng. Chem. Res., 2010, 49, 359–365 CrossRef CAS.
- D. R. Kumar, C. Rosu, A. R. Sujan, M. A. Sakwa-Novak, E. W. Ping and C. W. Jones, ACS Sustain. Chem. Eng., 2020, 8, 10971–10982 CAS.
- G. Rim, T. G. Feric, T. Moore and A. A. Park, Adv. Funct. Mater., 2021, 31, 2010047 CrossRef CAS.
- E. R. Monazam, J. Spenik and L. J. Shadle, Chem. Eng. J., 2013, 223, 795–805 CrossRef CAS.
- S. A. AL-Hammadi, A. A. Al-Absi, O. A. Bin-Dahman and T. A. Saleh, J. Environ. Manage., 2018, 226, 358–364 CrossRef CAS PubMed.
- E. C. N. Lopes, F. S. C. dos Anjos, E. F. S. Vieira and A. R. Cestari, J. Colloid Interface Sci., 2003, 263, 542–547 CrossRef CAS PubMed.
- N. Álvarez-Gutiérrez, M. V. Gil, F. Rubiera and C. Pevida, Chem. Eng. J., 2017, 307, 249–257 CrossRef.
- M. Mohamedali, A. Henni and H. Ibrahim, Microporous Mesoporous Mater., 2019, 284, 98–110 CrossRef CAS.
- X. Jia, P. Yang, Y. Fan and C. Wang, Sep. Purif. Technol., 2024, 328, 124992 CrossRef CAS.
- J. H. Drese, S. Choi, R. P. Lively, W. J. Koros, D. J. Fauth, M. L. Gray and C. W. Jones, Adv. Funct. Mater., 2009, 19, 3821–3832 CrossRef CAS.
- D. R. Paul and W. J. Koros, J. Polym. Sci., Polym. Phys. Ed., 1976, 14, 675–685 CrossRef CAS.
- M. Mohamedali, D. Nath, H. Ibrahim and A. Henni, Greenhouse Gases, 2016, pp. 115–154 Search PubMed.
- J. Wilcox, Carbon Capture, Springer Science & Business Media, 2012 Search PubMed.
- T. A. Saleh and A. A. Al-Absi, J. Mol. Liq., 2017, 248, 577–585 CrossRef CAS.
- Z. Huang, D. Karami and N. Mahinpey, Chem. Eng. Res. Des., 2021, 167, 198–206 CrossRef CAS.
- H. J. Moon, J.-M. Carrillo, J. Leisen, B. G. Sumpter, N. C. Osti, M. Tyagi and C. W. Jones, J. Am. Chem. Soc., 2022, 144, 11664–11675 CrossRef CAS PubMed.
- W. Li, D. Fu and J. Pan, Energy Fuels, 2023, 37(20), 15879–15895 CrossRef CAS.
- H. T. Kwon, M. A. Sakwa-Novak, S. H. Pang, A. R. Sujan, E. W. Ping and C. W. Jones, Chem. Mater., 2019, 31, 5229–5237 CrossRef CAS.
- M. Mohamedali, H. Ibrahim and A. Henni, Microporous Mesoporous Mater., 2020, 294, 109916 CrossRef CAS.
- X. Li, R. Li, K. Peng, K. Zhao, M. Bai, H. Li, W. Gao and Z. Gong, Chem. Eng. J., 2023, 464, 142662 CrossRef CAS.
- A. Goeppert, H. Zhang, M. Czaun, R. B. May, G. K. S. Prakash, G. A. Olah and S. R. Narayanan, ChemSusChem, 2014, 7, 1386–1397 CrossRef CAS PubMed.
- Q. Wu, S. Chen and H. Liu, RSC Adv., 2014, 4, 27176–27183 RSC.
- A. A. Gabrienko, A. V. Ewing, A. M. Chibiryaev, A. M. Agafontsev, K. A. Dubkov and S. G. Kazarian, Phys. Chem. Chem. Phys., 2016, 18, 6465–6475 RSC.
- J. S. Piccin, G. L. Dotto and L. A. A. Pinto, Braz. J. Chem. Eng., 2011, 28, 295–304 CrossRef CAS.
- C. Nguyen and D. D. Do, Langmuir, 2000, 16, 1868–1873 CrossRef CAS.
- S. Loganathan and A. K. Ghoshal, Chem. Eng. J., 2017, 308, 827–839 CrossRef CAS.
- K. S. K. Reddy, A. M. Varghese, A. E. Ogungbenro and G. N. Karanikolos, ACS Appl. Eng. Mater., 2023, 1, 720–733 CrossRef CAS.
- W. Chaikittisilp, J. D. Lunn, D. F. Shantz and C. W. Jones, Chem. - Eur. J., 2011, 17, 10556–10561 CrossRef CAS PubMed.
- J. A. Wurzbacher, C. Gebald and A. Steinfeld, Energy Environ. Sci., 2011, 4, 3584–3592 RSC.
- J.-T. Anyanwu, Y. Wang and R. T. Yang, Ind. Eng. Chem. Res., 2019, 59, 7072–7079 CrossRef.
- C. Gebald, J. A. Wurzbacher, P. Tingaut, T. Zimmermann and A. Steinfeld, Environ. Sci. Technol., 2011, 45, 9101–9108 CrossRef CAS PubMed.
- E. S. Sanz-Pérez, A. Fernández, A. Arencibia, G. Calleja and R. Sanz, Chem. Eng. J., 2019, 373, 1286–1294 CrossRef.
- X. Zhu, T. Ge, F. Yang, M. Lyu, C. Chen, D. O'Hare and R. Wang, J. Mater. Chem. A, 2020, 8, 16421–16428 RSC.
- H. Ziaei-Azad, J. M. Kolle, N. Al-Yasser and A. Sayari, Microporous Mesoporous Mater., 2018, 262, 166–174 CrossRef CAS.
- T. T. T. Nguyen, J.-B. Lin, G. K. H. Shimizu and A. Rajendran, Chem. Eng. J., 2022, 442, 136263 CrossRef CAS.
- N. S. Wilkins, A. Rajendran and S. Farooq, Adsorption, 2020, 1–26 CAS.
- N. S. Wilkins and A. Rajendran, Adsorption, 2019, 25, 115–133 CrossRef CAS.
- N. S. Wilkins, K. N. Pai and A. Rajendran, Can. J. Chem. Eng., 2022, 100, 2374–2393 CrossRef CAS.
- N. S. Wilkins, J. A. Sawada and A. Rajendran, Ind. Eng. Chem. Res., 2021, 60, 10777–10790 CrossRef CAS.
Footnote |
| † Electronic supplementary information (ESI) available. See DOI: https://doi.org/10.1039/d3ta07909k |
| This journal is © The Royal Society of Chemistry 2024 |

