 Open Access Article
Creative Commons Attribution 3.0 Unported Licence
Progress in in situ characterization of electrocatalysis
Wei
Shen†
 a,
Yizhen
Ye†
a,
Qiujin
Xia
a and
Pinxian
Xi
a,
Yizhen
Ye†
a,
Qiujin
Xia
a and
Pinxian
Xi
 *ab
*ab
aState Key Laboratory of Applied Organic Chemistry, Frontiers Science Center for Rare Isotopes, College of Chemistry and Chemical Engineering, Lanzhou University, Lanzhou, 730000, China. E-mail: xipx@lzu.edu.cn
bState Key Laboratory of Baiyunobo Rare Earth Resource Researches and Comprehensive Utilization, Baotou Research Institute of Rare Earths, Baotou 014030, China
First published on 14th October 2024
Abstract
With the continuous development and extensive research of electrocatalytic technology, the unclear dynamic catalytic reaction process limits the in-depth study of reaction regulation mechanisms and the targeted design of excellent catalysts. The comprehension of electrochemical reactions through conventional ex situ characterization techniques poses a formidable challenge. Fortunately, in situ characterization technology makes it possible to further clarify the mechanism of electrocatalytic reactions. Here, we will select some highlight studies of in situ characterization techniques during electrochemical reactions to introduce features and difficulties in practical experiments and give some advice and evaluate future development trends for relevant fields. This article will show the advantages as well as challenges in the in situ technology in electrocatalytic reactions, and indicate the development directions.
Broader contextElectrocatalysis is considered to be an important way to achieve clean energy storage and conversion, as well as environmentally friendly smelting. With the continuous development in recent years, understanding of the catalytic reaction process is unclear, which limits the further optimization of the design of efficient energy catalytic materials. In the past, it was difficult to capture the dynamic generation of intermediates and the process of structural evolution and self-recovery in response to voltage. Therefore, there is an urgent need to develop in situ characterization methods to dynamically identify the intermediates, paths, structural evolution and other real-time information of reactions in higher time-spatial-spectral multiple dimensions. Through the understanding of the advantages and disadvantages of different in situ methods, one or more combined methods can be reasonably selected to analyze the reaction mechanism, and then the relationship between the structure–reaction mechanism and the performance can be established to provide theoretical guidance for efficient electrocatalytic reactions. Here, we review the latest progress of in situ characterization of electrocatalysis, so that researchers, engineers and other practitioners in related fields have a more comprehensive understanding of electrocatalysis in situ characterization technology. |
1. Introduction
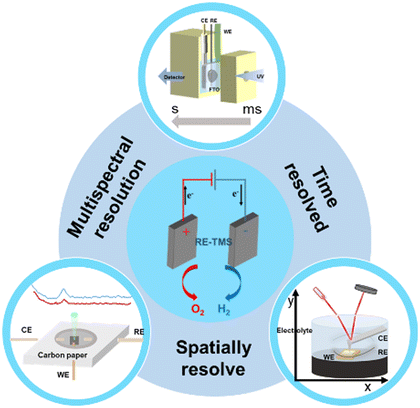
With the continuous development of the field of electrocatalysis, exploring the mechanism of electrocatalytic reactions and clarifying the structure–activity relationship are the key methods to solve the bottleneck problems in the development of electrocatalysis. Electrocatalytic reactions mainly include the oxygen evolution reaction (OER), hydrogen evolution reaction (HER), oxygen reduction reaction (ORR), carbon dioxide reduction reaction (CO2RR), etc. The water splitting reaction comprises two half-reactions, namely the HER and OER. The HER process typically involves Volmer and Heyrovsky or Tafel steps, while the OER step is intricate and encompasses the generation of four intermediate species, significantly impeding progress in water splitting research.1 The ORR plays a crucial role in energy conversion devices, such as fuel cells and metal–air batteries, involving both 2e− and 4e− pathways. The 2e− pathway leads to the formation of H2O2, which can have detrimental effects on fuel cell reactions.2 On the other hand, the 4e− pathway directly produces water; however, its reaction mechanism is intricate and kinetics are sluggish. Nevertheless, harnessing the potential of the 2e− reaction pathway allows for controlled production of H2O2. The CO2RR is the electrochemical process employed to catalytically convert CO2 into valuable organic compounds, including formic acid, ethanol, and acetic acid.3 While copper-based catalysts are commonly utilized in the CO2RR, enhancing the selectivity towards multi-carbon products and suppressing the undesired HER remain critical challenges.However, the methods of ex situ testing have the problems of not being able to monitor the transformation of catalytic intermediates in real-time and the self-recovery of catalysts.4,5 Therefore, it is particularly important to develop in situ characterization technology and monitor the dynamic evolution process of catalyst intermediates in real-time. In situ characterization techniques are essential ways to determine the active sites of catalysts, mechanism of chemical reactions and the relationship between structures and performance, and provide theoretical guidance for the design and development of efficient and stable catalysts.6 In detail, we can monitor the reaction processes and elucidate the impact of compositional conditions on the characteristics of the target product through multispectral resolution spectroscopy and high spatiotemporal resolution techniques. Given the importance of comprehending the process and mechanism of chemical reactions, we will elaborate on the application and future trends of in situ characterization technology in electrocatalytic reactions from three perspectives: in situ multispectral resolution spectroscopy, spatial resolution spectroscopy, and temporal resolution spectroscopy (Fig. 1).7 Multispectral resolution spectroscopy relies on the molecular energy changes generated by the response, typically utilizing techniques such as infrared spectroscopy, Raman spectroscopy, X-ray spectroscopy and others.8,9 The acquisition of information regarding alterations in the molecular structure of the material is typically achieved. For spatial resolution spectroscopy, we employ microscopic technology as the primary means to monitor the morphological transformation mechanism of materials during electrocatalytic reactions, enabling real-time observation of nanomaterial evolution. Also, spatial resolution spectroscopy10 can obtain in depth information of electrocatalysts or of various active sites of the sample, such as defects or steps. Although EDS11 and EELS12 techniques are fundamentally energy resolution methods, they are included in this paper due to their advancements in electron microscopy. The time resolution technique captures the signal response of the catalytic reaction on a temporal scale, enabling a comprehensive understanding of the electrocatalytic reaction behavior in terms of time dynamics. Time resolution intersects with both multispectral and spatial resolutions; however, it represents a further advancement in technology used to detect temporal changes in material energy and morphology.
2. Multispectral resolution spectra
A multispectral resolution spectrum can record the changes of a specific peak of materials during electrocatalyst reactions to capture the information of reaction media.13 We can analyze the changes in specific absorption peaks through multispectral resolution spectroscopy, including in situ Raman spectroscopy, in situ Fourier transform infrared spectroscopy, in situ X-ray powder diffraction, in situ fluorescence spectroscopy, etc.2.1 In situ Raman spectroscopy
The principle of Raman spectroscopy is based on the phenomenon of Raman scattering, which involves the elastic and inelastic scattering of light by matter. The Raman effect occurs when light hits a molecule and interacts with its electron clouds and molecular bonds.14,15 For the spontaneous Raman effect, the photon excites the molecule from the ground state to a virtual energy state. When the excited molecule emits a photon it returns to a rotational or vibrating state different from the ground state. The energy difference between the ground state and the new state causes the frequency of the emitted photon to differ from the wavelength of the excited light.14 If the molecules in the final vibrational state have a higher energy than the initial state, the excited photons have a lower frequency to ensure that the total energy of the system is maintained. The frequency change of this photon, the Raman shift, is related to the vibrational and rotational energy levels of the molecule. Raman spectra reflect the changes in the vibrational and rotational energy levels of molecules, so in situ Raman16 is applied in studying the conversion and formation of chemical bonds of catalysts during electrochemical reactions. For electrocatalytic reactions, a Raman shift in the fingerprint region between 0 and 1000 cm−1 represents reactive species and chemical bonds (M–O) and in the adsorption region between 3000 and 4000 cm−1 reflects the changes of H2O adsorbed by electrocatalysis.The Li group17 found through in situ Raman spectroscopy that the adsorbed hydrogen peroxide* was stable on the Pt(111) surface during the ORR process, but only the adsorbed OH* was observed on the Pt(110) and Pt(100) surfaces. The steps of forming superoxide* and OH* species on the surface of Pt(hkl) will directly affect the oxygen reduction reaction (ORR) activity of different single crystal surfaces. Meanwhile, under alkaline conditions, only O2− species were found on the surfaces of the three single crystals. Therefore, they believe that the protonation process significantly affects the activity and mechanism of the ORR (Fig. 2).
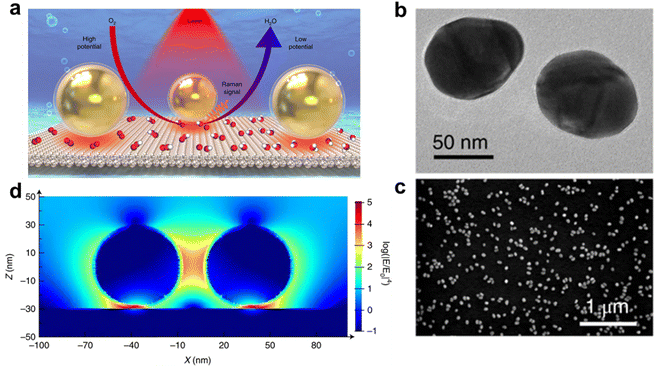 | ||
| Fig. 2 Schematic illustration of the SHINERS study of the ORR process and correlated characterization and 3D-FDTD results at Pt(hkl) surfaces. (a) Model of Au@SiO2 NPs, SHINs at a Pt(111) surface and the mechanism of the ORR process revealed by the EC-SHINERS method. (b) TEM image of Au@SiO2 nanoparticles. (c) SEM image of a Pt(111) single-crystal electrode surface modified with SHINs. (d) 3D-FDTD simulations of four SHIN NPs with a model of a 2 × 2 array on a Pt substrate. Reprinted with permission from ref. 17 Copyright 2018, Springer Nature. | ||
2.2 In situ Fourier transform infrared spectroscopy
Fourier transform infrared (FT-IR) spectroscopy18 is based on the change of dipole moment with molecular vibration and rotation. FT-IR19 is used to understand the changes of electrocatalyst surface adsorption–desorption during the electrocatalysis reaction. Different with FT-IR, in attenuated total reflection Fourier transform infrared spectroscopy (ATR-FTIR) an IR beam through the attenuated total reflection (ATR) crystal achieving the light is fully reflected on the optical interface. When the contact areas between the ATR crystal and the electrocatalysts change, the optical path difference of the substance in the sample to absorb the light will be impacted (Fig. 3a and b). The changes in the fingerprint region are not always referenced as being influenced by ATR crystal light. For electrocatalytic reactions, Raman spectra are more sensitive to the variation to the fingerprint region, while FT-IR tends to use the adsorption region from 1000 to 4000 cm−1.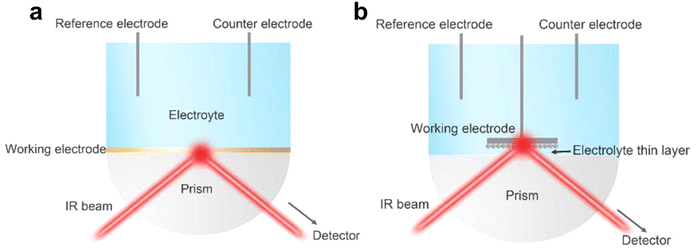 | ||
| Fig. 3 (a) and (b) Schematic illustrations of electrochemical in situ FTIR in internal (a) and external (b) reflection modes. Reprinted with permission from ref. 19 Copyright 2021, Elsevier. | ||
Based on ATR-FTIR measurements, the Peter team20 discovered two possible reaction pathways for the conversion of CO2 to methanol based on the affinity trends of C and O on the catalyst surface. The asymmetric and symmetric stretching patterns observed by the author in the COO group of HCOO− species ensured that pathway 2 is a more likely mechanism for methanol formation during the CO2RR process. In addition, the formation of HCOO− (secondary product) can only be achieved through the second pathway. On the other hand, the formation of CO at higher potentials is the first pathway. Compared with CuGa2, the absorption intensity and standardized absorbance corresponding to the two main intermediates formed by Cu9Ga4 and methanol are relatively small, indicating a lower formation of methanol on Cu9Ga4 (Fig. 4).
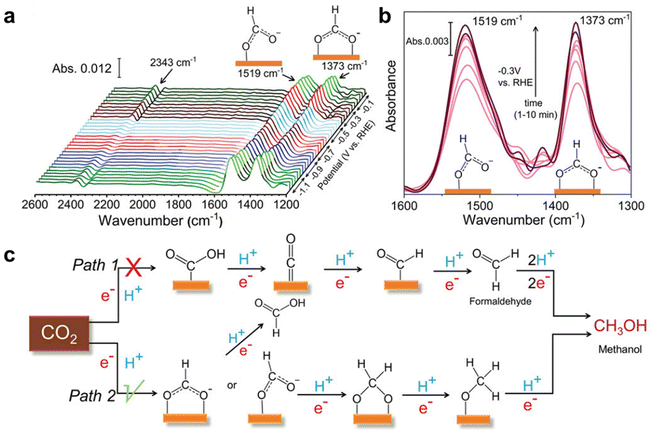 | ||
| Fig. 4 Mechanistic investigation of the CO2RR by in situ IR study. (a) In situ IR spectra obtained during the eCO2RR using a CuGa2 catalyst. (b) IR spectra corresponding to CHO and COO− intermediate formed during methanol production at a different time during CA at −0.3 V (vs. RHE). (c) Plausible reaction mechanism for the eCO2RR to methanol on Cu–Ga-based ordered intermetallic catalysts. Reprinted with permission from ref. 20 Copyright 2022, John Wiley and Sons. | ||
2.3 In situ X-ray powder diffraction
According to the Bragg equation, the principles of X-ray powder diffraction (XRD)21,22 are based on the diffraction phenomenon of X-rays in crystals. XRD is used to develop the crystal types, crystal parameters, crystal defects, and the relative content of different structural phases. So, we can gain the conversion of crystal structure under different potential in the venture of in situ XRD. In the past, the equipment of in situ XRD was synchrotron-based in situ X-ray diffraction,23 while regular XRD can be used, raised by the intensity of the X-ray light source. In a real experiment, we firstly apply X-rays to scan the diffraction angle (θ) from 10 to 90° with a scan rate of about 10° min−1 to ensure the changes of different diffraction peaks roughly. Then, we can scan a specific angle under a low scan rate (1° min−1) to obtain phase composition, structure, crystal morphology, etc. Furthermore, in order to raise the testing range and resolution ratio, a synchrotron-based in situ XRD technique is developed and employed.23,24The Ward van der Stam group25 found through in situ XRD that the original BiOX electrocatalyst was converted into metal Bi, but the formation of active sites was severely affected by halides: bromide promoted Bi(003), chloride led to preferred Bi(012) exposure, and iodide had equal contributions from Bi(003) and Bi(012). Structure–activity relationships were established to combine catalytic properties, among which the Bi(003) surface phase is more selective and active for the formation of formic acid on the Bi(012) surface (Fig. 5).
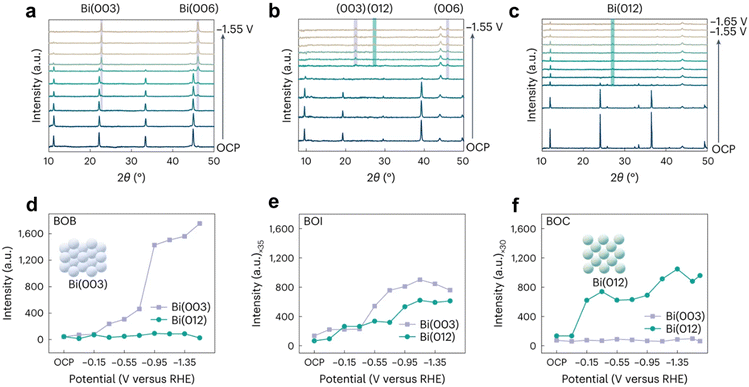 | ||
| Fig. 5 In situ XRD of (a) BOB, (b) BOI and (c) BOC. Diffraction intensity of Bi(003) and Bi(012) facets as a function of the reaction time of BOB (d), BOI (e) and BOC (f) in CO2 saturated 0.1 M KHCO3 solution. The purple and green shaded areas give the expected diffraction angles for the Bi(003) and Bi(006) reflections and Bi(012) reflections, respectively. Reprinted with permission from ref. 25 Copyright 2023, Springer Nature. | ||
2.4 In situ fluorescence spectroscopy
The fluorescence spectrum is excited by the absorption of visible light by a substance, and the excited atoms or molecules will transition to the excitation state after absorbing photons.26 When electrons jump back to the ground state, fluorescence will be generated. From a microscopic perspective, when a material molecule is irradiated by light, the molecule will be excited when absorbing photon energy. And then the electrons in the molecules will transition from a low energy level to a high energy level, at which time the molecule will transition from the ground state to the excited state. Molecules in the excited state are unstable and return to the ground state through a decay process of radiative or non-radiative transitions, which produce fluorescence.27,28 By using in situ fluorescence spectroscopy, dynamic evolution behaviors such as structural evolution during catalytic reactions can be described. For an electrochemical organic oxidation reaction (OOR), a fluorescent probe is used for labeling organic molecules for detection in an in situ fluorescence spectrum.The Xia group29 used in situ fluorescence spectroscopy combined with electrochemical technology to detect the formation of OCI using dichlorodihydrofluorescein (DCDHF) as an indicator. After reacting with OCI generated in an ORR, DCDHF will be converted into fluorescent dichlorofluorescein. During the ORR period between 0.848 VRHE (with a cathode current of approximately 20 mA), the emission at 522 nm in 0.1 M potassium hydroxide containing 2.5 mM DCDHF continued to increase with increasing electrolysis time. To verify that the detected OCI is a transient rather than a byproduct, the ORR on CPG-900 was performed at 0.849 V in a 1![[thin space (1/6-em)]](https://www.rsc.org/images/entities/char_2009.gif) :
:![[thin space (1/6-em)]](https://www.rsc.org/images/entities/char_2009.gif) 1 (v/v) water/ethanol solution of 0.01 M potassium hydroxide solution. The significant reduction in current occurs after the addition of DCDHF, indicating that the formation of OCI is an electrochemical reaction that can further receive electrons from the electrode to complete the ORR and form fluorescent DCF through parallel chemical reactions with DCDHF. Further experiments were conducted using specific signal molecules such as coumarin to determine the observed OCI as a HO radical. Due to the hydroxylation of coumarin at the seventh position during the ORR process, the fluorescence emission increases at 500 nm (Fig. 6).
1 (v/v) water/ethanol solution of 0.01 M potassium hydroxide solution. The significant reduction in current occurs after the addition of DCDHF, indicating that the formation of OCI is an electrochemical reaction that can further receive electrons from the electrode to complete the ORR and form fluorescent DCF through parallel chemical reactions with DCDHF. Further experiments were conducted using specific signal molecules such as coumarin to determine the observed OCI as a HO radical. Due to the hydroxylation of coumarin at the seventh position during the ORR process, the fluorescence emission increases at 500 nm (Fig. 6).
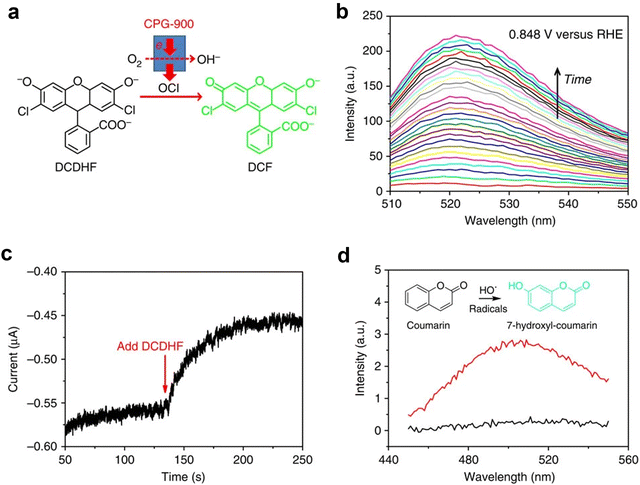 | ||
| Fig. 6 Probing the multi-elemental steps of the ORR. (a) Schematic illustration of the conversion from non-fluorescent DCDHF to fluorescent DCF by the OCI formed in the ORR on CPG-900. (b) In situ fluorescence spectroelectrochemistry. (c) I–T curve of the ORR on CPG-900 at 0.849 V versus RHE. (d) In situ fluorescence spectroelectrochemistry performed at 0.799 V versus RHE with 60 mM coumarin to specifically verify the presence of HO˙ radicals. Reprinted with permission from ref. 29 Copyright 2014, Springer Nature. | ||
2.5 In situ X-ray photoelectron spectroscopy
X-ray photoelectron spectroscopy (XPS) provides the chemical property of a material surface including the existing form of an element and charge distribution. The principle of XPS is by radiating the sample with X-rays, so that the inner electrons or valence electrons of atoms or molecules are excited to be emitted.30,31 Electrons excited by photons are called photoelectrons, and the energy of photoelectrons can be measured, named the binding energy, and we can obtain the surface information of materials according to it. In the past, in situ XPS was just combined by synchrotron radiation photoelectron spectroscopy (SRPES). However, now more convenient ambient pressure X-ray photoelectron spectroscopy (AP-XPS) is compatible for use in in situ experiments. When applying potential to a sample, the dynamic changes of the existing form of an element and charge distribution for a material surface will be held by AP-XPS32,33 (Fig. 7).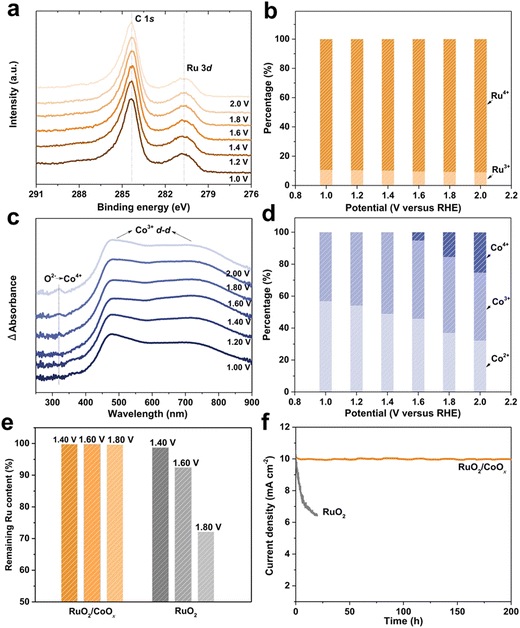 | ||
| Fig. 7 Investigation on the in situ stability of an RuO2/CoOx hybrid catalyst during the OER. (a) and (b) In situ Ru 3d XPS spectra. (c) In situ UV-vis spectra. (d) Co2+, Co3+ and Co4+ content ratios in RuO2/CoOx under different applied potentials based on EPR analysis. (e) Retention ratios of Ru in RuO2/CoOx and RuO2 after continuously testing at different potentials for 20 h. (f) Potentiostatic tests of RuO2/CoOx (at 1.47 VRHE) and RuO2 (at 1.59 VRHE) for an initial current density of 10 mA cm−2. Reprinted with permission from ref. 34 Copyright 2022, Springer Nature. | ||
The Ling group34 monitored the stability of a RuO2/CoOx hybrid catalyst during the OER process in a neutral environment through in situ XPS. They found that Ru3+ and Ru4+ species coexisted during the OER process, with almost the same RHE percentage from 1.0 to 2.0. Even under 2.0 VRHE, there was still 9% residual Ru3+ in the RuO2/CoOx hybrid. Considering that the average particle size of RuO2 is ∼2 nm, the theoretical proportion of interface Ru atoms to the total Ru atoms should be about 15%. This value is consistent with the percentage of Ru3+ species shown in the in situ XPS results (Fig. 8b), indicating the key role of the constructed interface in stabilizing RuO2.
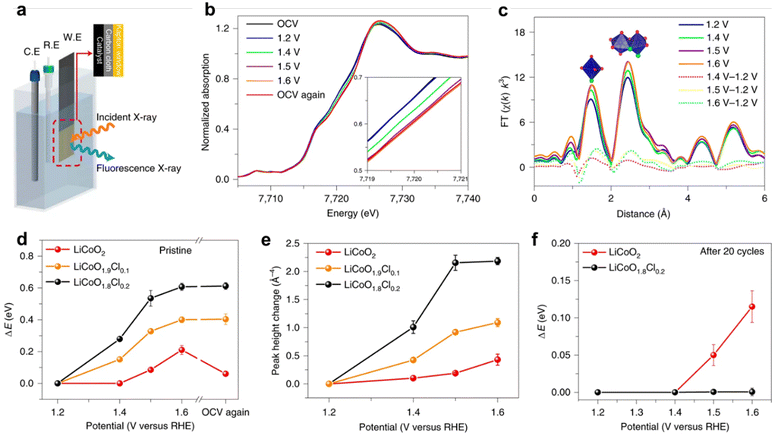 | ||
| Fig. 8 Operando XAFS test. (a) Experimental set-up scheme. C.E., counter electrode; R.E., reference electrode; W.E., working electrode. (b) and (c) Co K-edge XANES spectra recorded at different potentials for fresh LiCoO1.8Cl0.2 (b) and the corresponding Fourier-transformed k3-weighted EXAFS (c). Co K-edge shift (d) and Co–Co coordination peak amplitude change (e) at varied electrochemical potentials for fresh samples. (f) Co K-edge shift for cycled samples (20 times). Reprinted with permission from ref. 35 Copyright 2021, Springer Nature. | ||
2.6 In situ X-ray absorption spectroscopy
For revealing the changes of an electrocatalyst's coordination form, like coordination bond or coordination number during electrochemical reactions, X-ray absorption spectroscopy (XAS) plays an important role.36,37 In detail, evolution of the coordinated environment of an absorbing element can be further extracted by in situ extended X-ray absorption fine structure (EXAFS) spectra, studying the dynamic changes of the scattering path with increasing potential to obtain the coordination form of atoms.38 Also, we can develop the changes of chemicals under applied potential according to in situ X-ray absorption near edge structure (XANES).39 Notably, XPS is used for studying a material surface, while XAS can detect the bulk of materials.The Lim group35 found through in situ XAS that the oxidation of LiCoO1.8Cl0.2 began before 1.4 V compared to LiCoO2, confirming that the potential at which the transition of Co2+/Co3+ in LiCoO1.8Cl0.2 began was lower than that of Co3+/Co4+ in LiCoO2. Within the same anode potential range, the cobalt valence of LiCoO1.8Cl0.2 increases more than that of LiCoO2.40 When OER polarization stopped, the Co K edge of LiCoO1.8Cl0.2 did not recover to a low energy position, indicating that oxidized Co has stability in Cl doped LiCoO2. In contrast, the tetravalent Co in oxidized LiCoO2 is reduced to a lower stable valence state. The doping of Cl can promote the surface reconstruction of LiCoO2 and stabilize the structure after reconstruction.41
2.7 In situ electron paramagnetic resonance
Electron paramagnetic resonance (EPR)42 is introduced to understand unpaired electrons contained in an atom or molecule of electrocatalysts. In situ EPR can be used to research the changes in the configuration of complexes and distribution of d electrons and defects during electrochemical reactions, to clarify the process of electron flow direction and synergetic effects of different components for electrocatalysts and help us to select or modify electrocatalysts.43,44 However, the presence of H2O will contaminate the EPR signal. To assess the free radicals generated by electrochemical reactions, a spin trap such as 5,5-Diethyl-1-Pyrroline-N-Oxide (DMPO) is introduced. In most papers, in situ EPR results are always combined with DFT to elucidate electrocatalytic mechanisms.45The Salager group46 conducted in situ EPR measurements on symmetric Li/LIPF lithium batteries under operating conditions. They used operational EPR spectroscopy and in situ EPR spectral spatial imaging as two highly complementary tools to track the changes in the morphology of metallic lithium during the stripping process, and identify, locate, and distinguish dendrites and submicron lithium particles during the electroplating process. Two main characteristics were observed from the evolution of the EPR spectra and spectral spatial EPR images of metallic lithium in electrochemical batteries during polarization: nucleation of submicron Li particles at the interface between the separator and electrode; gradually roughening of the electrode to a size slightly larger than 1 μm.
2.8 In situ Mössbauer spectroscopy
Mössbauer spectroscopy is performed using the Mössbauer effect, which refers to the fact that when atoms or ions restricted to a crystal are excited by high spectral lines, the emitted spectral lines have special properties. The movement of impurities in the material in the lattice leads to the frequency shift of the detected spectral lines, so that the vibration, diffusion and lattice displacement of impurities can be studied.47,48 Nuclei that exhibit the Mössbauer effect include 57Fe, 119Sn, 121Sb, 125Te, and 197Au.48–50 However, only 57Fe is easily available to test limited to 57Fe Mössbauer source. Furthermore, in situ Mössbauer spectroscopy can be applied to study hyperfine interactions between atomic nuclei and their surroundings during electrocatalytic processes. However, liquid nitrogen freezing and longtime accumulation for a signal is required for in situ Mössbauer spectroscopy, which costs a lot of time and effort.The Wang group51 further studied the evolution of Fe species in the selected NiFe0.2–OxHy during the OER using the operational 57Fe Mössbauer spectroscopy measurement method. The change in isomer displacement values of NiFe0.2–OxHy before and after electrochemical activation can be ignored. This indicates that the valence state (Fe3+) and spin state (high spin) of Fe3+ in NiFe0.2–OxHy are the same before and after electrochemical activation.52 The quadrupole splitting value of Fe3+ is lower than the value before activation, indicating that the geometric shape of Fe3+ in the c-phase NiOOH structure is more regular than that in the α-phase Ni(OH)2 structure. In addition, abundant Fe4+ is generated in situ near the OER starting potential, and the positive correlation between Fe4+ content and current under different application potentials further proves the key role of Fe4+ species in water oxidation53 (Fig. 9 and 10).
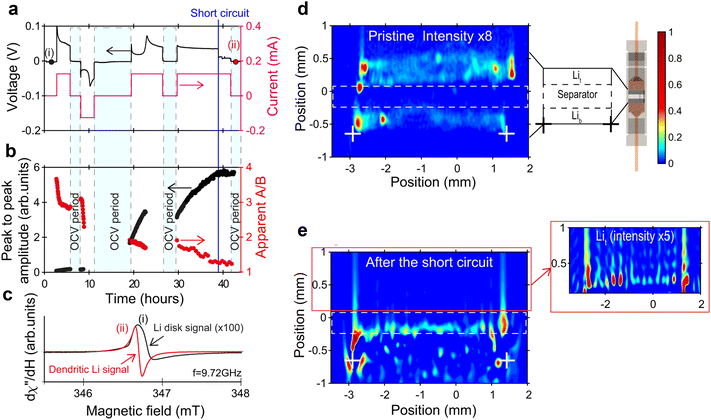 | ||
| Fig. 9 (a)–(e) In situ detection (EPR spectrum) and localization (EPR images) of dendritic Li. Reprinted with permission from ref. 46 Copyright 2021, Springer Nature. | ||
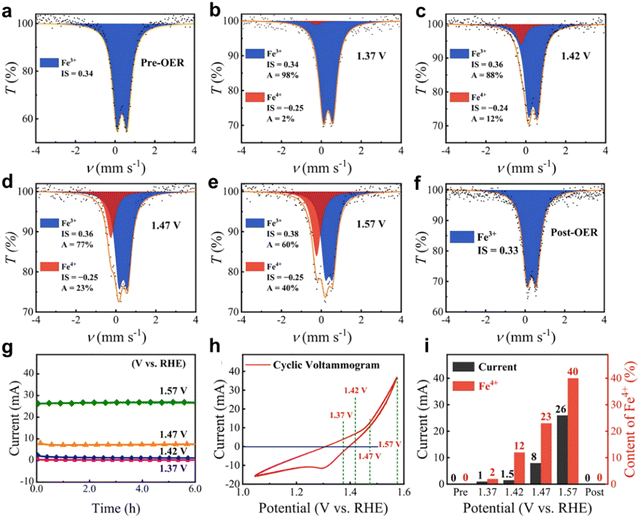 | ||
| Fig. 10 (a)–(e) Operando57Fe Mössbauer spectra of NiFe0.2–OxHy collected at different potentials. (f) Ex situ57Fe Mössbauer spectrum of NiFe0.2–OxHy collected after the OER. (g) The current–time curves at different applied potentials obtained during the operando measurements. (h) The cyclic voltammogram without iR correction of NiFe0.2–OxHy recorded during the operando measurements. (i) The content of Fe4+ and corresponding electric current determined at different applied potentials. Reprinted with permission from ref. 51 Copyright 2021, American Chemical Society. | ||
With the continuous development of the electrochemical field, more and more complex reaction problems are being faced, and researchers urgently need new methods and perspectives to describe the catalytic reaction process. Developing new in situ characterization techniques helps to analyze dynamic reaction mechanisms from a new perspective. These new technologies include those widely used in fields like batteries, biomedical science and the environment, such as X-ray fluorescence48 and nuclear magnetic resonance.54 Reasonable design and application in in situ electrocatalysis can help analyze electrocatalytic reactions, clarify catalytic reaction mechanisms, and guide the synthesis of efficient new materials.
2.9 Summary
In an actual situation, a variety of spectral characterization methods are needed to study electrocatalytic reactions. We should select different characterization techniques to understand the process of electrocatalyst reactions. The characterization techniques mentioned above have their own advantages and disadvantages and should be studied with appropriate means in the face of different needs. Produced during mutual action of light and material, Raman spectroscopy is a kind of testing method which uses inelastic scattering light.55 Raman spectroscopy is used to monitor the production of catalyst intermediates and the change in a chemical bond, while Raman spectroscopy cannot monitor changes in metallic bonds.55 To solve this problem, techniques based on X-ray like XAS56 can be used. However, the popularity and convenience of XAS is much lower than that of Raman spectroscopy. Limited by the principle of FT-IR,57 structure achiral molecules or intermediates can’t be captured. In this case, monitoring can be achieved using molecular fluorescence quenchers by in situ fluorescence spectroscopy.3. Spatially resolved spectra
Although multispectral resolution spectrum techniques have the ability to provide us with the dynamic changes produced during electrochemical reactions, we still find it difficult to understand the conversion of electrocatalysts’ surface morphology in different regions under a high resolution ratio. Therefore, spatially resolved spectroscopy is proposed to investigate the detailed information for electrocatalysts under different spatial dimensions, from millimeters (mm) to microns (μm) to nanometers (nm) in virtue of this, and understand the dynamic surface reconstitution evolution of different regions during electrocatalysts.3.1 In situ optical microscopy imaging
Compared to other electron microscopy techniques, optical microscopy is based on the principle of optical imaging, which can easily achieve high resolution.58,59 Limited by visible wavelengths, the minimum resolution limit of an optical microscope is 200 nm in theory.59 Optical microscopy has the advantage of non-destructive testing without the need for vacuum conditions. However, due to the low resolution, it is difficult to observe nanomaterials using optical microscopy. The method of in situ optical microscopy imaging directly locates the active sites of electrocatalytic reactions by imaging the reactants and/or products, which can help us understand the large-scale morphology evolution process in dynamic evolution, clarify the structure function relationship of catalysts, and provide structural theory for the development of efficient catalysts.The Xu group60 demonstrated electrogenerated chemiluminescence (ECL)61 imaging of the electrochemical activity of individual plasma nanoparticles. Similar to traditional Janus particles, the two different faces of Au Pt JNPs exhibit different catalytic abilities towards ECL emitters and their reactants, resulting in concentration gradients and fluid slip around the particles, which can improve mass transfer speed and reduce the generation of particle oxidation layers. ECL microscopes can be used to provide promising optical imaging and study the electrochemical activity of individual nanoparticles in a high-throughput manner without using an illumination source.
3.2 In situ scanning electron microscope
A scanning electron microscope (SEM)62,63 uses secondary electrons or backscattered electrons generated when an electron beam scans the surface of a sample to obtain the microstructure of materials. For in situ SEM, it can observe the changes of particle size and microstructure of an electrocatalyst in an electrochemical cycle, and we can combine energy dispersive X-ray spectroscopy (EDS)64 to further analyze the components of elements. Despite the requirements of a chip during testing, an in situ SEM exhibits superior operability and portability compared to a transmission electron microscope (TEM).65 The in situ SEM technique possesses a substantial depth of field, facilitating the precise examination of the three-dimensional morphology and structure of the sample surface. This attribute proves particularly advantageous for investigating surface irregularities, ridges, and depressions, thereby providing a more comprehensive understanding of the sample's surface characteristics.66 In summary, the in situ SEM exhibits exceptional operational simplicity, heightened effectiveness, and decreased expenditure within experimental environments.The Li group67 systematically studied the lithium deposition behavior of 10 metal substrates using LAGP as SSE in all solid-state batteries using an in situ micro nano SEM manipulation platform combined with an electrochemical workstation. The results showed that Li growth on Cu, Ti, Ni, Bi, and Cr exhibited typical out of plane dendritic morphology, while in plane granular morphology was observed on In, Ag, Au, Pd, and Al. Based on the deposition behavior of Li on 10 metal substrates, it is concluded that Li's affinity and good lattice compatibility play an important role in uniform and in-plane Li electroplating, which is beneficial for uniform and transverse Li deposition. Their work not only reveals lithium alloys and deposition kinetics, with quantitative details that have never been intuitively captured before, revealing the design of solid-state battery systems, but also provides a universal and powerful integrated micro/nano SEM manipulation platform for in situ research of future solid-state batteries.68 The present work showcases the setup procedure of in situ SEM, offering a robust tool for investigating the deposition and alloying behavior of lithium on diverse metal substrates, thereby facilitating an in-depth comprehension of the mechanism governing lithium behavior in solid-state batteries.
3.3 In situ transmission electron microscope
A transmission electron microscope (TEM)69 is based on elastic or inelastic electrons excited by a high-energy electron beam penetrating a sample to image under applied potential. Given the necessity of conducting testing under vacuum conditions, electrocatalytic reactions cannot be performed using a conventional in situ cell for TEM (Fig. 11). In situ TEM experiments are usually under flow cell, and an in situ sample rod is necessary for in situ TEM, which contains electrochemical chips. For in situ TEM,65,70 the normal function is to observe the change in the microscopic morphology of an electrocatalyst. To investigate changes in lattice spacing, in situ high-resolution transmission electron microscopy (HRTEM) is required. However, the imaging speed of HRTEM is limited, posing a constraint on its ability to observe rapid dynamic processes in real time.71,72 Therefore, it is imperative to carefully select an appropriate temporal resolution based on the specific research problem or employ high-speed imaging techniques to fulfill the requirements for observing and analyzing dynamic processes. Additionally, mapping can be employed to distinguish individual components and investigate the alterations in crystal structure during electrocatalytic reactions using selective area electron diffraction (SAED)73 as required. Although in situ TEM is capable of observing the nanoscale morphological transformation of samples, the high cost of testing often stems from limitations in testing conditions. However, samples exhibiting low resistance to electron radiation are not suitable for in situ TEM. During the test, it is crucial to differentiate between signal variations induced by electrochemical processes and those caused by electronic radiation (Fig. 12 and 13). | ||
| Fig. 11 In situ TEM.74 Copyright 2023 Nat. Commun. | ||
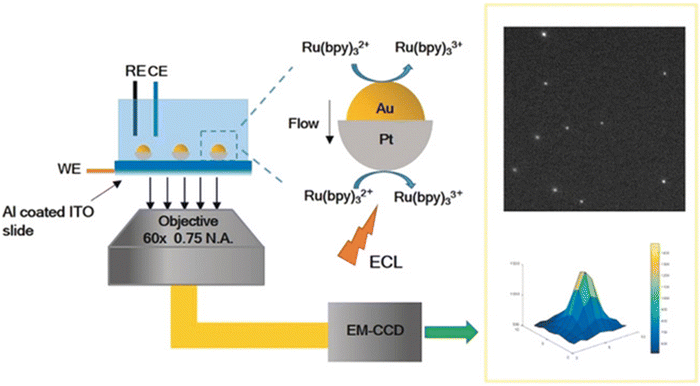 | ||
| Fig. 12 Illustration of electrogenerated chemiluminescence (ECL) imaging of electrocatalysis at Au–Pt JNPs. Reprinted with permission from ref. 60 Copyright 2018, John Wiley and Sons. | ||
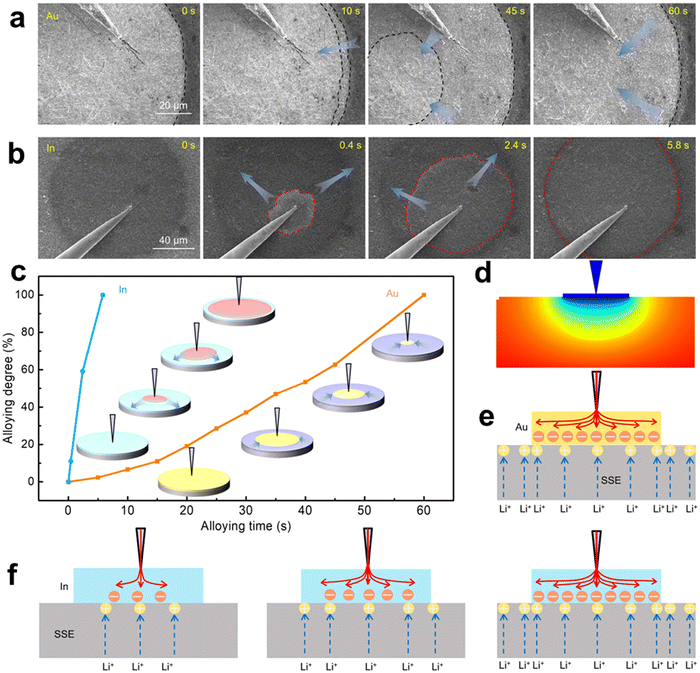 | ||
| Fig. 13 Dynamic Li alloying process on different Li alloyable metallic substrates. (a) Time-series SEM images of the Li–Au alloying phenomenon. (b) Time-series SEM images of the Li–In alloying phenomenon. (c) Li–Au and Li–In alloying degree versus time, and the insets are the schematic illustrations of Li–Au and Li–In alloying. (d) Potential distribution of the SSE beneath the Au substrate (cross-sectional view). (e) Schematic diagram of Li+ and electron distribution at the Au‖SSE interface. (f) Schematic diagrams of Li+ flux and electron distribution at the in ‖SSE interface. Reprinted with permission from ref. 67 Copyright 2022, American Association for the Advancement of Science. | ||
The Xi group74 used in situ TEM to reconstruct NiCo based sulfides into active substances of metal oxygen/hydroxide under alkaline OER operation, and directly imaged the dynamic phase evaluation pathway during the precatalytic stage. At a pre catalytic potential of 0.9 V, the lattice sulfur atom 1.33 on the surface of (NiCo)S is partially replaced by oxygen maintaining the crystal structure in the electrolyte, which further induces the formation of a lattice oxygen sulfur coexisting surface. For example, the (NiCo)OxS1.33−x surface can significantly increase the LOM ratio of the sulfide matrix, making it equivalent to its corresponding oxide and helping to improve catalytic activity. This reduces the energy barrier of surface reconstruction to NiCoOxy/hydroxide as an active electrocatalyst, further promoting the OER process (Fig. 14).
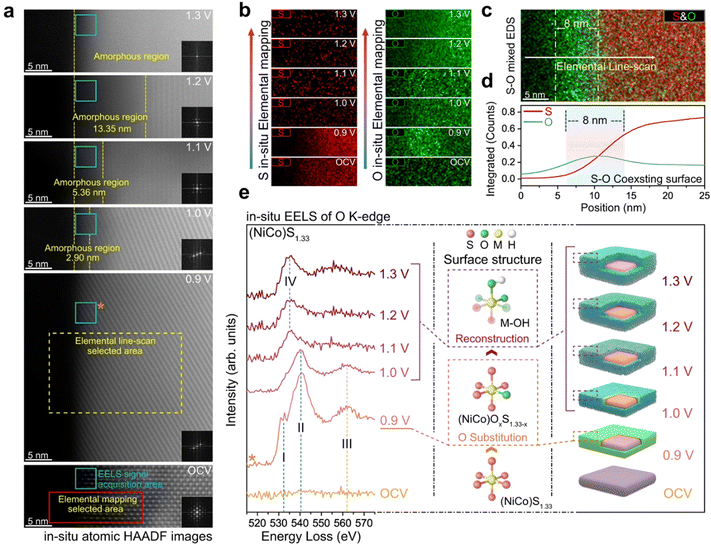 | ||
| Fig. 14 The exchange of lattice sulphur with oxygen. (a) In situ atomic HAADF images of (NiCo)S1.33 after constantly applying different potentials for 20 s. (b) In situ elemental mapping of S and O under different applied potentials. (c) S–O mixed elemental mapping of (NiCo)S1.33 after constantly applying potentials of 0.9 V for 20 s. (d) The corresponding elemental distribution curve extracted from (c). (e) In situ EELS spectra of O K-edge under different applied potentials. Reprinted with permission from ref. 74 Copyright 2023, Springer Nature. | ||
3.4 In situ atomic force microscope
An atomic force microscope (AFM)75,76 according to electrostatic principle uses charge repulsion to measure material surface information, including pore size, surface roughness, and even constructing 3D microstructure. In detail, the working principle of AFM involves quantifying the interaction force between surface molecules (atoms) of the sample and the AFM microcantilever probe to visualize the sample's surface morphology.76 A microcantilever with one end fixed is employed, while its other end features a minute needle that delicately contacts the sample surface. By maintaining a constant force during scanning, which can be an extremely weak repulsive force or other interaction forces like van der Waals force or electrostatic force depending on test conditions and sample properties, the cantilever with the needle corresponds to an equipotential surface of atomic force and vibrates vertically towards the sample surface.77 Positional changes at each scanning point can be measured using optical detection or tunneling current detection, and subsequently amplified and converted to obtain a three-dimensional topographic image of the sample surface78 at an atomic-level resolution. The in situ AFM79,80 technique is an advanced extension of conventional AFM, enabling real-time observation and precise measurement of a sample within its native environment or under specific reaction conditions. With Pt the point of a needle AFM has high spatial resolution, whose horizontal is about 0.2 nm and vertical is about 0.1 nm, and is not limited by the external environment (liquid, vacuum, etc.).81,82 Some researchers observed the surface synthesis environment and three-dimensional transformation process of materials by in situ AFM under probe microscopy.83The Chueh group84 utilized in situ AFM microscopy to reveal how the local operational chemistry, physics, and electronic structure of energy conversion materials govern their electrochemical response. In the CoOxHy system, the hydroxide ion (de)intercalation reaction affects surface catalytic activity by controlling the relationship between OER overpotential and voltage dependent Co3+ active site concentration. They found that by adjusting the thermodynamic and surface adsorption energy methods of layered ion insertion, the OER activity of layered oxides can be improved (Fig. 15).
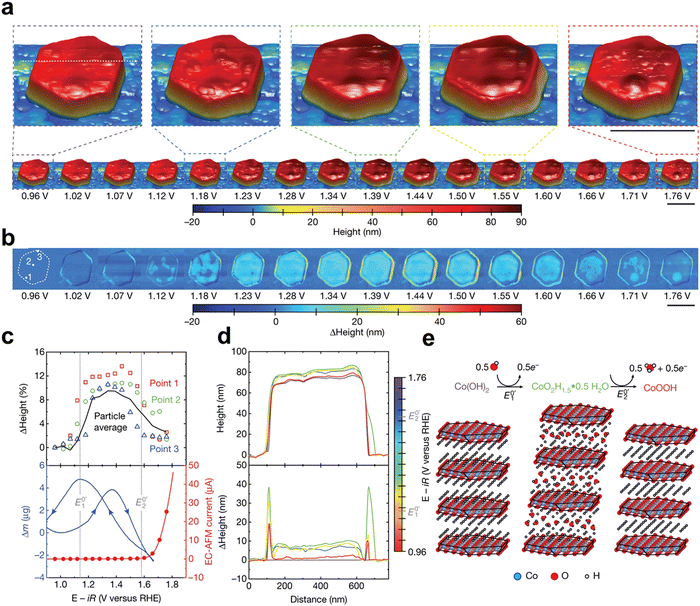 | ||
| Fig. 15 Operando EC-AFM of a β-Co(OH)2 particle. (a) Topography of a β-Co(OH)2 particle in 0.1 M KOH at different applied voltages. (b) Differential height compared to the particle morphology at the open-circuit voltage (0.96 V). Scale bar, 500 nm. (c) Top, heights measured at three selected points (shown on the particle at 0.96 V in) (b); bottom, EC-AFM current (linear sweep voltammetry, red line) and isothermal (T = 25 °C) mass change (measured by EQCM) with changing voltage (blue line). Both EC-AFM and EQCM experiments were performed at a scan rate of 5 mV min−1. The EQCM used a mass loading of 100 μg cmgeom−2 β-Co(OH)2 on a Pt-coated quartz crystal. (d) Line scan of particle height (top) and change in particle height (bottom) versus voltage for the line drawn on the magnified views of the particle at 0.96 V in (a). (e) Schematic demonstrating the translation and the expansion and contraction of individual CoO2 layers as the voltage is increased. Reprinted with permission from ref. 84 Copyright 2021, Springer Nature. | ||
3.5 In situ scanning electrochemical microscopy
Based on the electrochemical principle, the electrochemical current given by oxidation or reduction of substances in the microzone can be measured by scanning electrochemical microscopy (SECM).85,86 By driving a very small electrode (probe) to scan close to the sample, the corresponding micro-area electrochemistry and related information can be obtained, and the spatial resolution can be achieved at about one of micron. According to SECM, we can gain surface electrochemical reaction information, like the change of surface pH and bubble reaction kinetics. In order to understand more information, more and more researchers combine SECM with AFM to rise spatial resolution,87,88 and electrochemical quartz crystal microbalance (EQCM) is combined to study surface resorption and desorption behaviors.87,89The Koper group90 used scanning electrochemical microscopy and platinum ultra microelectrodes as CO and H2 sensors to further investigate the reduction of carbon dioxide in solution with and without metal cations in a surface generated tip collection mode. Only when metal cations are added to the electrolyte can gold, silver, or copper generate CO. Their research results redefine the reaction mechanism and provide clear evidence that positively charged substances in electrolytes are key to stabilizing key reaction intermediates (Fig. 16).
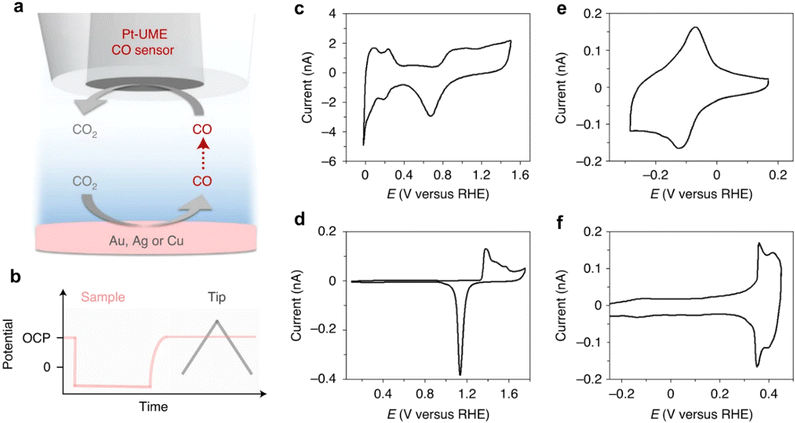 | ||
| Fig. 16 SECM measurement scheme and characterization of the electrodes used. Schematic representation of the SECM experiment (a) and the method used to perform the measurements (b). (c) Blank voltammetry of the Pt-UME used to perform the experiments taken in 0.1 M H2SO4. (d)–(f) Characterization of the gold sample in 0.1 M H2SO4 (d), the silver sample through Tl (I) under potential deposition in 0.5 M Na2SO4 + 0.1 M H2SO4 + 0.1 M Tl2SO4 (e) and the copper sample in 0.5 M NaOH (f). Reprinted with permission from ref. 90 Copyright 2021, Springer Nature. | ||
Developing and enhancing higher spatial resolution technologies can promote directional monitoring of crystal structure and atomic arrangement during in situ reactions, and clarify atomic level transition information of catalytic reactions. The continuous development of spatial resolution technology is beneficial for researchers to deeply understand the catalytic reaction process at the micro scale, from optical resolution to the application of electronic resolution technology, providing researchers with a new perspective to understand the micro scale catalytic process. Optical resolution, with current feature space imaging such as Raman91 and fluorescence microscopy,92 further promotes the evolution of catalytic mechanisms, and continuously improves the resolution of electron microscopy. Realizing in situ spectroscopic resolution at the atomic scale and studying catalytic behavior atomically is also a direction for future development.
3.6 Summary
In an actual situation, a comprehensive array of spectral characterization techniques is essential for investigating electrocatalytic reactions. The TEM technique exhibits the highest spatial resolution among the spatially resolved spectra. However, in order to maintain vacuum conditions during testing, it necessitates the utilization of microfluidic chip in situ cells for operation, which increases testing costs and limits widespread use. Under real situations, in situ optical microscopy can be selected. The AFM and SECM techniques share a common principle, as they both employ probes to investigate the surface characteristics of catalysts.10,93 Both AFM and SECM techniques can be used to observe the surface microstructure of electrocatalysts. In terms of application, AFM mainly measures the morphology, mechanical properties and electrical properties of the sample surface. SECM mainly measures the electrochemical activity, electrocatalytic reaction and corrosion of the sample surface.904. Time resolved spectra
In the known electrocatalytic reactions, primitive processes are carried out in microsecond and nanosecond time scales. Therefore, time resolved spectra should be introduced to reveal the dynamic evolution during electrochemical reactions under high time resolution scale, from second to nanosecond to femtosecond.94 Time resolved spectra can be divided into real-time monitoring spectra and record the electron transition time spectra according to its principles.UV-visible spectra are applied to develop the dynamic changes of active species density under a time scale during electrocatalyst reactions from second to millisecond, can give us the changes in characteristics of the electron absorption spectrum.95,96 Concretely, we monitor the intensity of specific wavelengths as a function of current and voltage by UV-visible spectra, so that we combine the variation with current polarization and potential dependence of extinction to compute the density of active sites. Also, DEMS97,98 and EQCM89,99 are assumed to be a class. These in situ characterization techniques can achieve a time resolved ability with the help of applied potential during testing to analyse the conversion of valence state, product, mass and so on during redox reactions. After being excited by a specific wavelength of incident light, electrons in the ground state transition to an excited state, and then from an excited state back to the ground state. The time resolved fluorescent spectra are recording fluorescence lifetime, which can tell us how long it takes the electron to go back to the ground state, reflecting the dynamic changes of electrocatalytic reactions from millisecond to nanosecond, including electron transfer rate and evolution of electron structure.100 And we can apply fluorescent transient absorption spectroscopy to study reaction kinetics features, such as the transmission of charge and energy between atoms, helping us comprehend the mechanism of chemical reactions and instructing us to design and prepare electrocatalysts better, which is based on pump–probe technology. In the future, we hope that analysis of the formation and breaking of chemical bonds will be achieved on the basis of existing technology. Importantly, the information with regard to state-state interaction and state lifetime can be obtained by measuring the change of ion signal with time, realizing the dynamic description of the formation and breaking of chemical bonds during electrochemical reactions from picosecond to femtosecond. However, this kind of time resolved spectra have a delay time, which means the electrocatalytic reaction time does not match the record time accurately.
4.1 In situ UV-visible spectra
UV-visible spectra is applied to develop the dynamic changes of active species density under a time scale during electrocatalyst reactions from second to millisecond, which can give us the changes of characteristics of the electron absorption spectrum.101,102 Concretely, we monitor the intensity of specific wavelengths as a function of current and voltage by UV-visible spectra, and combine the variation with current polarization and potential dependence of extinction to compute the density of active sites.The Durrant group103 directly detected the density of oxidizing substances as a function of potential in the OER system and determined their role in catalyzing the water oxidation reaction of metal doped NiO. Using in situ UV visible absorption spectroscopy and time-resolved step potential spectroscopy electrochemistry, they inferred that doping NiO can affect the density of oxidized substances formed at a given potential, with Mn doping producing the highest density, followed by Co, Fe, and undoped and Zn doped NiOx due to changes in the energy of oxygen binding energy at the Ni site.104 This enables them to quantitatively define the intrinsic TOF, from Mn to Co and then to Fe doped samples. Based on rate law analysis, we found that the OER current follows second-order behavior relative to the oxidized Ni site, indicating the existence of a mechanism involving oxygen coupling at two adjacent sites. Therefore, we suggest that for Ni centers with strong oxygen binding forces (Mn and Co doping), the rate determining steps for O–O coupling and O removal will hinder the overall reaction rate, while for Ni centers with weak binding oxygen (undoped and Zn doped), the potential determining step for the formation of *O from *OH controls the reaction rate. By correlating the experimentally determined binding energy from the center of the redox peak with the intrinsic TOF, they elucidated the role of binding energy in controlling the reaction rate (Fig. 17).
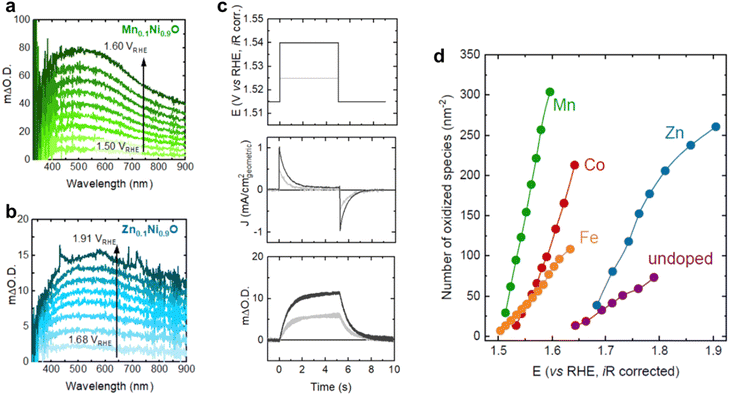 | ||
| Fig. 17 Operando UV-vis spectra as a function of potential for (a) Mn0.1Ni0.9O and (b) Zn0.1Ni0.9O in Fe-free 0.1 M KOH. (c) Representative stepped potential spectroelectrochemistry measurements for Mn0.1Ni0.9O showing the applied potential steps (top panel), measured current density (middle panel), and optical signal (bottom panel) as a function of time. (d) Number of oxidized species accumulated per nm2 of the geometric surface area for all Mn0.1Ni0.9O samples as a function of potential, obtained using steady-state UV-vis spectroscopy measurements. Reprinted with permission from ref. 103 Copyright 2022, American Chemical Society. | ||
4.2 Differential electrochemical mass spectrometry
In situ differential electrochemical mass spectrometry (DEMS) utilizes a water blocking and breathable membrane to rapidly extract the gases and volatile liquids formed during the catalytic reaction process to the internal detector using an internal ultra-high vacuum, thereby achieving a ms level rapid product dynamic response. For the OER process, the LOM or AEM mechanism of the catalytic reaction can be determined using isotope 18O labeling.105,106 It is generally believed that the OER reaction mechanism can be divided into AEM and LOM.107,108 For the AEM reaction path, all the O in the reaction process comes from OH− in the solution, while the O in the LOM comes from the lattice oxygen of the catalyst and the OH− in the solution. Therefore, by exchanging lattice oxygen in the catalyst, we can determine the reaction path through the ratio of 34O and 32O. Specifically, the sample will be an applied potential between 0 to 1 VAg/AgCl or other potential by performing 10–30 CV cycles in K18OH (1 M). Then, 18O remaining on the electrode is removed by rinsing with H216O several times. Last, the electrode is tested in K16OH (1 M) at above the above potential window. The mechanism of the OER is determined by the participation of lattice oxygen from catalysts by measuring the 34O2 signals.105 For the carbon dioxide reduction reaction or other organic small molecule, the product potential dependence can be clarified.109–111 However, DEMS cannot monitor the molecular weight over 100.The Peng group112 further conducted in situ DEMS measurements using isotope 18O to investigate the involvement of lattice oxygen atoms in the OER. They labeled the catalyst surface with 18O and measured the evolution of O2 during the OER process. The evolution of 34O2 reflects the participation of lattice oxygen 11 (34O2 comes from a combination of 18O in the lattice and 16O in water). The proportion of 34O2 generated on SrRuIr is much lower than on RuO2. The content of lattice oxygen participation can be quantified by directly performing OER cycling in an 18O electrolyte. The LOM pathway on SrRuIr was inhibited by 50% compared to RuO2. Most of the evolved O2 is generated through AEM.113 Compared with RuO2, the proportion of OH adsorbed by XPS and lattice O in SrRuIr decreased by 60%, indicating that there is less surface oxygen involved in LOM in SrRuIr (Fig. 18).
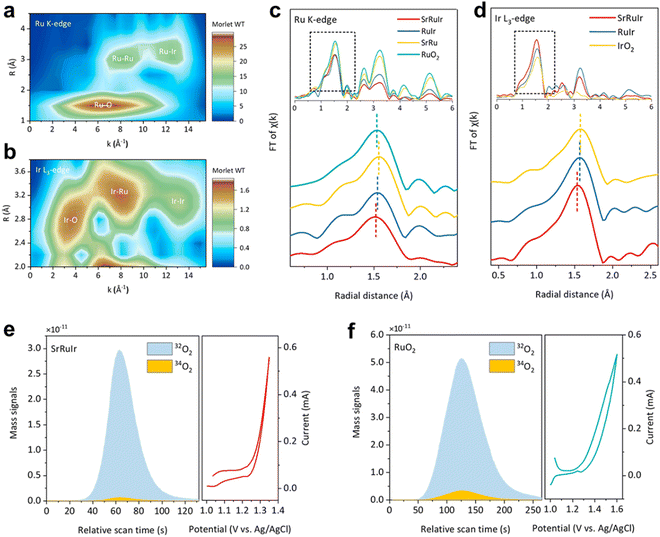 | ||
| Fig. 18 Structure characterization and OER mechanism analysis of SrRuIr oxide electrocatalyst. (a) and (b) Ru K-edge and Ir L3-edge WT-EXAFS spectra of SrRuIr. (c) and (d) Ru K-edge FT-EXAFS spectra (and Ir L3-edge FT-EXAFS spectra of different samples, respectively). (e) and (f) DEMS signals of 32O2 (16O16O) and 34O2 (16O18O) from the reaction products for 18O-labeled SrRuIr and RuO2 catalysts in H218O aqueous sulfuric acid electrolyte and corresponding CV cycles. Reprinted with permission from ref. 112 Copyright 2021, American Chemical Society. | ||
4.3 Electrochemical quartz crystal microbalance
Electrochemical quartz crystal microbalance (EQCM)89,114 detects the quality changes of the catalytic process in real-time with high time resolution based on the relationship between vibration and mass by high-frequency vibration of the loaded catalyst chip, achieving real-time quality response detection.The specific quantitative relationship is as follows:89
| Δf = −Cfm |
Δf – change of frequency, Cf – correction factor, m – the mass change that occurs on the surface of the wafer.
With the help of an electrochemical quartz microbalance, it is possible to analyze the surface reconstruction corrosion, intermediate adsorption and desorption processes, and gas product desorption efficiency during the catalytic process.
The Duan group18 used an electrochemical quartz crystal microbalance to detect the adsorption of benzyl alcohol on Au and Au/CoOOOH. The frequency variation of Au and Au/CoOOH in 1 M potassium hydroxide can be ignored. After adding 0.1 M benzyl alcohol, the initial frequency of the gold sample was negative at 0.4 V. The results indicate that benzyl alcohol can spontaneously adsorb on Au. Due to more adsorption of benzyl alcohol, the frequency of forward scanning increases. As the potential increases, the frequency first increases and then decreases. This may be due to the formation of electrophilic OH* on CoOOH, which accelerates the adsorption of phenyl methanol content. The frequency ultimately decays at a potential of 1.4 VRHE, higher than Au, indicating that the delay in Au inactivation exceeds Au/CoOOH (Fig. 19).
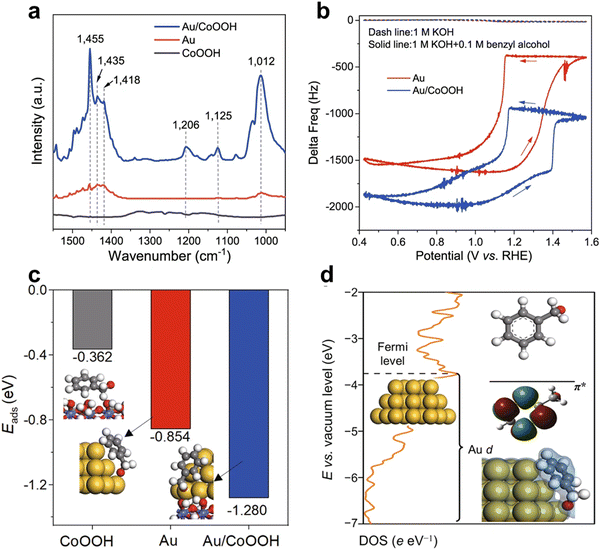 | ||
| Fig. 19 Mechanistic investigation of benzyl alcohol enrichment. (a) FTIR spectra of CoOOH, Au, and Au/CoOOH after benzyl alcohol adsorption and 15 min of the purging. (b) EQCM frequency response over Au and Au/CoOOH in 1 M KOH or 1 M KOH with 0.1 M benzyl alcohol. Scan rate: 50 mV s−1. (c) Adsorption energies of benzyl alcohol in the form of alkoxide on CoOOH, Au, and Au/CoOOH, respectively. The optimized geometries of Ph–CH2O–* for CoOOH, Au, and Au/CoOOH are also displayed. (d) Partial density of states for the Au d orbital in Au/CoOOH, and the energy level of the π* orbital (LUMO) for benzyl alkoxide. Reprinted with permission from ref. 18 Copyright 2022, Springer Nature. | ||
In addition, achieving higher time resolution in situ detection can help researchers analyze reaction processes and mechanisms from the temporal logic of catalytic evolution. On the time scale of femtosecond to picosecond, the bonding and breaking information of molecules can be displayed in real-time, such as constructing femtosecond transient absorption spectra,115 which can clarify the bonding and breaking absorption response behavior of catalytic processes at the femtosecond level to construct corresponding relationships between structure and time evolution behavior. With the further application of femtosecond technology, confocal lifetime imaging technology has also been further developed. By combining confocal imaging technology with in situ catalysis, transient transition imaging with optical spatial resolution can be achieved at the picosecond level. Meanwhile, in situ fluorescence lifetime116 can also elucidate the catalytic reaction mechanism from different perspectives. It is possible to develop higher resolution spectral information to achieve more accurate qualitative and quantitative analysis of fine statistical information.
4.4 Summary
Different instruments exhibit varying temporal resolutions. For researching reaction intermediates, the characterization technique with a millisecond time resolution scale can accomplish this objective. For further understanding of electrocatalytic reaction processes, the characterization technique with a millisecond time resolution scale is not enough. The utilization of pump capture spectroscopy117,118 is necessary for a more comprehensive analysis of the dissociation of chemical bonds. All in all, the selection of spectra with different time resolution scales should be considered for diverse research needs, instead of directly employing high time resolution scale characterization methods.5. Instrument combination
The above in situ techniques can help us comprehend the intermediate states during electrochemical reactions to some extent, but we need to develop a combination of in situ instruments to analyse electrocatalyst reactions deeply. When establishing the technological framework for instrument co-utilization, it is imperative to thoroughly consider the compatibility between instruments in order to ensure non-interference of signals during testing.119,120 When establishing the technological framework for joint instrument utilization, it is imperative to possess comprehensive knowledge of the principles and testing conditions associated with diverse instruments in order to ensure the utmost reliability of test signals. The selection of a combination of instruments generally involves three criteria. Firstly, in accordance with the production process of the instrument signal, the combined instrument ensures non-interference with the original signal. Additionally, through the synergistic utilization of both spectra, a comprehensive investigation into reaction mechanisms is conducted by harnessing their integrated information. For instance, the effective integration of Raman spectroscopy and infrared spectroscopy not only reveals the formation but also elucidates the absorption and desorption processes of reaction intermediates.121 Finally, a novel instrumental co-use technology is developed to analyze the reaction process by integrating three dimensions: spectral resolution, spatial resolution, and temporal resolution with high spatiotemporal precision.A new combination of Raman and UV absorption spectroelectrochemistry in reflection mode was proposed, which provided the simultaneous obtention of electrochemical, electronic, and vibrational information in the same experiment and the processes taking place on the electrode/solution interface. In addition, in situ FT-IR and DEMS can be applied for simultaneously detection,122,123 in which FT-IR is used to study the adsorption and desorption of material surface and DEMS can determine the product in the meantime. Combining FT-IR with DEMS is particularly suitable for the CO2RR, and provides the chemical properties and adsorption configuration of reaction intermediates absorbed on the electrode surface and the kind and quantity of product, explicating the mechanism of electrocatalytic reactions in depth. Furthermore, synchrotron radiation infrared spectroscopy (SR-FTIR)124,125 is a method of infrared spectrum analysis using a synchrotron radiation source, which can monitor intermediates and products and the process of chemical reactions on the surface of electrocatalysts. A combination of in situ instruments for developing electrocatalyst reactions still has potential, and we need to construct techniques to monitor the changes under multispectral resolution, spatially resolved and time resolved in the meantime. Developing multi-spectral coupling technology achieves synchronous monitoring of complementary spectroscopy and corresponding spectroscopy to make the comprehensive utilization of time resolution, spatial resolution, and spectral resolution.
6. Conclusions
This article discusses existing and some potential in situ analysis techniques, and introduces the current applications and characteristics of electrocatalytic in situ analysis methods from spectroscopic resolution, spatial resolution, temporal resolution and multispectral combination methods. The application of in situ characterization technology can effectively facilitate our comprehension of the reaction process and provide guidance for the design of catalysts with functional application oriented. The changes occurring in the atomic structure of the catalyst surface during electrocatalytic reactions remain unclear. Spectra captured on a femtosecond time scale enable observation of the ultrafast electron transfer processes126 and sub-nanometer electron microscopy allows for clear visualization of the dynamic evolution of active sites on the catalyst.127 In the future, our focus will be on employing in situ characterization techniques with enhanced spatio-temporal resolution and heightened sensitivity and accuracy. In terms of application, in situ characterization technology will be directed towards more diverse reaction systems, including organic oxidation, organic synthesis, and other intricate systems. For practical working conditions,128in situ characterization techniques will encounter high temperature, high pressure, and high concentration reaction systems to comprehend the transformation behavior of electrocatalysts in industrial applications. The focus for instruments and equipment will be on the development of miniaturization, automation, and intelligence.129Author contributions
S. W. and Y. Y. contributed equally to this work. Q. X. investigated the literature. P. X. revised the manuscript. All authors have given approval to the final version of the manuscript.Conflicts of interest
There are no conflicts to declare.Acknowledgements
We acknowledge support from the National Key R&D Program of China (2021YFA1501101), the National Natural Science Foundation of China (no. 22221001, 22271124, and 21931001), the Special Fund Project of Guiding Scientific and Technological Innovation Development of Gansu Province (2019ZX-04), and the 111 Project (B20027), as well as the Fundamental Research Funds for the Central Universities (lzujbky-2022-it33, lzujbky-2024-it01).Notes and references
- H. Li, Y. Lin, J. Duan, Q. Wen, Y. Liu and T. Zhai, Chem. Soc. Rev., 2024, 53, 10709–10740 RSC.
- A. Kulkarni, S. Siahrostami, A. Patel and J. K. Nørskov, Chem. Rev., 2018, 118, 2302–2312 CrossRef CAS.
- M. Jiang, H. Wang, M. Zhu, X. Luo, Y. He, M. Wang, C. Wu, L. Zhang, X. Li, X. Liao, Z. Jiang and Z. Jin, Chem. Soc. Rev., 2024, 53, 5149–5189 RSC.
- J. Timoshenko and B. Roldan Cuenya, Chem. Rev., 2021, 121, 882–961 CrossRef CAS.
- C. Chen, H. Jin, P. Wang, X. Sun, M. Jaroniec, Y. Zheng and S.-Z. Qiao, Chem. Soc. Rev., 2024, 53, 2022–2055 RSC.
- Y. Jiao, Y. Zheng, M. Jaroniec and S. Z. Qiao, Chem. Soc. Rev., 2015, 44, 2060–2086 RSC.
- W. Shen, P. Da, L. Guo, P. Xi and C.-H. Yan, Acc. Mater. Res., 2024, 5, 712–725 CrossRef CAS.
- R. Wu, Q. Meng, J. Yan, Z. Zhang, B. Chen, H. Liu, J. Tai, G. Zhang, L. Zheng, J. Zhang and B. Han, Nat. Catal., 2024, 7, 702–718 CrossRef CAS.
- C.-Y. Li and Z.-Q. Tian, Chem. Soc. Rev., 2024, 53, 3579–3605 RSC.
- S. Dery, B. Friedman, H. Shema and E. Gross, Chem. Rev., 2023, 123, 6003–6038 CrossRef CAS PubMed.
- S. Wei, S. J. Kim, J. Kang, Y. Zhang, Y. Zhang, T. Furuhara, E. S. Park and C. C. Tasan, Nat. Mater., 2020, 19, 1175–1181 CrossRef CAS.
- Z. Dong, M. Huo, J. Li, J. Li, P. Li, H. Sun, L. Gu, Y. Lu, M. Wang, Y. Wang and Z. Chen, Nature, 2024, 630, 847–852 CrossRef CAS PubMed.
- M. Chen, D. Liu, L. Qiao, P. Zhou, J. Feng, K. W. Ng, Q. Liu, S. Wang and H. Pan, Chem. Eng. J., 2023, 461, 141939 CrossRef CAS.
- Y.-H. Wang, S. Zheng, W.-M. Yang, R.-Y. Zhou, Q.-F. He, P. Radjenovic, J.-C. Dong, S. Li, J. Zheng, Z.-L. Yang, G. Attard, F. Pan, Z.-Q. Tian and J.-F. Li, Nature, 2021, 600, 81–85 CrossRef CAS PubMed.
- H. Liu, T. Yan, S. Tan, L. Sun, Z. Zhang, S. Hu, S.-H. Li, X. Kang, Y. Lei, L. Jiang, T. Hou, L. Liu, Q. Yu and B. Liu, J. Am. Chem. Soc., 2024, 146, 5333–5342 CrossRef CAS.
- J.-s Zhu, H. Yang, W. Zhang, Y. Mao, S.-s Lyu and J. Chen, Inorg. Chem. Front., 2020, 7, 1892–1899 RSC.
- J.-C. Dong, X.-G. Zhang, V. Briega-Martos, X. Jin, J. Yang, S. Chen, Z.-L. Yang, D.-Y. Wu, J. M. Feliu, C. T. Williams, Z.-Q. Tian and J.-F. Li, Nat. Energy, 2019, 4, 60–67 CrossRef CAS.
- Z. Li, Y. Yan, S.-M. Xu, H. Zhou, M. Xu, L. Ma, M. Shao, X. Kong, B. Wang, L. Zheng and H. Duan, Nat. Commun., 2022, 13, 147 CrossRef CAS PubMed.
- Z. Xu, Z. Liang, W. Guo and R. Zou, Coord. Chem. Rev., 2021, 436, 213824 CrossRef CAS.
- D. Bagchi, J. Raj, A. K. Singh, A. Cherevotan, S. Roy, K. S. Manoj, C. P. Vinod and S. C. Peter, Adv. Mater., 2022, 34, 2109426 CrossRef CAS.
- Z. Zhou, L. Palatinus and J. Sun, Inorg. Chem. Front., 2016, 3, 1351–1362 RSC.
- F. Kimura and T. Kimura, CrystEngComm, 2018, 20, 861–872 RSC.
- X. Ma, Y. Ma, A. M. Nolan, J. Bai, W. Xu, Y. Mo and H. Chen, ACS Mater. Lett., 2023, 5, 979–984 CrossRef CAS PubMed.
- Y. Jiang, H. Li, C. Chen, Y. Zheng and S.-Z. Qiao, ACS Catal., 2024, 14, 8310–8316 CrossRef CAS.
- S. Yang, H. An, S. Arnouts, H. Wang, X. Yu, J. de Ruiter, S. Bals, T. Altantzis, B. M. Weckhuysen and W. van der Stam, Nat. Catal., 2023, 6, 796–806 CrossRef CAS.
- E. M. Carstea, J. Bridgeman, A. Baker and D. M. Reynolds, Water Res., 2016, 95, 205–219 CrossRef CAS.
- W. Li, W. Yao, J. Wang, Z. Qiu, J. Tang, S. Yang, M. Zhu, Z. Xu, R. Hu, A. Qin and B. Z. Tang, RSC Adv., 2017, 7, 41127–41135 RSC.
- B. Wang, J.-H. Liu, J. Yu, J. Lv, C. Dong and J.-R. Li, J. Hazard. Mater., 2020, 382, 121018 CrossRef CAS.
- J. Wang, K. Wang, F.-B. Wang and X.-H. Xia, Nat. Commun., 2014, 5, 5285 CrossRef CAS PubMed.
- L. Zhong, D. Chen and S. Zafeiratos, Catal. Sci. Technol., 2019, 9, 3851–3867 RSC.
- L. Nguyen, F. F. Tao, Y. Tang, J. Dou and X.-J. Bao, Chem. Rev., 2019, 119, 6822–6905 CrossRef PubMed.
- H. Ali-Löytty, M. W. Louie, M. R. Singh, L. Li, H. G. Sanchez Casalongue, H. Ogasawara, E. J. Crumlin, Z. Liu, A. T. Bell, A. Nilsson and D. Friebel, J. Phys. Chem. C, 2016, 120, 2247–2253 CrossRef.
- Y. Han, H. Zhang, Y. Yu and Z. Liu, ACS Catal., 2021, 11, 1464–1484 CrossRef CAS.
- K. Du, L. Zhang, J. Shan, J. Guo, J. Mao, C.-C. Yang, C.-H. Wang, Z. Hu and T. Ling, Nat. Commun., 2022, 13, 5448 CrossRef CAS.
- J. Wang, S.-J. Kim, J. Liu, Y. Gao, S. Choi, J. Han, H. Shin, S. Jo, J. Kim, F. Ciucci, H. Kim, Q. Li, W. Yang, X. Long, S. Yang, S.-P. Cho, K. H. Chae, M. G. Kim, H. Kim and J. Lim, Nat. Catal., 2021, 4, 212–222 CrossRef CAS.
- S. Song, J. Zhou, X. Su, Y. Wang, J. Li, L. Zhang, G. Xiao, C. Guan, R. Liu, S. Chen, H.-J. Lin, S. Zhang and J.-Q. Wang, EES, 2018, 11, 2945–2953 CAS.
- J. W. Smith and R. J. Saykally, Chem. Rev., 2017, 117, 13909–13934 CrossRef CAS PubMed.
- S. K. Beaumont, Phys. Chem. Chem. Phys., 2020, 22, 18747–18756 RSC.
- H. Huang and A. E. Russell, Curr. Opin. Electrochem., 2021, 27, 100681 CrossRef CAS.
- T. Maiyalagan, K. A. Jarvis, S. Therese, P. J. Ferreira and A. Manthiram, Nat. Commun., 2014, 5, 3949 CrossRef CAS.
- J. Ismail, M. F. Ahmed and P. Vishnu Kamath, J. Power Sources, 1991, 36, 507–516 CrossRef CAS.
- M. A. Augustyniak-Jabłokow, R. Strzelczyk and R. Fedaruk, Carbon, 2020, 168, 665–672 CrossRef.
- Y. Bai, Z. Wang, N. Qin, D. Ma, W. Fu, Z. Lu and X. Pan, Angew. Chem., Int. Ed., 2023, 62, e202303162 CrossRef CAS PubMed.
- M. M. Roessler and E. Salvadori, Chem. Soc. Rev., 2018, 47, 2534–2553 RSC.
- D. Hollmann, F. Gärtner, R. Ludwig, E. Barsch, H. Junge, M. Blug, S. Hoch, M. Beller and A. Brückner, Angew. Chem., Int. Ed., 2011, 50, 10246–10250 CrossRef CAS.
- C.-E. Dutoit, M. Tang, D. Gourier, J.-M. Tarascon, H. Vezin and E. Salager, Nat. Commun., 2021, 12, 1410 CrossRef CAS PubMed.
- X. Li, C.-S. Cao, S.-F. Hung, Y.-R. Lu, W. Cai, A. I. Rykov, S. Miao, S. Xi, H. Yang, Z. Hu, J. Wang, J. Zhao, E. E. Alp, W. Xu, T.-S. Chan, H. Chen, Q. Xiong, H. Xiao, Y. Huang, J. Li, T. Zhang and B. Liu, Chem, 2020, 6, 3440–3454 CAS.
- V. Mereacre, Angew. Chem., Int. Ed., 2012, 51, 9922–9925 CrossRef CAS PubMed.
- U. I. Kramm, L. Ni and S. Wagner, Adv. Mater., 2019, 31, 1805623 CrossRef.
- V. De Coster, N. V. Srinath, S. A. Theofanidis, L. Pirro, A. Van Alboom, H. Poelman, M. K. Sabbe, G. B. Marin and V. V. Galvita, Appl. Catal., B, 2022, 300, 120720 CrossRef CAS.
- Z. Kuang, S. Liu, X. Li, M. Wang, X. Ren, J. Ding, R. Ge, W. Zhou, A. I. Rykov, M. T. Sougrati, P.-E. Lippens, Y. Huang and J. Wang, J. Energy Chem., 2021, 57, 212–218 CrossRef CAS.
- R. I. Corona, J.-H. Seo, X. Lin, D. J. Hazelett, J. Reddy, M. A. S. Fonseca, F. Abassi, Y. G. Lin, P. Y. Mhawech-Fauceglia, S. P. Shah, D. G. Huntsman, A. Gusev, B. Y. Karlan, B. P. Berman, M. L. Freedman, S. A. Gayther and K. Lawrenson, Nat. Commun., 2020, 11, 2020 CrossRef CAS PubMed.
- J. Y. C. Chen, L. Dang, H. Liang, W. Bi, J. B. Gerken, S. Jin, E. E. Alp and S. S. Stahl, J. Am. Chem. Soc., 2015, 137, 15090–15093 CrossRef CAS.
- S.-H. Cao, Z.-R. Ni, L. Huang, H.-J. Sun, B. Tang, L.-J. Lin, Y.-Q. Huang, Z.-Y. Zhou, S.-G. Sun and Z. Chen, Anal. Chem., 2017, 89, 3810–3813 CrossRef CAS.
- Y.-F. Bao, M.-Y. Zhu, X.-J. Zhao, H.-X. Chen, X. Wang and B. Ren, Chem. Soc. Rev., 2024, 53, 10044–10079 RSC.
- C. Heng-Quan, Z. Lie, W. Di-Ye, Z. Ling-Ling, W. Yuan-Fei, Z. Hua and L. Jian-Feng, Chin. J. Catal., 2021, 43, 33–46 Search PubMed.
- L. Zhang, X. Yang, Q. Yuan, Z. Wei, J. Ding, T. Chu, C. Rong, Q. Zhang, Z. Ye, F.-Z. Xuan, Y. Zhai, B. Zhang and X. Yang, Nat. Commun., 2023, 14, 8311 CrossRef PubMed.
- H. Cha, J. Ma, Y. S. Kim, L. Li, L. Sun, J. Tong and N. Miljkovic, ACS Nano, 2019, 13, 13343–13353 CrossRef CAS.
- S. Muhammad, F. Yunshan, H. Rui and Z. Bo, Nano Energy, 2021, 90, 106539 CrossRef.
- M.-J. Zhu, J.-B. Pan, Z.-Q. Wu, X.-Y. Gao, W. Zhao, X.-H. Xia, J.-J. Xu and H.-Y. Chen, Angew. Chem., Int. Ed., 2018, 57, 4010–4014 CrossRef CAS.
- M. M. Richter, Chem. Rev., 2004, 104, 3003–3036 CrossRef CAS.
- T. Tsuda, K. Hosoya, T. Sano and S. Kuwabata, Electrochim. Acta, 2019, 319, 158–163 CrossRef CAS.
- C. Barroo, Z.-J. Wang and M. G. Willinger, Microsc. Microanal., 2019, 25, 510–511 CrossRef.
- Z. Li, W. Niu, L. Zhou and Y. Yang, ACS Energy Lett., 2018, 3, 1562–1563 CrossRef CAS.
- Y. Yang, Y.-T. Shao, X. Lu, Y. Yang, H.-Y. Ko, R. A. DiStasio, Jr., F. J. DiSalvo, D. A. Muller and H. D. Abruña, J. Am. Chem. Soc., 2022, 144, 15698–15708 CrossRef CAS PubMed.
- H. Zheng, D. Xiao, X. Li, Y. Liu, Y. Wu, J. Wang, K. Jiang, C. Chen, L. Gu, X. Wei, Y.-S. Hu, Q. Chen and H. Li, Nano Lett., 2014, 14, 4245–4249 CrossRef CAS PubMed.
- C. Cui, H. Yang, C. Zeng, S. Gui, J. Liang, P. Xiao, S. Wang, G. Huang, M. Hu, T. Zhai and H. Li, Sci. Adv., 2022, 8, eadd2000 CrossRef CAS PubMed.
- I. Seo, Y. Kim and S. W. Martin, J. Alloys Compd., 2016, 661, 245–250 CrossRef CAS.
- S. Hwang, X. Chen, G. Zhou and D. Su, Adv. Energy Mater., 2020, 10, 1902105 CrossRef CAS.
- S. Zhou, J. Shi, S. Liu, G. Li, F. Pei, Y. Chen, J. Deng, Q. Zheng, J. Li, C. Zhao, I. Hwang, C.-J. Sun, Y. Liu, Y. Deng, L. Huang, Y. Qiao, G.-L. Xu, J.-F. Chen, K. Amine, S.-G. Sun and H.-G. Liao, Nature, 2023, 621, 75–81 CrossRef CAS.
- A. R. Poerwoprajitno, L. Gloag, J. Watt, S. Cheong, X. Tan, H. Lei, H. A. Tahini, A. Henson, B. Subhash, N. M. Bedford, B. K. Miller, P. B. O’Mara, T. M. Benedetti, D. L. Huber, W. Zhang, S. C. Smith, J. J. Gooding, W. Schuhmann and R. D. Tilley, Nat. Catal., 2022, 5, 231–237 CrossRef CAS.
- L. Xiao, Q. Zheng, S. Luo, Y. Ying, R. Zhou, S. Zhou, X. Li, X. Ye, Z. Yu, Q. Xu, H. Liao and J. Xu, Sci. Adv., 2024, 10, eadn2707 CrossRef CAS.
- F. G. Coury, C. Miller, R. Field and M. Kaufman, Nature, 2023, 622, 742–747 CrossRef CAS.
- Y. Hu, Y. Zheng, J. Jin, Y. Wang, Y. Peng, J. Yin, W. Shen, Y. Hou, L. Zhu, L. An, M. Lu, P. Xi and C.-H. Yan, Nat. Commun., 2023, 14, 1949 CrossRef CAS.
- L. Sellies, R. Spachtholz, S. Bleher, J. Eckrich, P. Scheuerer and J. Repp, Nature, 2023, 624, 64–68 CrossRef CAS.
- A. Zavabeti, J. Z. Ou, B. J. Carey, N. Syed, R. Orrell-Trigg, E. L. H. Mayes, C. Xu, O. Kavehei, A. P. O’Mullane, R. B. Kaner, K. Kalantar-zadeh and T. Daeneke, Science, 2017, 358, 332–335 CrossRef CAS PubMed.
- R. Zhang, W. S. Fall, K. W. Hall, G. A. Gehring, X. Zeng and G. Ungar, Nat. Commun., 2021, 12, 1710 CrossRef CAS.
- A. Yurtsever, P.-X. Wang, F. Priante, Y. Morais Jaques, K. Miyazawa, M. J. MacLachlan, A. S. Foster and T. Fukuma, Sci. Adv., 2022, 8, eabq0160 CrossRef CAS PubMed.
- Y. Wang, C. Chen, X. Xiong, S. A. Skaanvik, Y. Zhang, E. D. Bøjesen, Z. Wang, W. Liu and M. Dong, J. Am. Chem. Soc., 2024, 146, 17032–17040 CrossRef CAS.
- M. R. Nellist, F. A. L. Laskowski, J. Qiu, H. Hajibabaei, K. Sivula, T. W. Hamann and S. W. Boettcher, Nat. Energy, 2018, 3, 46–52 CrossRef CAS.
- L. Gross, B. Schuler, N. Pavliček, S. Fatayer, Z. Majzik, N. Moll, D. Peña and G. Meyer, Angew. Chem., Int. Ed., 2018, 57, 3888–3908 CrossRef CAS.
- Y. Zhang, Y. Miyahara, N. Derriche, W. Yang, K. Yazda, X. Capaldi, Z. Liu, P. Grutter and W. Reisner, Small Methods, 2019, 3, 1900147 CrossRef.
- M. Munz, J. Poon, W. Frandsen, B. R. Cuenya and C. S. Kley, J. Am. Chem. Soc., 2023, 145, 5242–5251 CrossRef CAS.
- J. T. Mefford, A. R. Akbashev, M. Kang, C. L. Bentley, W. E. Gent, H. D. Deng, D. H. Alsem, Y.-S. Yu, N. J. Salmon, D. A. Shapiro, P. R. Unwin and W. C. Chueh, Nature, 2021, 593, 67–73 CrossRef CAS.
- Y. Liang, J. H. K. Pfisterer, D. McLaughlin, C. Csoklich, L. Seidl, A. S. Bandarenka and O. Schneider, Small Methods, 2019, 3, 1800387 CrossRef.
- M. Burgess, K. Hernández-Burgos, K. J. Cheng, J. S. Moore and J. Rodríguez-López, Analyst, 2016, 141, 3842–3850 RSC.
- C. Santana Santos, B. N. Jaato, I. Sanjuán, W. Schuhmann and C. Andronescu, Chem. Rev., 2023, 123, 4972–5019 CrossRef CAS PubMed.
- T. S. Watkins, D. Sarbapalli, M. J. Counihan, A. S. Danis, J. Zhang, L. Zhang, K. R. Zavadil and J. Rodríguez-López, J. Mater. Chem. A, 2020, 8, 15734–15745 RSC.
- Y. Ji, Z.-W. Yin, Z. Yang, Y.-P. Deng, H. Chen, C. Lin, L. Yang, K. Yang, M. Zhang, Q. Xiao, J.-T. Li, Z. Chen, S.-G. Sun and F. Pan, Chem. Soc. Rev., 2021, 50, 10743–10763 RSC.
- M. C. O. Monteiro, F. Dattila, B. Hagedoorn, R. García-Muelas, N. López and M. T. M. Koper, Nat. Catal., 2021, 4, 654–662 CrossRef CAS.
- O. Ilchenko, Y. Pilgun, A. Kutsyk, F. Bachmann, R. Slipets, M. Todeschini, P. O. Okeyo, H. F. Poulsen and A. Boisen, Nat. Commun., 2019, 10, 5555 CrossRef CAS PubMed.
- S. C. M. Reinhardt, L. A. Masullo, I. Baudrexel, P. R. Steen, R. Kowalewski, A. S. Eklund, S. Strauss, E. M. Unterauer, T. Schlichthaerle, M. T. Strauss, C. Klein and R. Jungmann, Nature, 2023, 617, 711–716 CrossRef CAS.
- H.-Y. Du, Y.-F. Huang, D. Wong, M.-F. Tseng, Y.-H. Lee, C.-H. Wang, C.-L. Lin, G. Hoffmann, K.-H. Chen and L.-C. Chen, Nat. Commun., 2021, 12, 1321 CrossRef CAS PubMed.
- C. Bozal-Ginesta, R. R. Rao, C. A. Mesa, X. Liu, S. A. J. Hillman, I. E. L. Stephens and J. R. Durrant, ACS Catal., 2021, 11, 15013–15025 CrossRef CAS.
- J. Goetze, F. Meirer, I. Yarulina, J. Gascon, F. Kapteijn, J. Ruiz-Martínez and B. M. Weckhuysen, ACS Catal., 2017, 7, 4033–4046 CrossRef CAS.
- G. Walch, B. Rotter, G. C. Brunauer, E. Esmaeili, A. K. Opitz, M. Kubicek, J. Summhammer, K. Ponweiser and J. Fleig, J. Mater. Chem. A, 2017, 5, 1637–1649 RSC.
- K. Ye, G. Zhang, X.-Y. Ma, C. Deng, X. Huang, C. Yuan, G. Meng, W.-B. Cai and K. Jiang, EES, 2022, 15, 749–759 CAS.
- H. Wu, Y. Wang, Z. Shi, D. Han, J. Yang, P. Wang, J. Ni, M. Xiao, C. Liu and W. Xing, J. Phys. Chem. C, 2023, 127, 12541–12547 CrossRef CAS.
- M. Hu, Y. Wang, Z. Chen, S. Ning and Y. Wei, Electrochim. Acta, 2023, 443, 141963 CrossRef CAS.
- B. Doppagne, T. Neuman, R. Soria-Martinez, L. E. P. López, H. Bulou, M. Romeo, S. Berciaud, F. Scheurer, J. Aizpurua and G. Schull, Nat. Nanotechnol., 2020, 15, 207–211 CrossRef CAS.
- D. Zhang, R. Wang, X. Wang and Y. Gogotsi, Nat. Energy, 2023, 8, 567–576 CrossRef CAS.
- W. Shen, Y. Zheng, Y. Hu, J. Jin, Y. Hou, N. Zhang, L. An, P. Xi and C.-H. Yan, J. Am. Chem. Soc., 2024, 146, 5324–5332 CrossRef CAS.
- R. R. Rao, S. Corby, A. Bucci, M. García-Tecedor, C. A. Mesa, J. Rossmeisl, S. Giménez, J. Lloret-Fillol, I. E. L. Stephens and J. R. Durrant, J. Am. Chem. Soc., 2022, 144, 7622–7633 CrossRef CAS PubMed.
- L. Francàs, S. Corby, S. Selim, D. Lee, C. A. Mesa, R. Godin, E. Pastor, I. E. L. Stephens, K.-S. Choi and J. R. Durrant, Nat. Commun., 2019, 10, 5208 CrossRef.
- M. Lu, Y. Zheng, Y. Hu, B. Huang, D. Ji, M. Sun, J. Li, Y. Peng, R. Si, P. Xi and C.-H. Yan, Sci. Adv., 2022, 8, eabq3563 CrossRef CAS PubMed.
- X. Wang, H. Zhong, S. Xi, W. S. V. Lee and J. Xue, Adv. Mater., 2022, 34, 2107956 CrossRef CAS.
- M. Lu, Y. Zheng, Y. Hu, B. Huang, D. Ji, M. Sun, J. Li, Y. Peng, R. Si, P. Xi and C.-H. Yan, Sci. Adv., 2022, 8, eabq3563 CrossRef CAS.
- H. Zhao, L. Zhu, J. Yin, J. Jin, X. Du, L. Tan, Y. Peng, P. Xi and C.-H. Yan, Angew. Chem., Int. Ed., 2024, 63, e202402171 CrossRef CAS.
- C. J. Bondue, M. Graf, A. Goyal and M. T. M. Koper, J. Am. Chem. Soc., 2021, 143, 279–285 CrossRef CAS PubMed.
- R. Zeng, Y. Yang, T. Shen, H. Wang, Y. Xiong, J. Zhu, D. Wang and H. D. Abruña, ACS Catal., 2020, 10, 770–776 CrossRef CAS.
- S. Möller, S. Barwe, J. Masa, D. Wintrich, S. Seisel, H. Baltruschat and W. Schuhmann, Angew. Chem., Int. Ed., 2020, 59, 1585–1589 CrossRef.
- Y. Wen, P. Chen, L. Wang, S. Li, Z. Wang, J. Abed, X. Mao, Y. Min, C. T. Dinh, P. D. Luna, R. Huang, L. Zhang, L. Wang, L. Wang, R. J. Nielsen, H. Li, T. Zhuang, C. Ke, O. Voznyy, Y. Hu, Y. Li, W. A. Goddard Iii, B. Zhang, H. Peng and E. H. Sargent, J. Am. Chem. Soc., 2021, 143, 6482–6490 CrossRef CAS PubMed.
- J. Song, C. Wei, Z.-F. Huang, C. Liu, L. Zeng, X. Wang and Z. J. Xu, Chem. Soc. Rev., 2020, 49, 2196–2214 RSC.
- X. Lu and H. D. Abruña, ACS Appl. Mater. Interfaces, 2021, 13, 10979–10986 CrossRef CAS PubMed.
- L. Guo, Y. Wang and H. P. Lu, J. Am. Chem. Soc., 2010, 132, 1999–2004 CrossRef CAS PubMed.
- J. C. Thiele, D. A. Helmerich, N. Oleksiievets, R. Tsukanov, E. Butkevich, M. Sauer, O. Nevskyi and J. Enderlein, ACS Nano, 2020, 14, 14190–14200 CrossRef CAS.
- Q. Wang, L. Yun and J. Yang, CCS Chem., 2024, 6, 1092–1109 CrossRef CAS.
- S. Li, L. Lu, S. Bhattacharyya, C. Pearce, K. Li, E. T. Nienhuis, G. Doumy, R. D. Schaller, S. Moeller, M.-F. Lin, G. Dakovski, D. J. Hoffman, D. Garratt, K. A. Larsen, J. D. Koralek, C. Y. Hampton, D. Cesar, J. Duris, Z. Zhang, N. Sudar, J. P. Cryan, A. Marinelli, X. Li, L. Inhester, R. Santra and L. Young, Science, 2024, 383, 1118–1122 CrossRef CAS PubMed.
- X. Meng, Z. Bi, X. Wang and G. Shang, Rev. Sci. Instrum., 2022, 93, 083535 Search PubMed.
- J. Song, Z.-X. Qian, J. Yang, X.-M. Lin, Q. Xu and J.-F. Li, ACS Energy Lett., 2024, 9, 4414–4440 CrossRef CAS.
- X. Chang, S. Vijay, Y. Zhao, N. J. Oliveira, K. Chan and B. Xu, Nat. Commun., 2022, 13, 2656 CrossRef CAS PubMed.
- J. Sun, H. Yang, W. Gao, T. Cao and G. Zhao, Angew. Chem., Int. Ed., 2022, 61, e202211373 CrossRef CAS PubMed.
- E. Pastor, S. González and A. J. Arvia, J. Electroanal. Chem., 1995, 395, 233–242 CrossRef.
- C. Chen, S. Li, X. Zhu, S. Bo, K. Cheng, N. He, M. Qiu, C. Xie, D. Song, Y. Liu, W. Chen, Y. Li, Q. Liu, C. Li and S. Wang, Carbon Energy, 2023, 10, e345 CrossRef.
- Y.-C. Lee, C.-C. Chiang, P.-Y. Huang, C.-Y. Chung, T. D. Huang, C.-C. Wang, C.-I. Chen, R.-S. Chang, C.-H. Liao and R. R. Reisz, Nat. Commun., 2017, 8, 14220 CrossRef CAS PubMed.
- W. Hu, P. N. Prasad and W. Huang, Acc. Chem. Res., 2021, 54, 697–706 CrossRef CAS.
- H. Park, H. Park, K. Song, S. H. Song, S. Kang, K.-H. Ko, D. Eum, Y. Jeon, J. Kim, W. M. Seong, H. Kim, J. Park and K. Kang, Nat. Chem., 2022, 14, 614–622 CrossRef CAS.
- R. Amirbeigiarab, J. Tian, A. Herzog, C. Qiu, A. Bergmann, B. Roldan Cuenya and O. M. Magnussen, Nat. Catal., 2023, 6, 837–846 CrossRef CAS.
- R. B. Araujo and T. Edvinsson, ACS Catal., 2024, 14, 3742–3755 CrossRef CAS.
Footnote |
| † These authors contributed equally to this work. |
| This journal is © The Royal Society of Chemistry 2025 |

