 Open Access Article
Nanoscale visualization of the anti-tumor effect of a plasma-activated Ringer's lactate solution†
Junichi
Usuda
a,
Kenshin
Yagyu
a,
Hiromasa
Tanaka
*c,
Masaru
Hori
c,
Kenji
Ishikawa
c and
Yasufumi
Takahashi
 *ab
*ab
aDepartment of Electronics, Graduate School of Engineering, Nagoya University, Nagoya 464-8603, Japan. E-mail: takahashi.yasufumi.v5@f.mail.nagoya-u.ac.jp
bNano Life Science Institute (WPI-NanoLSI), Kanazawa University, Kanazawa 920-1192, Japan
cCenter for Low-Temperature Plasma Sciences, Nagoya University, Furo-cho, Chikusa-ku, Nagoya 464-8601, Japan
First published on 16th July 2024
Abstract
Plasma-activated Ringer's lactate solutions (PALs), which are Ringer's lactate solutions treated with non-thermal atmospheric-pressure plasma, have an anti-tumor effect and can be used for chemotherapy. As the anti-tumor effect of the PAL is influenced by the cell-treatment time, it is necessary to monitor the structural changes of the cell surface with non-invasive, nanoscale, and time-lapse imaging to understand the anti-tumor effect. In this study, to characterize the anti-tumor effect of the PAL, we used scanning ion conductance microscopy (SICM), using glass nanopipettes as probes, to visualize the structural changes of the cell surface. SICM time-lapse topographic imaging visualized a decrease in the movement of lamellipodia in normal cells and cancer cells after the PAL treatment. Furthermore, in normal cells, protrusive structures were observed on the cell surface. Time-lapse imaging using SICM allowed us to characterize the differences in the morphological changes between the normal and cancer cells upon exposure to the PAL.
1 Introduction
Non-thermal atmospheric-pressure plasma has been recently employed for medical applications.1 Further, a Ringer's lactate solution irradiated with non-thermal plasma exhibits selective toxicity toward cancer cells and induces apotosis.2 The induction of apoptosis by plasma-activated Ringer's lactate solutions (PALs) was initially thought to be caused by reactive oxygen species (ROS), but recently it has been found that sodium 2,3-tartrate produced by low-temperature plasma is the key chemical.3 However, until now, most evaluations of the anti-tumor effect of PAL have mainly been based on multicellular systems for characterizing the apoptosis, viability,2 and gene expression state.4 There are no examples for measuring the behaviors at the single-cell level with high spatial resolution. Therefore, non-invasive imaging technology is required to observe the effects of PAL on the cell structure on a subcellular scale.The structural changes in cells caused by the PAL have been suggested to be attributed to ferroptosis5 and the downregulation of the phosphoinositide 3-kinase (PI3K)/protein kinase B (AKT) signal transduction pathway.4 Ferroptosis is cell death caused by generated ROS catalyzed by intracellular free iron (Fe2+).6 The protrusion formation on cells treated with RAS-selective lethal 3, a ferroptosis activator, has been visualized by atomic force microscopy (AFM).7 Further, the downregulation of the PI3K/AKT signaling pathway is considered a factor that causes the structural changes by the PAL.4 Therefore, live-cell imaging technology with high spatial resolution is essential to understand the details of such structural changes.
Scanning ion conductance microscopy (SICM) is a scanning probe microscopy technique that enables the non-invasive and nanoscale resolution imaging of living cells using a glass nanopipette.8–14 The high spatial resolution of the SICM is effective for visualizing the nanoscale and fragile structures on cell surfaces, such as synaptic boutons,15–17 cell surface microvilli,18,19 endocytic pits,20,21 and primary cilia,22 which are difficult to visualize without labeling using optical microscopy. Additionally, because of its capability for live-cell imaging, it has been employed to investigate the structural changes induced by changes in hypertonic stress19 or micropinocytosis inhibitor characterization.23 Temporal resolution is a crucial factor for understanding the dynamics of cell topographic change, and advancements in imaging speed have been achieved through hardware and software innovations.16,17,20,24 Spatial resolution relies on the miniaturization of the nanopipette, and nanopipettes with diameters below 20 nm are fabricated by the innovation of the nanopipette fabrication process.18,21
In this study, we visualized the PAL-induced structural changes of the surfaces of normal and cancer cells by SICM time-lapse imaging. The structural changes include the suspension of lamellipodia movement, the increase in cell volume, and the formation of protrusions of several microns on the cell surface.
2 Material and methods
2.1 Cell lines and culture
MCF-7 (human breast cancer cell line) and MCF-10A cells (human mammary epithelial cell line) were grown in Dulbecco's Modified Eagle Medium (Sigma-Aldrich, St. Louis, MO) supplemented with 10% fetal bovine serum and penicillin (100 U mL−1)–streptomycin (100 μg mL; P/S) under an atmosphere of 5% CO2 at 37 °C.2.2 Live-cell optical imaging
The live-cell optical imaging was performed using an Incucyte SX5 Live-Cell Analysis System (Sartorius, Gottingen, Germany). Cells were seeded in a 3 mL medium in a 6-well plate. On the following day, the 6-well plate was set in the Incucyte system, and time-lapse imaging was performed every 5 min. Thereafter, 8 mL of the Ringer's lactate solution in a 60 mm dish was treated with plasma (L = 3 or 13 mm, 2.0 standard liters per minute (sLm)) for 5 min, and the medium of the cells in the 6-well plate was replaced with 3 mL of these PALs. After 2 h, the PAL was replaced with 3 mL of the culture medium.2.3 Preparation of plasma-activated Ringer's lactate solution
The experimental setup for preparing the PAL has been previously described.2 While argon gas was flowing, the plasma in the main discharge region was excited by applying 10 kV from a 60 Hz commercial power supply to two electrodes 20 mm apart. The flow rate of the argon gas was set at 2 sLm, and the distance between the plasma source and the samples was fixed at L = 3 or 13 mm.2.4 Cell viability assay
The effect of the PAL on cell viability was measured using an aqueous one solution cell proliferation assay kit (Promega, Madison, WI) according to the manufacturer's instructions. Absorbance was measured at 490 nm with a POWERSCAN HT microplate reader. Cells were seeded in a 200 μL medium in a 96-well plate. On the following day, 8 mL of the Ringer's lactate solution in a 60 mm dish or 3 mL of the Ringer's lactate solution in a 6-well plate was treated with plasma (L = 3 or 13 mm, 2.0 sLm) for 5 min. Thereafter, the medium of the cells in the 96-well plate was replaced with 200 μL of these PALs. After 2 h, the PAL was replaced with 200 μL of the culture medium. On the following day, cell viability was assayed using the cell proliferation assay kit. The absorbance values were averaged over three independent experiments, and data were expressed as the mean ± standard error of the mean.2.5 SICM setup
The SICM setup was as described in our previous report.21 The glass nanopipettes were fabricated from a borosilicate glass capillary (inner diameter: 0.58 mm and outer diameter: 1.00 mm) (GC100F-15, Harvard Apparatus) using a CO2 laser puller (Model P-2000, Sutter Instruments) with the following parameters.Heat 320 FIL 3 VEL 30 DEL 130 PUL —
Heat 310 FIL 2 VEL 39 DEL 150 PUL 255
The nanopipette was filled with Ringer's lactate solution, and an Ag/AgCl reference electrode was inserted into it. The applied potential (+0.2 V) generated an ionic flow through the tip that was used as a feedback signal. The ion current was measured using a current amplifier (MultiClamp700B, Axon Instruments). The probe was placed close to the sample using a stepping motor (KXC06030-GC, SURUGA SEIKI) and a homemade Z-piezo stage. The stepping motor with the Z-piezo stage was implemented on a manually operated XYZ manipulator (BSS76-60C, SURUGA SEIKI) with a travel range of ±6.5 mm. The precise probe position was controlled by XY- and Z-piezo stages. The scanning algorithms were controlled using a program written using LabVIEW2023 (National Instruments). A field-programmable gate array (National Instruments, NI USB-7856 OEM) was compiled using programs developed by us. The measurement was conducted on an optical microscope (Olympus, IX73) placed on an anti-vibration table (Herz, TS-150).
SICM imaging was performed using the hopping mode. The hopping amplitude was 3.5–4.0 μm. The waiting time after the lateral movement was 4.0 ms. During this time, a reference current, IREF, was measured as the average of the direct current using the probe. The probe's falling and withdrawing speeds were 120 and 1000 nm ms−1, respectively. The set point was 99.5% of the IREF. The pixel counts of the imaging were 128 × 128 or 256 × 256 points. SICM images were processed and analyzed using Gwyddion and a homemade program. The Gwyddion protocol can be found in the ESI.†
3 Results and discussion
3.1 MTS assay for characterising the anti-tumor effects of PAL
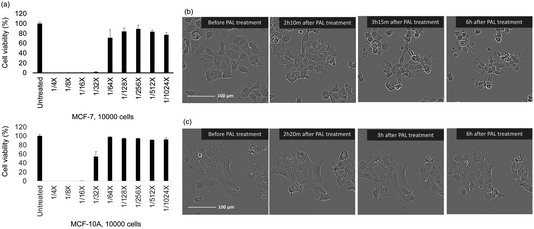
We conducted a 3-(4,5-dimethylthiazol-2-yl)-5-(3-carboxymethoxyphenyl)-2-(4-sulfophenyl)-2H-tetrazolium (MTS) assay to investigate the selective cytotoxic effects of the PAL on MCF-7 and MCF-10A cells. The PAL was prepared by treating Ringer's lactate solution for 5 min, and the MCF-7 and MCF-10A cells were treated with PAL diluted 4-fold, 8-fold, 16-fold, …, 1024-fold in Ringer's lactate solution for 2 h; thereafter, the PAL was replaced with a culture medium. Cell viability was measured using the MTS assay 24 h after the PAL treatment (Fig. 1a). The 4-fold, 8-fold, and 16-fold dilutions of PAL killed both the MCF-7 and MCF-10A cells, whereas the 128-fold, 256-fold, 512-fold, and 1024-fold dilutions of PAL had little impact on the cell viability. The PAL diluted 32-fold selectively killed MCF-7 cells over MCF-10A cells.Next, we observed structural changes in cancer cells and normal cells using a light microscope in 32× PAL, which had a remarkable survival rate. Regarding MCF-7 cancer cells, spreading lamellipodia, formation of filopodia, and cell contraction were observed. By 4 to 6 hours after PAL treatment, most cells were observed to be round (balloon-like structure) (Fig. 1b). When similar experiments were conducted on MCF-10A, a model of normal cells, no rounding (balloon-like structure) was observed in the cells treated with 32-fold diluted PAL (Fig. 1c). Similar observations were conducted for cells exposed to other concentrations of PAL, and the results are shown in Fig. S1.† In order to observe more detailed structural changes, evaluation was performed using SICM.
3.2 Fabrication of the widened-nanopipette for stable ion current detection
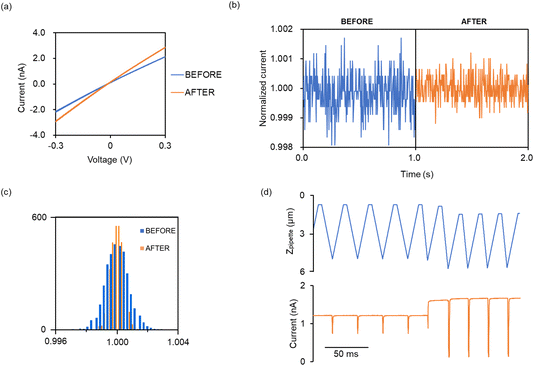
Suppressing the ion current fluctuation or drift during SICM topographic imaging is important for reliable time-lapse SICM imaging. Previously, we reported a fabrication method for an ideal-shaped nanopipette for high-resolution live-cell topographic imaging.21 However, at the level of the single-cell SICM topographic imaging, extremely sharp nanopipettes, with radii of less than 50 nm, are not required. Electroosmotic flow (EOF) is a major factor causing fluctuations in ion current measurements in SICM.25 EOF is the motion of liquid induced by an applied electric field across a porous material, capillary tube, membrane, or microfluidic channel. This phenomenon occurs due to the presence of an electrical double layer at the interface between the liquid and a solid surface. When an electric field is applied, ions in the diffuse layer of the electrical double layer move towards the oppositely charged electrode, dragging the liquid with them. This results in a net flow of liquid from the anode to the cathode. The propensity for electroosmotic flow can be evaluated by observing the rectification effect in the current response during a potential sweep.26,27 Nanopipettes, which exhibit minimal rectification, are ideal for use in SICM. The extent of rectification depends on several factors, including the tip aperture of the nanopipette,28 the shunt length of the nanopipette,29 the charge on the glass surface, and the cone angle.30 Additionally, the surface charge of the glass is influenced by salt concentration and pH. It is also known to depend on the rate of potential sweep.31To suppress the ion current fluctuation caused by electroosmotic flow, a short-shunt and widen nanopipette is preferable for SICM topographic imaging; however, it is challenging to prepare an ideal-shape nanopipette using a laser puller. Therefore, we intentionally brought the SICM nanopipette into contact with the bottom of the dish to crush only the extreme nanopipette tip, thereby creating a nanopipette with minimal rectification effects. We utilized SICM's distance-control technology for the extremely delicate manipulation of the contact between the tip of the nanopipette and the dish. This simple and reliable nanopipette-size controlling method was previously used for smart patch clamps for single-bouton patches.15 To intentionally fracture the tip of the nanopipette by making contact with the substrate while controlling the hopping distance, the feedback signal setpoint was 2.0% and the approach and withdraw speeds were set to 500–1000 nm ms−1 and 300 nm ms−1, respectively. The influence of the electroosmotic flow can be evaluated in the context of the rectification effect during current–voltage (IV) characteristics evaluation. Fig. 2a and b shows the IV characteristics and the chronoamperometry results, respectively. Before the widening of the tip of the nanopipette, a rectification effect was observed, where the current value at positive potential did not have a linear relationship with the applied potential. Conversely, the rectification effects were not observed in the widened nanopipette. Additionally, during the chronoamperometry, the fluctuation width of the ion current was decreased and the stability of the ion current was enhanced by widening the nanopipette. The chronoamperometry was conducted at a sampling rate of 10 kHz, and the current values before normalization are shown in the ESI (Fig. S2†). A histogram created from the ionic current data during the chronoamperometry showed that the stability of the ionic current was improved by widening the aperture of the nanopipette (Fig. 2c). Additionally, with this method, it was possible to control the size of the nanopipette tip with good reproducibility, and the resistance value of the nanopipette measured in Ringer's lactate solution (conductivity 10.8 mS cm−1) was 109 ± 22 MΩ (n = 12). Therefore, the widened nanopipette that facilitates a stable current measurement was used for imaging in this study.
3.3 Nanoscale living cells topographic imaging for characterising the anti-tumor effects of PAL
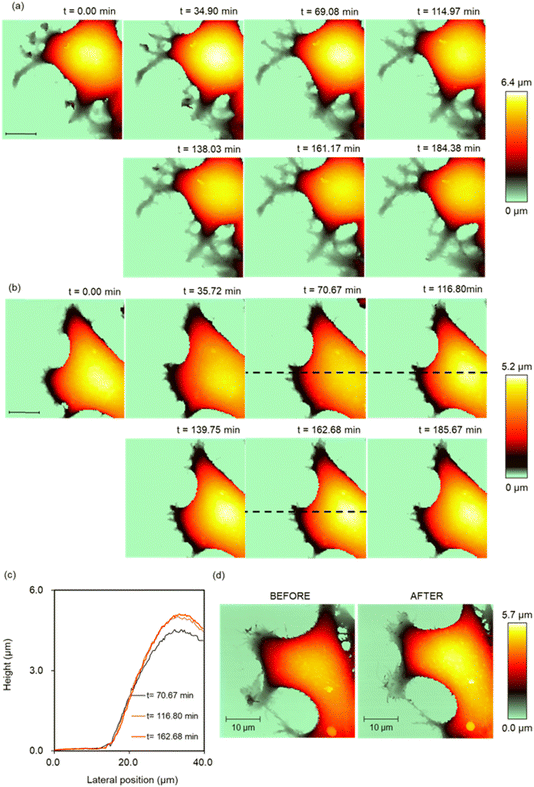
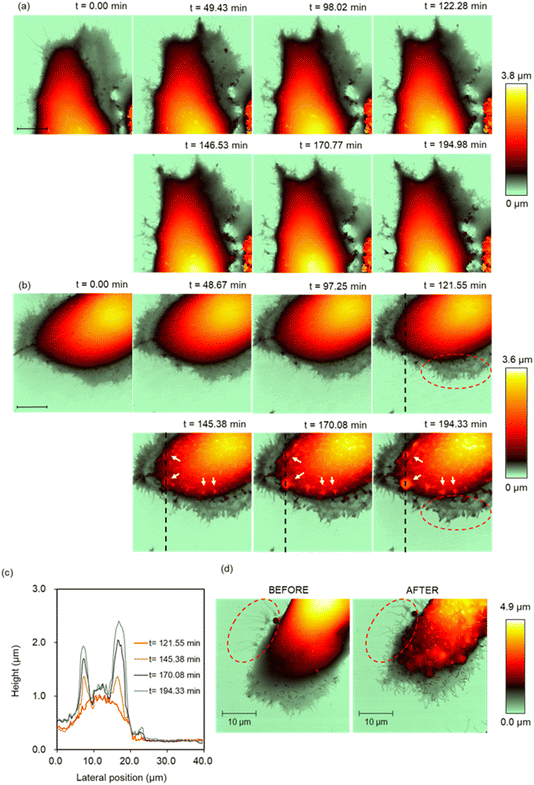
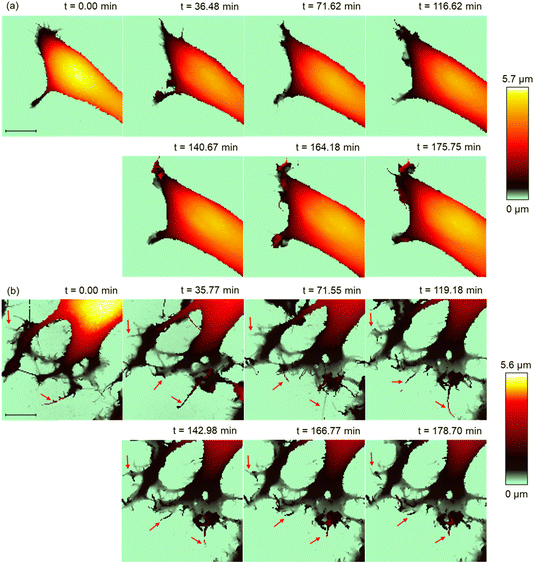
SICM time-lapse imaging was performed with the MCF-10A and MCF-7 cells in PAL diluted 32-fold, which showed the most significant difference in the viability state between the MCF-10A and MCF-7 cells, to monitor the structural changes on the cell surface, such as changes in the microvilli,32 lamellipodia, and filopodia.33 First, we visualized the intrinsic structural change of the PAL-untreated MCF-7 cells using SICM. The continuous elongation and shrinkage of the lamellipodia and microvilli were visualized during the SICM time-lapse imaging (Fig. 3a). In contrast, in cells treated with PAL, intense structural changes were observed in the lamellipodia during the initial 80 min after PAL treatment. Subsequently, the movement of the lamellipodia and cell migration ceased, and the cell height increased. From the cross-sections of the cell body, it was confirmed that the cell height increased by 500 nm (Fig. 3b and c). Further, high pixel-number imaging (256 × 256 points) was performed to observe more detailed structural changes. The imaging time was 46 min. We captured structural changes such as the formation of the filopodia and height changes after the PAL treatment (Fig. 3d).Similar SICM imaging was performed on the normal cells (MCF-10A). The extension and shrinkage of the lamellipodia were observed in the PAL-untreated MCF-10A cells (Fig. 4a). After the treatment with the PAL, the structural changes of the lamellipodia and the migration of the MCF-10A cells ceased immediately. The numerous thin protrusions present at the tip of the lamellipodia have fused together to form a thick structure (Fig. 4b red broken circle). Furthermore, protrusions began to form on the cell surface approximately 2 h after addition (Fig. 4b white arrows). SICM showed that this protrusion structure formed blebs, indicating that SICM could capture the initial changes in bleb formation. The high pixel-number imaging captured the structural changes such as the formation of the filopodia and protrusion after PAL treatment (Fig. 4d). The imaging time was 46 min. It was also confirmed that the thin protrusions at the tip of the lamellipodia became thicker (Fig. 4d red dashed circles).
The cessation of the structural changes in the lamellipodia and microvilli on the cell surface caused by PAL was due to the downregulation of the PI3K/AKT signal transduction pathway.4 Conversely, the phenomenon of increased cell height and protrusion structure formation was attributed to ferroptosis. Conventionally, the addition of PAL leads to membrane hyperoxidation and the induction of ferroptosis.5 Observations using AFM and confocal microscopy have reported shape changes induced by ferroptosis, including cell contraction and an increase in volume.7,34 Similar changes observed through SICM support these findings. Using the SICM, the changes in lipid composition could be estimated from the differences in charges.35 The approach curves of the structural changes in cells owing to the PAL, as observed using SICM, showed that the lipid components changed because of the induction of ferroptosis. Resultantly, the approach curves showed no difference in the cells before and after the structural change (Fig. S3†). This is because it was difficult to recognize changes in the charges due to changes in lipid composition when measuring ion concentrations high enough to allow cells to survive.
The selection of the dish used for the structural change monitoring of living cells is also important, as the ease of adhesion varies depending on the surface coating and hardness. In previous experiments, hydrophilic coated plastic dishes (NUNC EASYDISH 35 mm dish (Thermo SCIENTIFIC)) were utilized. For the fluorescence imaging of cells, glass-bottom dishes were used because of the autofluorescence of the dish. Therefore, we conducted measurements using a glass-bottom dish (Matsunami glass, Hydro D11140H) to determine if there were any differences in the cell-shape changes due to the PAL depending on the dish. For the PAL-untreated MCF-7 cells, almost no difference in the cell dynamics was observed compared with that of the plastic dish (Fig. 5a). The detail of the coloring is described in the ESI (Fig. S4†). The formation of filopodia was observed shortly after the PAL addition to the MCF-7 cells (Fig. 5b red arrows). This filopodia formation was observed for 120 min. The formation of these filopodia was more pronounced than that in the plastic dish. The adhesion status of the cells to the dish surface is an important factor for observing cellular structural changes by SICM, particularly when observing structural changes mediated by signal transduction pathways.
4 Conclusions
This study suggested that, in addition to previous assumptions that PAL exhibits toxicity toward cancer cells, there is a potential indication of toxicity toward normal cells even if 32× PAL is used. Furthermore, the cessation of lamellipodia movement observed in the MCF-7 and MCF-10A cells has not been previously reported. Using SICM, which facilitated non-contact nanoscale topographic imaging, we successfully captured changes in the pseudopodia movement induced by the PAL addition. Visualizing the activity of a small guanosine triphosphatase, such as Rac1, using Förster resonance energy transfer-based biosensors36,37 while conducting SICM measurements can provide a more detailed understanding of the relationship between signal transduction and structural changes.Data availability
The data supporting this article have been included as part of the ESI.†Conflicts of interest
The authors declare no competing financial interest.Acknowledgements
This work was supported by World Premier International Research Center Initiative (WPI) from MEXT, Japan; JST FOREST Program, Grant Number JPMJFR203K; AMED under Grant Number JP21km0908001 and JP22gm1410012, a Grant-in-Aid for Specially Promoted Research (19H05462), a Grant-in-Aid for Scientific Research (B) (20H02582 and 21H01072), a Grant-in-Aid for Exploratory Research (22K18939) from the Japan Society for the Promotion of Science (JSPS). Y. T. was supported by Takahashi industrial and economic research foundation, Kurita Water and Environment Foundation; Mitani foundation for research and development; the foundation for the Promotion of ion engineering; Nakatani foundation; Novartis research foundation; CASIO science promotion foundation, Iketani science and technology foundation. This work was partly supported by the Joint Usage/Research Program of the Center for Low-temperature Plasma Science, Nagoya University, and the Plasma Bio Consortium.Notes and references
- K. Ishikawa, K. Takeda, S. Yoshimura, T. Kondo, H. Tanaka, S. Toyokuni, K. Nakamura, H. Kajiyama, M. Mizuno and M. Hori, Free Radical Res., 2023, 57, 239–270 CrossRef CAS PubMed.
- H. Tanaka, K. Nakamura, M. Mizuno, K. Ishikawa, K. Takeda, H. Kajiyama, F. Utsumi, F. Kikkawa and M. Hori, Sci. Rep., 2016, 6, 36282 CrossRef CAS PubMed.
- H. Tanaka, Y. Hosoi, K. Ishikawa, J. Yoshitake, T. Shibata, K. Uchida, H. Hashizume, M. Mizuno, Y. Okazaki, S. Toyokuni, K. Nakamura, H. Kajiyama, F. Kikkawa and M. Hori, Sci. Rep., 2021, 11, 18488 CrossRef CAS PubMed.
- H. Tanaka, M. Mizuno, Y. Katsumata, K. Ishikawa, H. Kondo, H. Hashizume, Y. Okazaki, S. Toyokuni, K. Nakamura, N. Yoshikawa, H. Kajiyama, F. Kikkawa and M. Hori, Sci. Rep., 2019, 9, 13657 CrossRef.
- K. Sato, M. Yang, K. Nakamura, H. Tanaka, M. Hori, M. Nishio, A. Suzuki, H. Hibi and S. Toyokuni, Oral Dis., 2023, 30, 3912–3924 CrossRef PubMed.
- X. Jiang, B. R. Stockwell and M. Conrad, Nat. Rev. Mol. Cell Biol., 2021, 22, 266–282 CrossRef PubMed.
- L. Van der Meeren, J. Verduijn, D. V. Krysko and A. G. Skirtach, iScience, 2020, 23, 101816 CrossRef CAS.
- P. K. Hansma, B. Drake, O. Marti, S. A. C. Gould and C. B. Prater, Science, 1989, 243, 641–643 CrossRef CAS.
- Y. E. Korchev, C. L. Bashford, M. Milovanovic, I. Vodyanoy and M. J. Lab, Biophys. J., 1997, 73, 653–658 CrossRef CAS PubMed.
- V. Navikas, S. M. Leitao, K. S. Grussmayer, A. Descloux, B. Drake, K. Yserentant, P. Werther, D.-P. Herten, R. Wombacher, A. Radenovic and G. E. Fantner, Nat. Commun., 2021, 12, 4565 CrossRef CAS.
- P. Hagemann, A. Gesper and P. Happel, ACS Nano, 2018, 12, 5807–5815 CrossRef CAS.
- J. Seifert, J. Rheinlaender, P. Novak, Y. E. Korchev and T. E. Schäffer, Langmuir, 2015, 31, 6807–6813 CrossRef CAS.
- C. Zhu, K. Huang, N. P. Siepser and L. A. Baker, Chem. Rev., 2021, 121, 11726–11768 CrossRef CAS.
- T. Ushiki, M. Nakajima, M. Choi, S.-J. Cho and F. Iwata, Micron, 2012, 43, 1390–1398 CrossRef CAS PubMed.
- P. Novak, J. Gorelik, U. Vivekananda, A. I. Shevchuk, Y. S. Ermolyuk, R. J. Bailey, A. J. Bushby, G. W. J. Moss, D. A. Rusakov, D. Klenerman, D. M. Kullmann, K. E. Volynski and Y. E. Korchev, Neuron, 2013, 79, 1067–1077 CrossRef CAS.
- P. Novak, C. Li, A. I. Shevchuk, R. Stepanyan, M. Caldwell, S. Hughes, T. G. Smart, J. Gorelik, V. P. Ostanin, M. J. Lab, G. W. J. Moss, G. I. Frolenkov, D. Klenerman and Y. E. Korchev, Nat. Methods, 2009, 6, 279–281 CrossRef CAS PubMed.
- Y. Takahashi, Y. Zhou, T. Miyamoto, H. Higashi, N. Nakamichi, Y. Takeda, Y. Kato, Y. Korchev and T. Fukuma, Anal. Chem., 2020, 92, 2159–2167 CrossRef CAS PubMed.
- A. I. Shevchuk, G. I. Frolenkov, D. Sánchez, P. S. James, N. Freedman, M. J. Lab, R. Jones, D. Klenerman and Y. E. Korchev, Angew. Chem., Int. Ed., 2006, 45, 2212–2216 CrossRef CAS PubMed.
- Y. Zhang, J. Gorelik, D. Sanchez, A. Shevchuk, M. Lab, I. Vodyanoy, D. Klenerman, C. Edwards and Y. Korchev, Kidney Int., 2005, 68, 1071–1077 CrossRef CAS PubMed.
- A. I. Shevchuk, P. Novak, M. Taylor, I. A. Diakonov, A. Ziyadeh-Isleem, M. Bitoun, P. Guicheney, M. J. Lab, J. Gorelik, C. J. Merrifield, D. Klenerman and Y. E. Korchev, J. Cell Biol., 2012, 197, 499–508 CrossRef CAS PubMed.
- Y. Takahashi, Y. Sasaki, T. Yoshida, K. Honda, Y. Zhou, T. Miyamoto, T. Motoo, H. Higashi, A. Shevchuk, Y. Korchev, H. Ida, R. Hanayama and T. Fukuma, Anal. Chem., 2023, 95, 12664–12672 CrossRef CAS PubMed.
- Y. Zhou, M. Saito, T. Miyamoto, P. Novak, A. I. Shevchuk, Y. E. Korchev, T. Fukuma and Y. Takahashi, Anal. Chem., 2018, 90, 2891–2895 CrossRef CAS.
- H. Ida, N. Taira, K. Azuma, A. Kumatani, M. Akishiba, S. Futaki, Y. Takahashi and H. Shiku, Electrochim. Acta, 2023, 441, 141783 CrossRef CAS.
- S. Simeonov and T. E. Schäffer, Nanoscale, 2019, 11, 8579–8587 RSC.
- P. Chen, T. Mitsui, D. B. Farmer, J. Golovchenko, R. G. Gordon and D. Branton, Nano Lett., 2004, 4, 1333–1337 CrossRef CAS PubMed.
- C. Wei, A. J. Bard and S. W. Feldberg, Anal. Chem., 1997, 69, 4627–4633 CrossRef CAS.
- E. C. Yusko, R. An and M. Mayer, ACS Nano, 2010, 4, 477–487 CrossRef CAS PubMed.
- M. L. Kovarik, K. Zhou and S. C. Jacobson, J. Phys. Chem. B, 2009, 113, 15960–15966 CrossRef CAS PubMed.
- Q. Liu, Y. Wang, W. Guo, H. Ji, J. Xue and Q. Ouyang, Phys. Rev. E: Stat., Nonlinear, Soft Matter Phys., 2007, 75, 051201 CrossRef PubMed.
- Z. Siwy, E. Heins, C. C. Harrell, P. Kohli and C. R. Martin, J. Am. Chem. Soc., 2004, 126, 10850–10851 CrossRef CAS.
- L. Rosentsvit, W. Wang, J. Schiffbauer, H.-C. Chang and G. Yossifon, J. Chem. Phys., 2015, 143, 224706 CrossRef PubMed.
- T. Pelaseyed and A. Bretscher, J. Cell Sci., 2018, 131, jcs221853 CrossRef PubMed.
- A. J. Ridley, Cell, 2011, 145, 1012–1022 CrossRef CAS PubMed.
- Y. Hirata, R. Cai, A. Volchuk, B. E. Steinberg, Y. Saito, A. Matsuzawa, S. Grinstein and S. A. Freeman, Curr. Biol., 2023, 33, 1282–1294 CrossRef CAS.
- L. H. Klausen, T. Fuhs and M. Dong, Nat. Commun., 2016, 7, 12447 CrossRef CAS.
- R. E. Itoh, K. Kurokawa, Y. Ohba, H. Yoshizaki, N. Mochizuki and M. Matsuda, Mol. Cell. Biol., 2002, 22, 6582–6591 CrossRef CAS.
- H. Yoshizaki, Y. Ohba, K. Kurokawa, R. E. Itoh, T. Nakamura, N. Mochizuki, K. Nagashima and M. Matsuda, J. Cell Biol., 2003, 162, 223–232 CrossRef CAS PubMed.
Footnote |
| † Electronic supplementary information (ESI) available: Observation using an optical microscope before and two hours after PAL administration to cell (Fig. S1). Non-normalized current values before and after widening the nanopipette (Fig. S2). Plots of ion current vs. vertical pipette position on a living cell (Fig. S3). Height distribution and coloring of SICM topographic image (Fig. S4). See DOI: https://doi.org/10.1039/d4fd00116h |
| This journal is © The Royal Society of Chemistry 2025 |

