 Open Access Article
Creative Commons Attribution 3.0 Unported Licence
A micropore nanoband electrode array for enhanced electrochemical generation/analysis in flow systems
Fiona
Moore
a,
Ilka
Schmueser
 b,
Jonathan G.
Terry
 a and
Andrew R.
Mount
 *b
*b
aSchool of Engineering, The University of Edinburgh, King's Buildings, Edinburgh, EH9 3JF, UK
bEaStCHEM, School of Chemistry, The University of Edinburgh, King's Buildings, Edinburgh, EH9 3JJ, UK. E-mail: A.Mount@ed.ac.uk
First published on 26th July 2024
Abstract
Our previous work has established that micron-resolution photolithography can be employed to make microsquare nanoband edge electrode (MNEE) arrays. The MNEE configuration enables systematic control of the parameters (electrode number, cavity array spacing, and nanoelectrode dimensions and placement) that control geometry, conferring a consistent high-fidelity electrode response across the array (e.g., high signal, high signal-to-noise, low limits of detection and fast, steady-state, reproducible and quantitative response) and allowing the tuning of individual and combined electrode interactions. Building on this, in this paper we now produce and characterise a micropore nanoband electrode (MNE) array designed for flow-through detection, where an MNEE edge electrode configuration is used to form a nanotube electrode embedded in the wall of each micropore, formed as an array of pores of controlled size and placement through an insulating membrane of sub-micrometer thickness. The success of this approach is established by the close correspondence between experiment and simulation and the enhanced and quantitative detection of redox species flowing through the micropores over the very wide range of flow rates relevant, e.g., to applications in (bio)sensing and chromatography. Quantitative electrochemical reaction with low conversion, suitable for analysis, is demonstrated at high flow, whilst quantitative electrochemical reaction with high conversion, suitable for electrochemical product generation, is enabled at lower flow. The fundamental array response is analysed in terms of established flow theories, demonstrating the additive contributions of within-pore enhanced diffusional (nanoband edge) and advective (Levich-type) currents, the control of the degree of diffusional overlap between pores through pore spacing and flow rate, the control by design across length scales ranging from nanometer through micrometer to a centimetre array, and the ready determination of physicochemical parameters, enabling discussion of the potential of this breakthrough technology to address unmet needs in generation and analysis.
Introduction
Nanoelectrodes offer multiple potential advantages over macro- and microelectrodes. These include enhanced mass transport for more rapid response and a double layer capacitance which is reduced more markedly than the electrode response with decreasing area (giving a progressively increasing signal-to-noise), albeit with the downside of a decreasing signal magnitude.1–3 When the signals from multiple nanoelectrodes are combined by utilising an array format, this downside is overcome, but without a precisely controlled and homogeneous distribution of electrode placement within the array, the system is then termed an ensemble;1,4,5 the response from each electrode and the overall array often varies, leading to a less controlled and variable total response. Previously we have shown that micron resolution photolithography can be used to produce a micron resolution nanoband edge (MNEE) array format6,7 and demonstrated its application to biosensing.8 This format enables high fidelity, highly controlled electrode array production; it combines the nanoband electrodes, each placed around the inside edge of shallow microscale cavities (which have been shown to give rapid, steady-state signal generation) in a cavity array of controlled size and spacing with a defined macroarray placement and footprint, which offers the ability to sense with enhanced signal magnitudes (Fig. 1a). We now take advantage of this enhanced configuration by etching the nanoband cavity entirely through the wafer to produce a micropore nanoband electrode (MNE) array (Fig. 1b); this has edge nanoelectrodes embedded as a tube electrode in the wall of each pore in the array. Placed within the thin (0.5 μm) membrane of defined area and supported by the silicon substrate, the nanoelectrode thickness, placement and pore length are then determined by control of the original metal deposition and insulator layer thicknesses.MNE array device fabrication
The MNE array (Fig. 1b) fabrication protocol was based on that previously reported for the MNEE array (Fig. 1a).6,7 Briefly, the process involved depositing the relevant layers on the front side of the silicon wafer, then specifically back-etching the silicon wafer across the defined electrode array area to open up the cavity behind the membrane, followed by front-side processing (as for the MNEE) to selectively open up and form the array of through-membrane cavities (the micropores). Fig. 2 shows top down and cross-sectional views of the MNE and MNEE devices. In detail, for the deposition steps, 500 nm of thermal oxide was grown on double-sided polished silicon wafers, followed by a 130 nm thickness low-pressure chemical vapor deposition (LPCVD) silicon-rich silicon nitride (SiRN) layer. 10 nm thickness titanium and 50 nm thickness platinum layers were then electron-beam evaporated onto the SiRN, patterned and etched using reactive ion etching (RIE) to define the extent of the electrode and contact pad region (surface oxidation of the Ti to insulating TiO2 during processing and/or in aqueous solutions then results in a 50 nm thick platinum nanotube electrode). Another 300 nm of SiRN was then deposited to form the top insulator. From the wafer back-side, the cavity was opened and the membrane area was patterned and etched using RIE and potassium hydroxide to form the ca. 500 nm thick metallised membrane (SiRN layers on either side of the Pt/Ti metal layer). From the wafer top-side, the contact pad (Fig. 2a) was created by etching an opening into the silicon nitride layer, again using RIE. Finally, the micropore nanobands were fabricated by patterned etching through the membrane stack of SiRN/Pt/Ti/SiRN from the top side using RIE and argon milling.The resulting configuration used in this work consisted of an array of a total N = 550 micropores of diameter d = 20 μm in a hexagonal arrangement with a common edge-to-edge micropore spacing of 150 μm to all nearest neighbours. Fig. 3 shows a typical SEM image of the completed MNE device, seen from the back side, showing the rectangular cavity defining the membrane area, with the inset showing a magnification of a representative area, demonstrating the high-fidelity micropores produced.
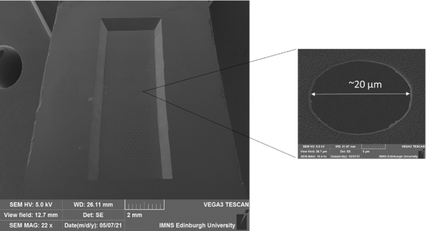 | ||
| Fig. 3 SEM image of the back side of an MNE electrode showing the defined membrane and array area in the centre of the image. Also shown is a magnification of one of the micropores. | ||
Experimental
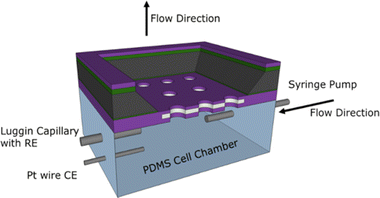
The MNE array devices were tested using an in-house-constructed flow test chamber fabricated from polydimethylsiloxane (PDMS), a commonly used polymer for constructing microfluidic devices.9 PDMS was formed by first mixing a 10![[thin space (1/6-em)]](https://www.rsc.org/images/entities/char_2009.gif) :
:![[thin space (1/6-em)]](https://www.rsc.org/images/entities/char_2009.gif) 1 ratio of elastomer to curing agent, then placing this in a vacuum chamber for at least 1 hour to ensure all bubbles created during mixing were removed. The PDMS was then poured into 3D-printed and acetone-smoothed acrylonitrile butadiene styrene moulds and cured at room temperature. The resulting assembled PDMS chamber (Fig. 4) had design dimensions of approximately 4 mm × 10.5 mm × 5 mm.
1 ratio of elastomer to curing agent, then placing this in a vacuum chamber for at least 1 hour to ensure all bubbles created during mixing were removed. The PDMS was then poured into 3D-printed and acetone-smoothed acrylonitrile butadiene styrene moulds and cured at room temperature. The resulting assembled PDMS chamber (Fig. 4) had design dimensions of approximately 4 mm × 10.5 mm × 5 mm.
A platinum wire counter electrode (CE), a Luggin capillary connected to a commercial Ag/AgCl/Cl− (3 M) reference electrode (RE), and a needle syringe connected to a syringe pump were pushed through the PDMS cell walls into the chamber. All MNE array potentials, E, are reported with respect to this RE. The MNE was used as the working electrode (WE) and placed front-side down within the PDMS cell, followed by fully enclosing the chamber. All electrodes and needles were sealed using Araldite® or silicone, and water tightness then confirmed, ensuring the analyte could be flowed through the micropores and past the nanoband electrodes at a known flow rate. Fig. 4 shows a schematic of the assembled flow test cell.
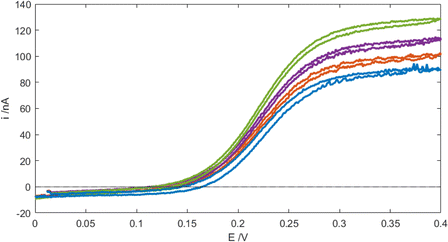
Electrochemical measurements were recorded using ferrocenemethanol (FcMeOH) dissolved in phosphate buffered saline (PBS 1×, with aqueous solution concentrations of 137 mM NaCl, 2.7 mM KCl, 10 mM Na2HPO4 and 1.8 mM KH2PO4) on a Metrohm Autolab PGSTST128N potentiostat at 26 °C. Mindful of the data presented in Fig. 5, subsequent mass-transport-limited array currents, i, were typically recorded as a function of time, t, by switching the MNE array from E = 0 V to E = +0.4 V at t = 0 s (given that FcMeOH/Fc+MeOH is a one-electron reaction, n = 1 has been substituted in all relevant equations). Data were collected using NOVA 1.11 software using a PC and analysed using Matlab. Numerical simulations were carried out using COMSOL Multiphysics.
Results & discussion
MNE characterisation
Fig. 5 shows typical cyclic voltammograms (CVs) recorded for the MNE array using the reversible FcMeOH/Fc+MeOH couple in aqueous buffer solution at a variety of flow rates. First, it is reassuring that a characteristic wave-shaped response was obtained under no-flow conditions. This steady-state response, neither observed nor expected from a linear nanoband,10,11 has previously been both measured and simulated for the MNEE array configuration,6,7 and attributed to the closed (square) configuration of the MNEE cavity, which leads to a hemispherical diffusional profile being established in/around the cavity. This therefore suggests the same profile is being established within/near the circular pore (on both sides of the pore in this MNE case). This wave-shaped response is then seen to increase with increasing flow, consistent with a combined contribution from diffusion and advection within each pore in the array, demonstrating both effective solution transport through the pores and high-fidelity electrode array operation with flow. It is interesting that although the increase in current with flow is significant, it is still relatively small compared to diffusional flow, contributing only around 50% of additional current at the fastest flow, which is consistent with the enhanced diffusional transport expected at such nanoelectrodes.Analysis of these CV (E, i) data using the modified Tafel equation (1),
 | (1) |
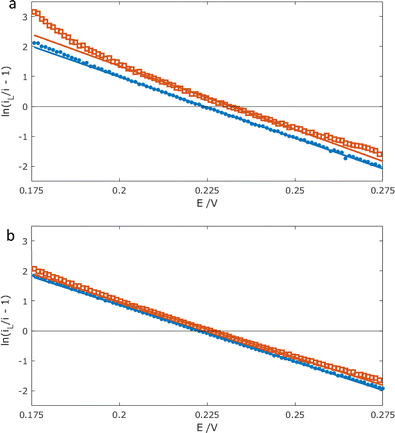 | ||
| Fig. 6 Modified Tafel plots calculated from the CV data in Fig. 5 for (a) Vf = 0 ml h−1 and (b) Vf = 5 ml h−1. The forward (f, blue dots) and reverse (r, red squares) scans are shown. In each case, calculated best fit linear regression lines, y = mx + c, are shown for the data between +0.20 V and 0.25 V, extended across the entire potential range. Best fit values are (a) m = −40.9 ± 0.1 V−1 (f) and −42.4 ± 0.3 V−1 (r); c = 9.16 ± 0.03 (f) and 9.83 ± 0.06 (r); R2 = 0.999 (f) and 0.998 (r); (b) m = −37.9 ± 0.1 V−1 (f) and −37.2 ± 0.1 V−1 (r); c = 8.45 ± 0.02 (f) and 8.41 ± 0.03 (r); R2 = 1.000 (f) and 0.999 (r). | ||
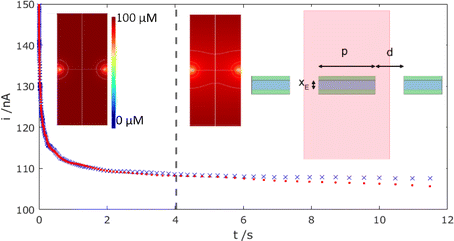
To confirm this zero flow effect, Fig. 7 presents corresponding COMSOL simulations of the mass-transport-limited MNE array current response with time, comparing an array of N neighbouring pores, each at the designed/fabricated edge-to-edge separation (top right inset configuration; corresponding data shown as red dots), with N isolated MNE pores, each with no neighbours (using a suitably large simulation box and no symmetry to simulate p → ∞; data shown as blue crosses).
It is reassuring that the magnitudes of the calculated currents are both consistent with those observed experimentally (confirming electrode activity and pore transport for the entire array) and that a near steady-state current (within 10% of the final steady-state current observed as t → ∞ for the isolated MNEs) is observed for t ≪ 1 s. Furthermore, the dashed line at t = 4 s indicates the onset of divergence between these two sets of data. That this occurs at a comparable time to the divergence of the data from modified Tafel behaviour in the reverse scan in Fig. 6a, at which t = L2/(2D), where L = p/2, strongly suggests that overlap of neighbouring pore diffusional fields in the array is indeed the origin of the observed effect. This overlap is confirmed by comparing concentration profiles at t > 4 s (e.g., middle inset of Fig. 7) with those at t < 4 s (e.g., left inset).
MNE array response with flow
Having determined both the experimental response and COMSOL simulated response at no flow, simulations were then performed to determine the relative contributions and interplay of mass transport due to diffusion and forced advection under flow. Levich established that the mass-transport limiting current for a one-electron oxidation reaction (e.g., FcMeOH) at a microtube electrode due to laminar flow in a pipe (Fig. 8) is given by:12,13| iL = 5.43FcD2/3Vf1/3xE2/3 | (2) |
 | ||
| Fig. 8 Schematic of a macrotube electrode of length xE embedded in the walls of a pipe of diameter d, whose flow-limited current is given by the Levich equation (eqn (2)). Note that this configuration is equivalent to that of a nanoband in an individual micropore in the MNE array. | ||
Fig. 9 now presents a comparison of the MNE experimental versus simulation results for the MNE array current response as a function of flow and time. First, it is clear that there is extremely good agreement within experimental error between the t = 1 s experiment and simulation data at all volume flow rates below Vf1/3 = 103 (1.5 m3 s−1)1/3. Secondly, it is clear that high-fidelity MNE arrays capable of a rapid and quantitative response have been produced. Thirdly, it is also evident that this response is obtained across a flow-rate regime that encompasses a wide range of application-relevant flows and pressures, spanning passive evaporative flow sensing (e.g., for sweat14) at low flow, and across the liquid chromatography regime towards that of high-performance liquid chromatography (HPLC15). Finally, there are apparently two regimes; at slow flows, Vf1/3 < 103 (0.5 m3 s−1)1/3, there is a time-dependent and relatively flow-insensitive (diffusion controlled) regime, whilst above this there is a time-independent and linear dependency of current on Vf1/3 (advection controlled), which is henceforth termed Levich-like behaviour.
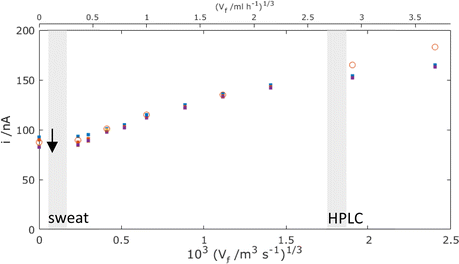 | ||
| Fig. 9 Comparison of experimental results (points) and simulated results using laminar flow (circles) for the total MNE array current, i, plotted against Vf1/3 for the mass-transport-limited oxidation of c = 100 μM FcMeOH. Simulation data points are taken at t = 1 s with D = 5.07 × 10⁻¹⁰ m2 s−1, and experimental results (dots) have data points taken at t = 0.1 (blue), 1 (orange), 10 (purple), and 30 s (yellow) (arrow shows direction of increasing time). These data are each for an average of 5 measurements with error bars within the size of each datapoint. The shaded regions show the typical volume flow rates for sweat measurement14 and HPLC,1,15 respectively (note that Vf axes are shown in both m3 s−1 and ml h−1 here and thereafter to reflect the units used in applications). | ||
Analysis of the MNE array response
Fig. 10 shows MNE simulation results as a function of time, again, as with Fig. 7, with and without neighbouring pores. That these “with” and “without” pore overlap data are coincident at each time and flow in the Levich-like region (region B) demonstrates that the additional advective flow under these conditions always precludes the neighbouring pore overlap of the diffusion (more generally depletion) layers emanating from each pore, unlike under no flow (Fig. 7). By contrast, the data in the regime of the slowest flows (region A) are consistent with Fig. 7 in showing coincidence of the “with” and “without” pore overlap data only at t < 1 s, and with significantly decreasing currents as a function of time thereafter.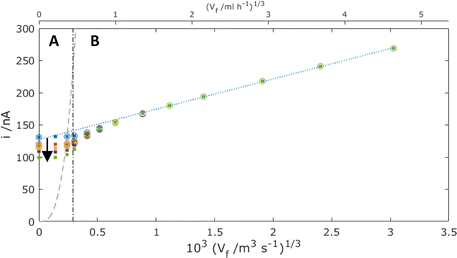 | ||
| Fig. 10 Simulation results for the total MNE array current, i, plotted against Vf1/3 for the mass-transport-limited oxidation of c = 100 μM FcMeOH, at the interelectrode spacing (p = 120 μm, dots) and without overlap (p → ∞, circles). Data shown are for t = 0.1 (blue), 1 (red), 10 (orange), 30 (purple) and 100 s (green). The dashed line shows the theoretical current that corresponds to the complete oxidation of all the analyte flowing though the pore (eqn (4)). The dot-dash line shows the calculated flow value from eqn (3) where Pe = 1. The blue dotted line shows the best fit regression line for the region B data above Vf = 1 ml h−1. | ||
Another diffusion layer overlap of interest is whether/when the diffusion layer of FcMeOH at the nanoband grows sufficiently large for overlap to occur between opposite sides of the nanoband. It is useful then to determine the balance point when advection and diffusion are comparable (Péclet number Pe = 1),16 by ratioing the characteristic rate for advective laminar flow of FcMeOH through the pore, tf−1, to that for diffusional mass transport from the nanoband, tD−1. In this case, tf−1 = u/L, where u is the average pore flow velocity, and L is the distance travelled down the pore in laminar flow, whilst for diffusion tD−1 = 2D/L2. When, L = d/2 in the case of this circular nanoband, the depletion layers emanating from opposite sides of the circular band will start to overlap, which gives for Pe = 1:
 | (3) |
Given Vf = Nπd2u/4, the value of Vf corresponding to Pe = 1 can then be readily calculated for this system (shown as the dot-dash line in Fig. 10). In region A where Vf is lower than this flow, it is to be expected that effective overlap of FcMeOH diffusion layers will occur, giving essentially diffusion-dominated reaction of species first across the pore width, then within the whole pore length, and finally through transport of species into the pore through the establishment of hemispherical diffusion at each pore/solution interface. That this regime is dominated by diffusional transport is demonstrated by the observation i ≫ iad (the dashed line shown in Fig. 10), where
| iad = FcVf | (4) |
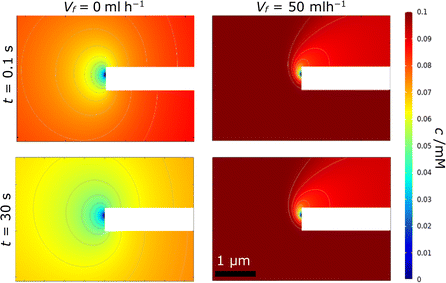
By contrast, in region B, the rate of advection and replenishment of FcMeOH in the pores should be sufficiently large to ensure no overlap both across the area of the pore at the nanoband and within the pore. Here, as expected i ≪ iad, only a small proportion of the FcMeOH flowing through the pores will react and there is a Levich-like dependence on flow. This model of depletion within each pore is confirmed by the concentration profile data shown in Fig. 11. This shows the progressive depletion and overlap of the diffusion layer with time across the pore in region A (and therefore the conversion of a significant and progressively larger proportion of the FcMeOH species within the pore), in contrast to the more localised, time-independent diffusion layers established at the nanoelectrode in region B.
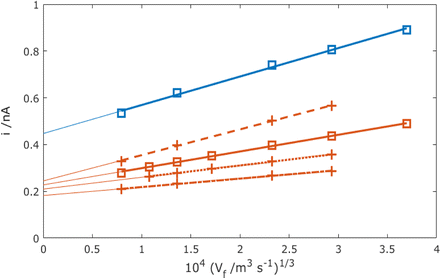
It is noteworthy that when extrapolating the linear Levich-like response in region B of Fig. 10, there is a significant non-zero current axis intercept (blue dashed line), whose magnitude is similar to the diffusional current observed at short times with no flow. This is unlike the established Levich macroelectrode response (eqn (2)), and indicates that the contribution of diffusional transport to these nanobands is not only significant but also additive to that of advection. In this case, the quantitative response of the MNE array can be modelled as:
| i = B/2NFDcd + 5.43GFcD2/3Vf1/3xE2/3, | (5) |
Fig. 12 now shows region B MNE-array simulation data varying xE and D, whilst Table 1 summarises the calculated values of B and G from these data and eqn (5).
| D/10−9 m2 s−1 | x E/nm | i intercept/nA | Gradient/nA (m3 s−1)−1/3 | R 2 | G | B |
|---|---|---|---|---|---|---|
| 0.70 | 10 | 0.182 ± 0.004 | 362 ± 2 | 0.995 | 1.89 | 2.7 |
| 0.70 | 25 | 0.210 ± 0.002 | 504 ± 1 | 0.998 | 1.43 | 3.1 |
| 0.70 | 50 | 0.228 ± 0.003 | 714 ± 1 | 0.998 | 1.27 | 3.4 |
| 0.70 | 100 | 0.245 ± 0.004 | 1100 ± 2 | 0.999 | 1.24 | 3.6 |
| 1.43 | 50 | 0.447 ± 0.110 | 1220 ± 4 | 0.996 | 1.35 | 3.2 |
With the exception of the thinnest (10 nm) nanobands, it is comforting that B = 3.4 ± 0.2 for this MNE array. This is comparable to the equivalent value of 1.92 determined for the square cavity MNEE array (which used the square edge length as the characteristic length),7 when considering that the MNE current should be doubled, as it arises from solution diffusion to both upper and lower membrane interfaces, compared to the single solution interface in the MNEE case. Overall, the intercept current was observed to be only weakly dependent on xE, with 92% of the intercept value recorded when halving the nanoband thickness (from xE = 50 to 25 nm). This is consistent with our previous MNEE simulations,7 and is consistent with a predominance of edge diffusion to a nanoelectrode.
For xE = 20 nm and above, it is interesting that G lies in the range 1.3 ± 0.1. This slightly “super Levich” gradient (G > 1) is in agreement with the flow simulation study presented by Thompson et al.17 for this tubular electrode geometry. Under similar conditions (d/(2xE) > 1), and consistent with the MNE array, the data presented therein (Fig. 6a) show the Levich dependence on Vf1/3 over a wide range of normalised Vf, with values also slightly above the predicted Levich gradient.
Conclusions
The combination of experimental and simulation work presented here demonstrates that the MNE array system is a robust system of controlled geometry, which enables quantitative and reproducible electrochemical characterisation and reaction/detection of species flowing through the pores. Two regimes have been characterised the first is region A, under low-flow conditions, where mass transport by diffusion dominates, and the proportion of species that electrochemically react is large; this makes this regime suitable for flow through applications where near complete electrochemical conversion of the redox species is required. By contrast, region B, under high flow conditions, is where advection determines the increasing and time-independent current, and the proportion of reacting species is very low, which is suited to analytical detection, and enables the ready extraction of the parameters D, E′ and c in such flow systems (for example, it is worth noting that the fits of eqn (5) to the experimental data in Fig. 9 can be used to determine the value of D, given the different dependency of D contained within the slope and intercept terms). This microfabricated MNE array configuration is already shown to be capable of such characterisation across a wide range of flow conditions, ranging from passive (evaporative) flow to forced advection systems such as liquid chromatography, thereby opening up a wide a range of potential applications.It is interesting to consider the origin of one advantage of these MNE array systems: that diffusion and advection are simply additive, particularly in region B. It should be noted that for nanoelectrodes, edge diffusion dominates the current response,7 whilst for laminar flow across tube macroelectrodes (Fig. 8), diffusion across a diffusion layer established near and across the electrode area dominates and the contribution of edge diffusion is negligible. One simple explanation for this additive nature is that it is due to this separation of these contributions to these distinct locations on the electrode, and that in region B, when flow is significant and diffusion layers remain small compared to the size of the pore, each is largely unaffected by the other.
It is also interesting to speculate how this experimental response could be optimised still further by considering the experimental deviation at high flow from that simulated (Fig. 9). Fluid flow is considered to be laminar when the Reynolds number Re < 2000.18 Since
 | (6) |
| le = 0.1hRe | (7) |
Data availability
Data for this article, including the raw data, are available at Edinburgh DataShare at: https://doi.org/10.7488/ds/7771.Conflicts of interest
There are no conflicts to declare.Acknowledgements
This work was conducted in and supported by the Scottish Microelectronics Centre and the Pyrochemical Research Laboratory at the University of Edinburgh. F. M. acknowledges funding through the EPSRC Centre for Doctoral Training in Intelligent Sensing and Measurement, grant number EP/L016753/1.References
- D. W. M. Arrigan, Analyst, 2004, 129, 1157–1165 RSC.
- J. T. Cox and B. Zhang, Annu. Rev. Anal. Chem., 2012, 5, 253–272 CrossRef CAS.
- R. W. Murray, Chem. Rev., 2008, 108, 2688–2720 CrossRef CAS.
- N. Karimian, L. M. Moretto and P. Ugo, Sensors, 2017, 17, 65 CrossRef.
- G. R. Dangel, H. Kumakli, C. E. Rahm, R. White and N. T. Alvarez, Appl. Sci., 2021, 11, 8399 CrossRef CAS.
- J. G. Terry, I. Schmüser, I. Underwood, D. K. Corrigan, N. J. Freeman, A. S. Bunting, A. R. Mount and A. J. Walton, IET Nanobiotechnol., 2013, 7, 125–134 CrossRef CAS PubMed.
- I. Schmueser, A. J. Walton, J. G. Terry, H. L. Woodvine, N. J. Freeman and A. R. Mount, Faraday Discuss., 2013, 164, 295–314 RSC.
- A. Piper, B. M. Alston, D. J. Adams and A. R. Mount, Faraday Discuss., 2018, 210, 201–217 RSC.
- K. Raj M and S. Chakraborty, J. Appl. Polym. Sci., 2020, 137, 48958 CrossRef CAS.
- R. B. Morris, D. J. Franta and H. S. White, J. Phys. Chem., 1987, 91, 3559–3564 CrossRef CAS.
- S. L. Caston and R. L. McCarley, J. Electroanal. Chem., 2002, 529, 124–134 CrossRef CAS.
- A. J. Bard and L. R. Faulkner, Electrochemical Methods – Fundamentals and ApplicationsJohn Wiley & Sons, Inc., 2001 Search PubMed.
- V. G. Levich, Physicochemical Hydrodynamics, Prentice-Hall, Englewood Cliffs, N.J., 1962 Search PubMed.
- A. Wiorek, M. Parrilla, M. Cuartero and G. A. Crespo, Anal. Chem., 2020, 92, 10153–10161 CrossRef CAS.
- P. Uthaiwat, T. Leeudomwong and T. Sanponpute, Accredit. Qual. Assur., 2024, 29, 205–214 CrossRef CAS.
- B. E. Rapp, Microfluidics: Modeling, Mechanics and Mathematics, Elsevier, 2017 Search PubMed.
- M. Thompson, O. V. Klymenko and R. G. Compton, J. Electroanal. Chem., 2005, 575, 329–337 CrossRef CAS.
- K. Avila, D. Moxey, A. de Lozar, M. Avila, D. Barkley and B. Hof, Science, 2011, 333, 192–196 CrossRef CAS PubMed.
- P. R. Unwin and R. G. Compton, in Comprehensive Chemical Kinetics, ed. R. G. Compton, Elsevier, 1989, vol. 29, pp. 173–296 Search PubMed.
| This journal is © The Royal Society of Chemistry 2025 |


