 Open Access Article
Creative Commons Attribution 3.0 Unported Licence
Electrochemical nucleation and growth kinetics: insights from single particle scanning electrochemical cell microscopy studies†
Kenneth
Osoro
 ,
Sinthia
Rahman
 and
Caleb M.
Hill
 *
*
Department of Chemistry, University of Wyoming, 1000 E University Ave, Laramie, WY 82071, USA. E-mail: caleb.hill@uwyo.edu
First published on 6th July 2024
Abstract
The kinetics of particle nucleation and growth are critical to a wide variety of electrochemical systems. While studies carried out at the single particle level are promising for improving our understanding of nucleation and growth processes, conventional analytical frameworks commonly employed in bulk studies may not be appropriate for single particle experiments. Here, we present scanning electrochemical cell microscopy (SECCM) studies of Ag nucleation and growth on carbon and indium tin oxide (ITO) electrodes. Statistical analyses of the data from these experiments reveal significant discrepancies with traditional, quasi-equilibrium kinetic models commonly employed in the analysis of particle nucleation in electrochemical systems. Time-dependent kinetic models are presented capable of appropriately analysing the data generated via SECCM to extract meaningful chemical quantities such as surface energies and kinetic rate constants. These results demonstrate a powerful new approach to the analysis of single particle nucleation and growth data which could be leveraged in differentiating behavior within spatially heterogeneous systems.
Introduction
The nucleation and growth of small particles play a critical role in a variety of electrochemical systems. Exerting control over nucleation and growth processes requires a firm understanding of their kinetics, which are inherently complex due to multistep reaction sequences that involve small clusters which are often thermodynamically unstable.1 While a large body of prior work has demonstrated models capable of analysing nucleation and growth processes in bulk electrochemical systems,2–4 the continued development of nanoelectrodes and high-resolution microscopy techniques has opened the exciting possibility of tracking discrete nucleation events5–11 and mapping spatial variations in nucleation kinetics within surfaces.12–14 Unfortunately, the kinetic models employed in many of these prior studies are not applicable to experiments involving the nucleation and growth of individual, discrete particles.Here, we present single-particle studies of electrochemical nucleation and growth enabled by scanning electrochemical cell microscopy (SECCM). SECCM, which utilizes an electrolyte-filled pipet as a probe to locally interrogate the electrochemical properties of a surface, has been applied to great effect in studies of catalysis,15–21 photoelectrochemistry,22–24 corrosion,25,26 and particle nucleation and growth.12,27,28 Here, the high-throughput nature of SECCM enabled 100's of individual metal particles to be synthesized at a series of different applied potentials. By analysing the nucleation times in the context of an explicit time-dependent kinetic model, we demonstrate that it is possible to elucidate chemically meaningful quantities, such as surface energies and kinetic rate constants, through the analysis of single particle nucleation and growth data. The results from these experiments demonstrate a powerful new approach to the analysis of electrochemical nucleation and growth in heterogeneous systems.
Experimental methods
Electrode fabrication
Carbon film electrodes were fabricated through a process adapted from prior literature.29 Fused quartz cover slips (25.4 mm diameter × 0.25 mm thick, SPI) were cleaned by annealing in air at 800 °C in a tube furnace and soaking in piranha solution (3![[thin space (1/6-em)]](https://www.rsc.org/images/entities/char_2009.gif) :
:![[thin space (1/6-em)]](https://www.rsc.org/images/entities/char_2009.gif) 1 H2SO4
1 H2SO4![[thin space (1/6-em)]](https://www.rsc.org/images/entities/char_2009.gif) :
:![[thin space (1/6-em)]](https://www.rsc.org/images/entities/char_2009.gif) 30% H2O2) for 30 min. The substrates were then rinsed with DI H2O and dried under an N2 stream. A 50% (v/v) solution of AZ 1518 photoresist in 1-methoxy-2-propyl acetate was then spincoated onto the clean quartz substrates at 6000 rpm for 2 minutes. The resulting films were placed on a 90 °C hotplate for 12 minutes and transferred into a tube furnace (OTF-1200X, MTI). The furnace was purged three times with a 5% H2/95% N2 mixture, after which a constant flow of the H2/N2 mixture was maintained through the furnace. The samples were then heated at 5 °C min−1 to a temperature of 1000 °C and held at this temperature for 1 h, after which the furnace was allowed to cool naturally to room temperature. Indium tin oxide (ITO, 20 mm × 20 mm, #1, 8–12 Ω sq−1, SPI) electrodes were cleaned via sequential sonication in DI H2O, isopropanol, and DI H2O for 30 min each before use.
30% H2O2) for 30 min. The substrates were then rinsed with DI H2O and dried under an N2 stream. A 50% (v/v) solution of AZ 1518 photoresist in 1-methoxy-2-propyl acetate was then spincoated onto the clean quartz substrates at 6000 rpm for 2 minutes. The resulting films were placed on a 90 °C hotplate for 12 minutes and transferred into a tube furnace (OTF-1200X, MTI). The furnace was purged three times with a 5% H2/95% N2 mixture, after which a constant flow of the H2/N2 mixture was maintained through the furnace. The samples were then heated at 5 °C min−1 to a temperature of 1000 °C and held at this temperature for 1 h, after which the furnace was allowed to cool naturally to room temperature. Indium tin oxide (ITO, 20 mm × 20 mm, #1, 8–12 Ω sq−1, SPI) electrodes were cleaned via sequential sonication in DI H2O, isopropanol, and DI H2O for 30 min each before use.
Sample characterization
Atomic force microscopy (AFM) imaging was carried out using a Cypher ES AFM in tapping mode with standard probes (<8 nm tip radius, 325 kHz resonance frequency, 40 N m−1 force constant, HQ:NSC15/Al BS, MikroMasch). SEM imaging was carried out using a ThermoFisher Helios 5 UX FIB-SEM operating at 5 keV.Probe fabrication
SECCM probes were fabricated from quartz capillaries (1.2 mm outer diameter, 0.9 mm inner diameter, Sutter) using a Sutter P-2000 pipet puller. A two-line program was employed to yield pipets with ca. 500 nm terminal diameters (heat = 740, fil = 4, vel = 30, delay = 150, pull = 35/heat = 710, fil = 3, vel = 30, delay = 135, pull = 125). These probes were filled with an electrolyte consisting of 0.5 mM AgNO3 (ACS reagent grade ≥99.8%, Sigma Aldrich) and 50 mM NaClO4 (ACS reagent grade ≥98.0%, Sigma Aldrich) using a glass syringe (Microfil 34G) and a Ag wire (0.25 mm diameter, 99.997%, Goodfellow) was inserted in the open end of the pipet to complete the probe. All potentials cited herein are referenced vs. this QRCE. The geometry of the fabricated pipets were evaluated using SEM imaging (FEI Quanta FEG 450 @ 5 keV).SECCM measurements
A home-built setup was used to conduct all SECCM studies as detailed in previous reports from our lab.20 A C or ITO substrate was attached to a ceramic holder and mounted onto an inverted optical microscope equipped with a 50×, 0.5 NA objective. An SECCM probe was mounted to a 3-axis piezo system (PI NanoCube). The SECCM probe was translated towards the sample while applying a cathodic bias to the substrate, and probe–sample contact was detected as a sudden spike in current flow. A potential step waveform was then applied to the sample and the resulting current was recorded before retracting the probe and repeating this process at another location on the sample. Electrochemical measurements were made using a patch-clamp style amplifier (Dagan CHEM-CLAMP) and all instrumentation was controlled through custom LabView software.Results and discussion
SECCM measurements
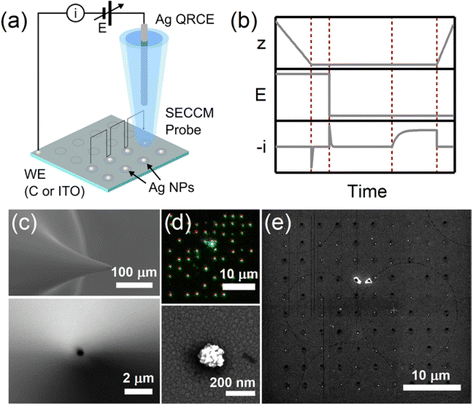
Single-particle electrodeposition studies were carried out using SECCM in a manner similar to prior work from our lab.27 In SECCM, an electrolyte-filled pipet with μm- or nm-scale dimensions is employed as an electrochemical probe. When the pipet is brought into contact with a sample, a miniaturized solid–electrolyte interface is created which enables local electrochemical measurements to be carried out by applying a bias between the sample and a quasireference-counter electrode (QRCE) immersed in the electrolyte at the opposite end of the probe.An illustration of the SECCM measurements carried out in this work is provided in Fig. 1. In these studies, the samples were planar C or ITO electrodes. The SECCM probes were quartz pipets filled with an aqueous electrolyte containing Ag+ ions and containing a Ag wire which served as a QRCE. Example SEM images of a typical probe are provided in Fig. 1c. In each measurement, an anodic bias was applied between the sample and QRCE while moving the probe towards the sample surface. An anodic current spike was observed upon probe–sample contact, at which point probe movement was stopped and the bias switched to a cathodic potential. This potential was held while monitoring the pA-scale currents flowing in the miniaturized SECCM cell. Due to the application of the cathodic potential, Ag+ ions are reduced, resulting in the formation of Ag nanoparticles (NPs) which is observed experimentally as a cathodic current transient which begins at some time after application of the cathodic bias, hereafter referred to as the nucleation time, tn. After a certain amount of charge has passed in the system, the probe is retracted and moved to a new lateral location on the sample surface. This process, illustrated in Fig. 1b, is repeated to map nucleation across a series of points in a rectangular array following a “hopping-mode” protocol. This process produces a rectangular array of Ag particles on the substrate which persists after termination of the experiment. Fig. 1d and e give optical and SEM images of such an array fabricated on ITO.
Single-particle nucleation and growth model
Here, Agn represents a NP consisting of n atoms and kn/k−n represent rate constants describing the addition/removal of an atom to/from the NP. Ag0 would represent a vacant surface site where nucleation is initiated. At small values of n, the free energy of formation for a particle of size n can be expressed as:
| ΔGf,n = ΔG0n + kbTχn2/3 |
where Va is the atomic volume of the material and B is a geometric factor describing the particle shape (see ESI† for details). As this surface energy term decreases with n, it has the effect of making ΔGn positive at low values of n, creating an energetic barrier which must be overcome for NP growth to proceed spontaneously. The “critical” particle size where ΔGf,n reaches a maximum (nc) can be found as:
Inadequacy of bulk models
A majority of studies of electrochemical nucleation reported to date employ kinetic models which assume a quasi-equilibrium exists among particles of different size on the substrate. Such a model predicts a static nucleation rate of the familiar form:1,30where A is a pre-exponential factor and ΔG‡ is the maximum particle free energy during the nucleation process. In single particle nucleation and growth experiments, where statistical distributions in nucleation times are analysed, a static nucleation rate would yield an exponential probability density for the nucleation time, tn:
| Pn(t) = knuce−knuct |
Discrete kinetic models for single particle studies
To properly treat experiments wherein quasi-equilibrium conditions cannot be established, a fully time-dependent approach is required. Following the reaction scheme above, the differential equations describing the change in the number of NPs of size n on a surface can be written as:where Γn is the density (cm−2) of NPs of size n on the surface. The rate constants in such a scheme will depend upon the difference in free energy of formation between particles of adjacent size:
| ΔGn = ΔG0 + kbTχ[n2/3 − (n − 1)2/3] |
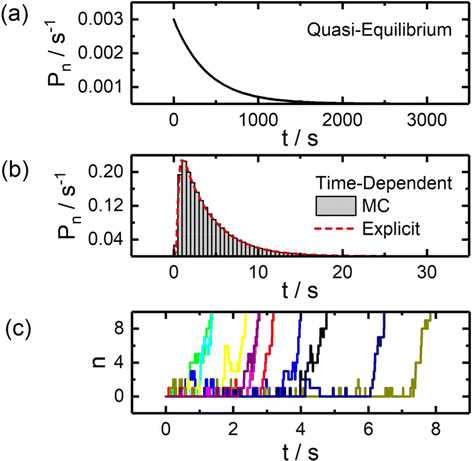
Example theoretical curves for modelling the statistical distribution of nucleation times via each method are presented in Fig. 2. The quasi-equilibrium approach commonly employed in bulk studies predicts an exponential distribution of nucleation times. An explicit time-dependent approach yields a log-normal shaped distribution which reflects the non-negligible time required to progress through the reaction sequence to reach stable nuclei sizes. The stochastic nature of this process at small particle sizes is illustrated in Fig. 2c, which depicts results from Monte Carlo simulations of particle nucleation.
 | ||
| Fig. 2 Statistical analysis of particle nucleation and growth via static and time-dependent models. (a) Probability density curve for particle nucleation assuming quasi-equilibrium conditions, yielding an exponential distribution. (b) Probability density curves calculated through explicit time-dependent solutions to the set of governing differential equations and Monte Carlo simulations (MC). (c) Example nucleation trajectories generated through Monte Carlo simulations. All simulations were carried out assuming η = −6, χ = 13, k0 = 10 s−1, and α = 0.5. See ESI† for additional details on the models employed. | ||
Beyond the basic differences in the shape of these distributions, it is also notable that these models differ greatly in terms of timescale, with the time-dependent model predicting nucleation times roughly 2 orders of magnitude smaller, further highlighting the need to carefully consider the model being employed if one is interested in extracting physically meaningful parameters (e.g., surface energies) from experimental data.
SECCM studies of NP nucleation kinetics
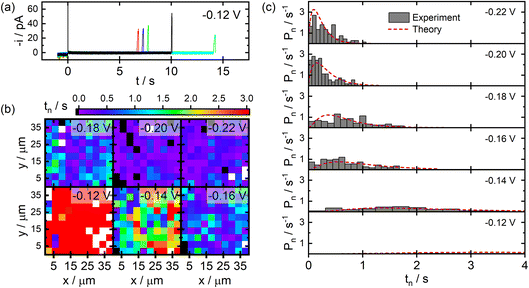
Results from SECCM studies of Ag NP nucleation on C film electrodes fabricated via the pyrolysis of photoresist films are presented in Fig. 3. Example current transients recorded during SECCM experiments are provided in Fig. 3a. Upon probe–sample contact, small anodic currents are observed until application of the cathodic potential at t = 0. A cathodic charging transient is then observed which quickly decays (<10 ms). The measured current then adopts a baseline value until it suddenly increases at a later time, signalling the nucleation and growth of an individual NP within the pipet–substrate interface. This process is highly stochastic, varying over seconds-long timescales between individual points in an SECCM experiment.Fig. 3b provides images of the measured NP nucleation times (tn) as a function of spatial position during SECCM experiments at different applied potentials. It is clear from these images that more negative applied potentials yield shorter nucleation times on average, as would be expected. There is also no discernible clustering of short or long nucleation times in these images, suggesting there are not any macroscopic structural features present on the electrode surface influencing nucleation kinetics.
Statistical distributions of the measured nucleation times at different applied potentials are provided in Fig. 3c. The distributions become narrower and shift to shorter nucleation times at larger overpotentials, consistent with the conclusions from the images discussed above. The distributions are decidedly non-exponential in shape, particularly at smaller overpotentials, providing direct experimental evidence that a quasi-equilibrium is not appropriate in the analysis of these experiments. The distributions were analysed by fitting the experimental data to the predictions of the time-dependent kinetic model, varying χ and k0 as model parameters. The resulting fits are shown in Fig. 3c. Excellent agreement between the experimental data and theory are observed for parameter values of χ = 8.9 and k0 = 1.9 s−1. Assuming a hemispherical NP geometry, this value of χ corresponds to an effective surface tension of γ = 150 mJ m−2 for the NPs deposited via SECCM.
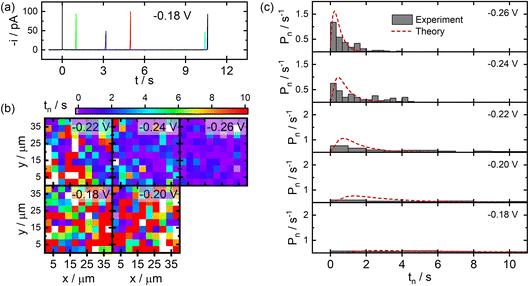
SECCM data acquired for the deposition of Ag NPs on ITO substrates are displayed in Fig. 4. Here, similar current transients were observed during deposition at random times after the application of the cathodic potential (Fig. 4a). The measured nucleation times exhibited the expected trend of shorter nucleation times at larger overpotentials, and no discernible spatial trends were visible in the SECCM images (Fig. 4b), similar to the case for C. Significant differences were observed, however, in the experimental distributions of nucleation times provided in Fig. 4c. Larger overpotentials are required on ITO in order to drive nucleation over reasonable timescales as compared to the C film electrodes. Also, the nucleation times appear to adopt distributions that are more exponential in shape at all but the lowest applied overpotentials (see Fig. S1 in the ESI†). This difference in behaviour is likely attributable to the known heterogeneous nature of ITO,31 making it likely that different populations of nucleation sites are contributing to the observed data. Fitting the distributions to a similar time-dependent kinetic model yields values of χ = 14.4 and k0 = 2.8 s−1. This larger value of χ corresponds to an effective surface energy of γ = 240 mJ m−2, reflecting significant differences in the stability of Ag–C and Ag–ITO interfaces. This is supported by significant morphological differences observed via SEM for Ag particles fabricated on C and ITO, with particles on C growing in a more conformal manner (see Fig. S2 in the ESI†).
It is worth noting that these surface energies would correspond to critical particle sizes of nc ≤ 2 for C and nc ≤ 3 for ITO under the conditions employed. While these numbers should only be taken as rough estimates, it suggests that single particle nucleation experiments carried out over practical timescales will provide information which is biased towards the properties of particles or clusters only a few atoms in size.
Conclusions
The SECCM studies detailed above provide new insights into the analysis of particle nucleation and growth in electrochemical systems. A statistical analysis of particle nucleation times enabled by the high-throughput nature of SECCM demonstrated traditional quasi-equilibrium kinetic models are not appropriate for the analysis of single particle data. Explicit time-dependent kinetic models have been presented which can appropriately model single particle studies to extract chemically meaningful parameters such as surface energies and kinetic rate constants. Moving forward, the approach presented here could find great utility in differentiating nucleation kinetics within structurally heterogeneous systems with electrochemical microscopy techniques such as SECCM.Data availability
SECCM data shown in this article are available at the WyoScholar Institutional Repository at https://doi.org/10.15786/M3PYHA.Author contributions
KO and CMH designed the experiments. KO and SR acquired all data. KO and CMH analysed the data and wrote the manuscript.Conflicts of interest
The authors have no conflicts to declare.Acknowledgements
The authors acknowledge generous support for this work from the National Science Foundation (CHE-2045593 and OIA-2119237) and the University of Wyoming School of Energy Resources. The SEM work was supported by the Wyoming Innovation Partnership.Notes and references
- A. Milchev, ChemTexts, 2016, 4, 1–9 Search PubMed.
- S. Fletcher, C. S. Halliday, D. Gates, M. Westcott, T. Lwin and G. Nelson, J. Electroanal. Chem. Interfacial Electrochem., 1983, 159, 267–285 CrossRef CAS.
- B. Scharifker and G. Hills, Electrochim. Acta, 1983, 28, 879–889 CrossRef CAS.
- M. Fleischmann, L. J. Li and L. M. Peter, Electrochim. Acta, 1989, 34, 475–483 CrossRef CAS.
- Q. Chen, L. Luo, H. Faraji, S. W. Feldberg and H. S. White, J. Phys. Chem. Lett., 2014, 5, 3539–3544 CrossRef CAS PubMed.
- Q. Chen, H. S. Wiedenroth, S. R. German and H. S. White, J. Am. Chem. Soc., 2015, 137, 12064–12069 CrossRef CAS PubMed.
- N. J. Vitti, P. Majumdar and H. S. White, Langmuir, 2023, 39, 1173–1180 CrossRef CAS.
- M. W. Glasscott and J. E. Dick, ACS Nano, 2019, 13, 4572–4581 CrossRef CAS.
- M. W. Glasscott and J. E. Dick, Anal. Chem., 2018, 90, 7804–7808 CrossRef CAS PubMed.
- J. E. Dick and A. J. Bard, J. Am. Chem. Soc., 2015, 137, 13752–13755 CrossRef CAS PubMed.
- H. E. M. Hussein, R. J. Maurer, H. Amari, J. J. P. Peters, L. Meng, R. Beanland, M. E. Newton and J. V Macpherson, ACS Nano, 2018, 12, 7388–7396 CrossRef CAS PubMed.
- S. C. S. Lai, R. A. Lazenby, P. M. Kirkman and P. R. Unwin, Chem. Sci., 2015, 6, 1126–1138 RSC.
- Y. Wang, E. Gordon and H. Ren, J. Phys. Chem. Lett., 2019, 10, 3887–3892 CrossRef CAS PubMed.
- Y. Liu, C. Jin, Y. Liu, K. H. Ruiz, H. Ren, Y. Fan, H. S. White and Q. Chen, ACS Sens., 2021, 6, 355–363 CrossRef CAS PubMed.
- C. L. Bentley and P. R. Unwin, Faraday Discuss., 2018, 210, 365–379 RSC.
- C. L. Bentley, M. Kang and P. R. Unwin, J. Am. Chem. Soc., 2019, 141, 2179–2193 CrossRef CAS PubMed.
- C. L. Bentley, M. Kang and P. R. Unwin, J. Am. Chem. Soc., 2017, 139, 16813–16821 CrossRef CAS PubMed.
- J. T. Mefford, A. R. Akbashev, M. Kang, C. L. Bentley, W. E. Gent, H. D. Deng, D. H. Alsem, Y.-S. Yu, N. J. Salmon, D. A. Shapiro, P. R. Unwin and W. C. Chueh, Nature, 2021, 593(7857), 67–73 CrossRef CAS PubMed.
- M. Li, K.-H. Ye, W. Qiu, Y. Wang and H. Ren, J. Am. Chem. Soc., 2022, 144, 5247–5252 CrossRef CAS.
- P. Saha, J. W. Hill, J. D. Walmsley and C. M. Hill, Anal. Chem., 2018, 90, 12832–12839 CrossRef CAS.
- P. Saha, Md. M. Rahman and C. M. Hill, Electrochem. Sci. Adv., 2022, 2, e2100120 CrossRef CAS.
- J. W. Hill and C. M. Hill, Chem. Sci., 2021, 12, 5102–5112 RSC.
- J. W. Hill and C. M. Hill, Nano Lett., 2019, 19, 5710–5716 CrossRef CAS.
- C. L. Tolbert and C. M. Hill, Faraday Discuss., 2022, 233, 163–174 RSC.
- Y. Wang, M. Li, E. Gordon, Z. Ye and H. Ren, Anal. Chem., 2022, 94, 9058–9064 CrossRef CAS PubMed.
- M. Li, Y. Wang, B. Blount, E. Gordon, J. A. Muñoz-Castañeda, Z. Ye and H. Ren, Nano Lett., 2022, 22, 6313–6319 CrossRef CAS PubMed.
- Md. M. Rahman, C. L. Tolbert, P. Saha, J. M. Halpern and C. M. Hill, ACS Nano, 2022, 16, 21275–21282 CrossRef CAS.
- H. Lee, K. C. Matthews, X. Zhan, J. H. Warner and H. Ren, ACS Nano, 2023, 17, 22499–22507 CrossRef CAS PubMed.
- E. K. Walker, D. A. Vanden Bout and K. J. Stevenson, Langmuir, 2012, 28, 1604–1610 CrossRef CAS.
- E. Budevski, G. Staikov and W. J. Lorenz, Electrochemical Phase Formation and Growth, 1996, DOI:10.1002/9783527614936.
- O. J. Wahab, M. Kang, G. N. Meloni, E. Daviddi and P. R. Unwin, Anal. Chem., 2022, 94, 4729–4736 CrossRef CAS PubMed.
Footnote |
| † Electronic supplementary information (ESI) available: Additional figures and details on theoretical models employed. See DOI: https://doi.org/10.1039/d4fd00131a |
| This journal is © The Royal Society of Chemistry 2025 |


