 Open Access Article
Creative Commons Attribution 3.0 Unported Licence
Multimodal nanoparticle analysis enabled by a polymer electrolyte nanopore combined with nanoimpact electrochemistry†
Eugene
Gyasi Agyemang‡
 ae,
Samuel
Confederat‡
bc,
Gayathri
Mohanan‡
bc,
Mahnaz
Azimzadeh Sani
 d,
Chalmers
Chau
bc,
Dylan
Charnock
bc,
Christoph
Wälti
bc,
Kristina
Tschulik
 d,
Martin Andrew
Edwards
 *ae and
Paolo
Actis
 *bc
*bc
aDepartment of Chemistry and Biochemistry, University of Arkansas, Fayetteville, AR 72701, USA. E-mail: maedw@uark.edu
bBragg Centre for Materials Research, University of Leeds, LS2 9JT, UK. E-mail: p.actis@leeds.ac.uk
cSchool of Electronic and Electrical Engineering and Pollard Institute, University of Leeds, Leeds LS2 9JT, UK
dRuhr University Bochum, Universitätsstraße 150, Bochum 44801, Germany
eMaterials Science and Engineering, University of Arkansas, Fayetteville, AR 72701, USA
First published on 22nd July 2024
Abstract
Nanopores are emerging as a powerful tool for the analysis and characterization of nanoparticles at the single entity level. Here, we report that a PEG-based polymer electrolyte present inside the nanopore enables the enhanced detection of nanoparticles at low ionic strength. We develop a numerical model that recapitulates the electrical response of the glass nanopore system, revealing the response to be sensitive to the position of the polymer electrolyte interface. As proof of concept, we demonstrate the multimodal analysis of a nanoparticle sample by coupling the polymer electrolyte nanopore sensor with nanoimpact electrochemistry. This combination of techniques could deliver the multiparametric analysis of nanoparticle systems complementing electrochemical reactivity data provided by nanoimpact electrochemistry with information on size, shape and surface charge provided by nanopore measurements.
Introduction
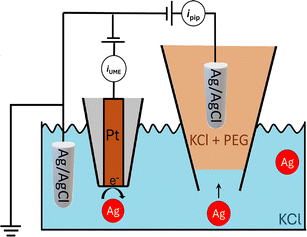
Over the past few decades, nanoparticles have played significant roles in scientific and technological disciplines, ranging from medicine to materials science.1,2 Characterizing a functional nanoparticle’s physical parameters (size, shape, etc.) coupled with chemical reactivity is crucial for determining structure–function relationships and to guide future developments.3 Moreover, the ability to characterize nanoparticles in solution and in real-time is of utmost importance as it would allow, for example, in-flow optimization of nanoparticle synthesis or characterization of dynamic processes in solution.4 However, physico-chemical characterization of nanoparticles in heterogenous mixtures is challenging.5 While dynamic light scattering (DLS) or UV-vis spectroscopy provide robust information on size distributions, they are ensemble-averaging techniques and, therefore, fall short in fully characterizing heterogenous nanoparticle mixtures.6 Nanoparticle tracking analysis (NTA) can analyse polydisperse nanoparticles with single-entity resolution, however the nanoparticles need to have a refractive index distinct from the surrounding medium or be modified with a fluorescent label.7 Electron microscopy approaches such as transmission electron microscopy (TEM) provide high-resolution characterization of individual nanoparticles but suffer from sampling bias, low throughput, require careful sample preparation, and are ex situ.3Nanopore sensing, shown schematically in Fig. 1, is a powerful label-free electrical technique where single entities passing through a small opening between two electrolyte-filled electrode-containing reservoirs, causes temporary current modulation. In the figure, as in this work, the interior of a nanopipette is one reservoir while the orifice at the end of the pipette is the nanopore. The magnitude, duration and shape of the current modulation reflect the physical properties8 (e.g., size, shape, charge) of the analyte and its translocation dynamics, as it is driven through the pore by an electric field and/or other forces.9 We have shown the large enhancement of the detection sensitivity of a conical glass nanopore with the addition of the polymer polyethylene glycol (PEG) to the electrolyte in the external bath solution.10,11 This discovery enabled the probing of viral RNAs,10 the supramolecular assembly of DNA origami,12 and the high-throughput characterization of heterogeneous nanoparticle mixtures at low ionic strength.13
Our interpretation of the mechanism of enhancement is based on evidence that the affinity of cations to PEG causes a higher anion transference number in PEG compared to aqueous solutions. This causes the ion concentration at the nanopore opening to vary with the applied potential. Ion enrichment is observed at positive potentials and ion depletion at negative potentials (measured at the internal electrode vs. ground in the bath). Furthermore, we postulated that the interface near the nanopore opening gets disrupted by the translocation of an analyte. We demonstrated using a range of model analytes, that such interactions could lead to alteration of the ion distribution at the tip orifice, which can result in temporary current increases.10–12,14
Our mechanistic description of the system suggests that ion transport in and around the interface between the polymer electrolyte and the aqueous solution, plays a key role in determining the sensitivity of the system. Herein, we investigate the reverse approach when the polymer electrolyte is placed inside the pipette and the nanoparticle samples are in the bath, a format more amenable to sensing applications.
We report that the signal enhancement is also obtained when the nanoparticle translocations are performed in a bath-to-nanopore configuration and the polymer electrolyte is only present in the nanopore, as shown in Fig. 1. We developed a numerical model that recapitulates the electrical response of the nanopore system and provides a physical explanation for the enhanced current. Furthermore, we demonstrate multimodal analysis of a nanoparticle sample by coupling nanopore sensing with nanoimpact electrochemistry. Nanoimpact electrochemistry allows for the high throughput electrochemical analyses of colloidal (sub-)micro-to nanometer sized particles based on their stochastic collisions on a micro- or nanoelectrode.15 This combination of techniques could allow for the multiparametric analysis of nanoparticle systems where the information on size, shape and surface charge provided by nanopore sensing can be merged with the (electro)chemical reactivity data provided by nanoimpact electrochemistry.
Results and discussion
Electrochemical characterization
We demonstrated that a polymer electrolyte nanopore system enables the enhanced detection of nanoparticle samples when a PEG-based polymer electrolyte is present inside the nanopipette.We first developed a numerical model that allows determination of the coupled electric potential and ion transport within the system. The model, which is described in detail in the ESI (Section S1),† is based on that described in Marcuccio et al.14 Briefly, the nanopipette is described as a truncated cone with charged glass walls that are impermeable to ions. The bulk concentration of the ions is fixed far inside the pipette and far into the bath solution at the experimentally prepared concentration (20 mM KCl) while a potential bias, E, is applied between an electrode inside the pipette vs. ground in the bath solution. The current is calculated by integrating the fluxes of both ions across the internal electrode (eqn S3†).
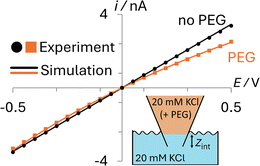
The transport properties of the ions in the aqueous and PEG-containing phases, the geometry of the pipette, and the surface charge on the glass were all calculated from complementary experimental measurements, as detailed in ESI Section S2.† As can be seen in Fig. 2, simulations using these parameters (solid lines) quantitatively match experiments (points) both when the nanopipette contains 20 mM KCl (black; no PEG) or 20 mM KCl + 25% (w/v) 35K PEG (orange; PEG) that is immersed in a bath containing 20 mM KCl (Section S2.4†).
While the interface between the PEG-containing and aqueous electrolytes likely occupies a finite width mixing region, to avoid adding additional parameters to the model, we describe it as a discrete interface (see inset in Fig. 2). When the interface is modelled as residing exactly at the pipette orifice, poor agreement is observed between the experimental and simulated i–E response (see ESI Section S3, Fig. S6†). Yet when the interface is moved slightly inside the pipette (Zint = 8 μm), as can be seen in Fig. 2, the simulated current (orange line) quantitatively captures the experimental i–E behavior (orange points). This apparent position of the interface likely accounts for the finite width of the interface and possibly how easily the viscous PEG-containing solution enters the nanopipette when backfilled.
The i–E response of a 20 mM PEG-electrolyte filled nanopipette immersed in a bath containing 20 mM KCl is nonlinear (rectified), with lower current magnitudes at positive potentials compared to their negative counterparts. At all potentials, the currents for the PEG-containing pipette (orange) are lower than their counterparts for the no-PEG case (black). The rectification can be understood by consideration of the ion distributions within the pipette at representative potentials of ±0.5 V, which are shown in Fig. 3 (see ESI† for concentrations at other potentials). Note, for simplicity Fig. 3 shows the average ion concentration, however this is representative of the K+ and Cl− concentration in all but the electric double layer (see ESI Section S5.1† for details). At negative potentials (left), red and orange colors indicate that the concentration just inside the nanopipette is higher than the bulk concentration (blue-green color; 20 mM), whereas at positive potentials (right) the concentration is diminished (dark blue). These swings in concentration cause the corresponding changes in resistance that cause the rectified i–E response for the PEG-electrolyte filled nanopipette.
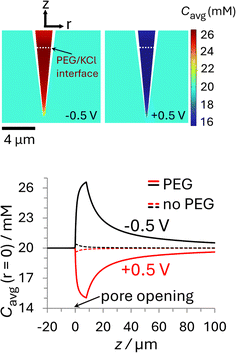 | ||
| Fig. 3 Plots of the simulated ion concentration around the nanopipette tip at ±0.5 V. (top) Color plots of average concentration (Cavg = 1/2([K+] + [Cl−])) for the PEG-in-nanopipette/KCl-in-bath configuration at (left) −0.5 V and (right) +0.5 V. The white dashed line represents the interface between phases at Zint = 8 μm. (bottom) Average ion concentrations along the nanopipette axis of symmetry. The solid curves are for the PEG-in-nanopipette/KCl-in-bath configuration and the dashed lines for KCl in the bath and nanopipette (no PEG). Nanopipette radius: 70 nm. PEG: 25% (w/v) PEG 35K + 20 mM KCl. KCl: 20 mM KCl. The individual cation and anion concentration distributions are included in the ESI Section S5.1.† For color plots of Cavg with 20 mM KCl in the bath and nanopipette see Fig. S11.† See Fig. S10† for axial concentrations at other potentials. | ||
A quantitative comparison can easily be achieved by considering the axial concentration distribution along the pipette, which is shown in the lower part of Fig. 3. The solid lines, which were taken under the same conditions as the upper panel (PEG in pipette/KCl bath), but over a greater vertical range, show the concentration is enhanced up to 32% (−0.5 V) or decreased by as much as 25% (+0.5 V), with each extremum occurring at the location of the PEG/KCl interface (z = 8 μm). The dashed lines show the changes in concentration with no PEG in the pipette, which are due to the surface charge and geometric asymmetry of the conical nanopore.16 They are much smaller (±2%) relative to the PEG-in-pore configuration, but with the enhancement and depletion again occurring at negative and positive potentials, respectively (see Fig. S11 in the ESI† for colour plots for this condition). The small potential-dependent concentration variation, and hence change in conductivity, for the KCl/KCl case explains why the i–E response (black line Fig. 2) is close to linear. Interestingly, while the concentration inside the PEG-electrolyte containing nanopipette at −0.5 V is greater than at the same potential for a non-PEG containing electrolyte the diminished mobilities in PEG lead to an overall lower current.
To understand the origin of the ion accumulation/depletion within the PEG-electrolyte containing nanopipette requires consideration of the transport of the two ions in both phases. While the increased viscosity of the PEG solution leads to lower conductivity (0.119 S m−1vs. 0.386 S m−1 in 20 mM KCl) there are differences in the relative values of the diffusion coefficients (see ESI Section S2.4†). While the transference numbers of K+ and Cl− in aqueous electrolyte are approximately equal (DK+/DCl− ≈ 0.96)17 the affinity of cations for the PEG leads to K+ having a lower transference number than Cl− with  . This leads the interface between the PEG-containing and aqueous electrolytes to behave selectively for the transport of anions. At negative potentials, the anion-selective nature of the interface leads the cations that are driven inwards by the electric field to accumulate near the interface. This in turn triggers a compensatory accumulation of anions to maintain electroneutrality. At positive potentials, the opposite is true and the concentration around the end of the pipette decreases.
Ion current rectification in nanopores is typically associated with the charge on the glass surface introducing ion selectivity to a nanopore when the double layer thickness is a significant proportion of the pore diameter.16,18 Yet in the PEG-electrolyte system the ion selectivity arises from a fundamentally different mechanism. This can be confirmed by simulations in which the surface charge is set to 0 and which show negligible change in the rectified i–E response (see ESI Section S4, Fig. S7–S11†).
Nanoparticle translocations
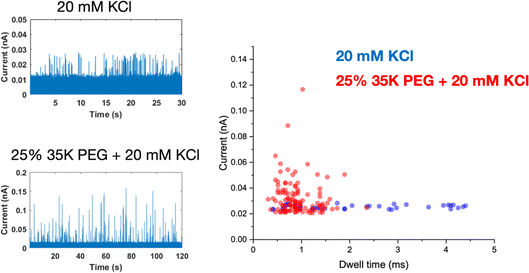
A glass nanopore filled with a polymer electrolyte enables the enhanced detection of nanoparticles. We first fabricated a 140 nm glass nanopore, immersed it in an electrolyte solution, and applied a potential bias between a pair of Ag/AgCl (one in the bath, one in the nanopore). The potential drives nanoparticle translocation from the trans chamber (external bath) to the cis chamber (inside the glass nanopore). Nanoparticle translocations were observed when the pore was filled with a solution of 25% 35K PEG + 20 mM KCl but not when the pore was filled with 20 mM KCl (no PEG). To improve the signal to noise ratio, we then fabricated glass nanopores with a diameter of 60 nm and probed the translocation of the 30 nm diameter silver nanosphere under a range of applied voltages (Fig. 4). Where the setup was as described for the 140 nm pore above (25% 35K PEG + 20 mM KCl in the pore). Fig. 4 shows representative ion current traces with increasing applied voltage where individual nanoparticle translocations can be identified from 200 mV.Interestingly, the presence of the polymer electrolyte inside the glass nanopore enhances both the amplitude and the number of translocation events, thus facilitating nanoparticle detection (Fig. 5). We observed a similar enhancement when the polymer electrolyte was only present in the bath solution; but it has to be noted that in the “nanopore-to-bath” configuration the nanoparticle translocation led to conductive events while in the “bath-to-nanopore” we observed only resistive events. This indicates that the mechanism responsible for the signal enhancement could be different from the one reported before14 and its precise elucidation will require further work which is beyond the scope of this paper.
With PEG in the pipette, nanoparticle translocations can also be observed under very low ionic strength solution (5 mM KCl) and we have also demonstrated the detection of Pt nanoparticle translocation directly in a citrate buffer without the addition of any supporting electrolyte (Fig. S13†). The amplitude of the single entity events decreases with decreasing concentrations of the supporting electrolyte but, even in the absence of KCl, the signal to noise ratio is large enough to allow the robust identification of single entity events.
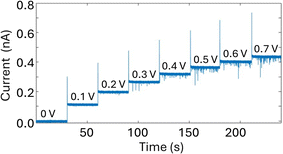
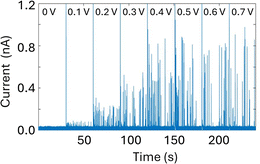
An important consequence of enabling outside-to-inside nanoparticle analysis is that multiple sensors can be integrated in the trans chamber to enable multimodal nanoparticle detection. As a proof-of-concept, we demonstrate the integration of a Pt-microelectrode within the trans chamber to perform nanoimpact measurements of the Ag nanoparticle sample. Nanoimpact experiments rely on random collision of micro or nanoparticles with a polarized electrode due to their Brownian motion in solutions, thus providing an efficient approach for electrochemical detection and characterization of electrochemically active nanoparticles. Oxidative nanoimpact events can be detected from an applied voltage of 100 mV (vs. Ag/AgCl) and their amplitude increases with increasing applied voltages (Fig. 6), demonstrating that the experimental setup and the buffer environment is compatible for a multi-sensor analysis of nanoparticle samples.
Discussion
Here we reported the combination of nanopore sensing with nanoimpact electrochemistry to provide enhanced analysis of nanoparticle samples. This approach combines shape, charge, and volume sensitivity of nanopore sensing with the ability of nanoimpact electrochemistry to probe electrochemical activity. This approach uniquely enables the detection of nanoparticles under low ionic strength (20 mM) which is still a great challenge in nanopore sensing, potentially allowing the detection of nanoparticle samples prone to aggregation under high ionic strength. In the future, sensor fusion approaches19 could also be integrated to combine the outputs of both sensors to provide precise physical and chemical characterization of heterogenous nanoparticle samples. Importantly this integration will also require advancements in the signal processing algorithms to take full advantage of advanced machine learning routines.20–22The approach described in this work involves two distinct sensors (a glass nanopore and a Pt microelectrode) to perform the multimodal nanoparticle analysis, but Pandey et al. have shown that an integrated nanopore-nanoelectrode setup can be implemented for single entity detection23 and for intracellular delivery.24 Similarly, Ren et al. constructed a nanopore field-effect transistor that could also be employed for multimodal nanoparticle sensing.25 An alternative approach could also rely on the application of pressure to drive the nanoparticle translocations.26
Also, this work complements the work by Kawaguchi et al.27 that reported the enhanced nanoparticle sensing in a highly viscous nanopore by showing that the interfacial properties at the nanopore are also responsible for its sensing performance.
The key advantage of utilising nanopipettes is that they can be integrated with micromanipulators and multi-well plates, in an a similar way to liquid handling robots, to enable the automated analysis of several analytes sequentially, in a similar way to the work of Liang et al., where they employed a robotic electrochemical reader for biosensing.28 Also, nanopipettes can be integrated with nanomanipulators to comprise a scanning probe microscopy setup to allow for the nanoscale analysis of single entities.29
Conclusion
We have shown that there is a significant enhancement of the detection sensitivity of a conical glass nanopore, for bath-to-nanopore translocating events, when the nanopore electrolyte is composed of 25% (w/v) 35K-PEG in 20 mM KCl.We developed a numerical model that recapitulates the electrical response of the nanopore system and provides a physical explanation for the enhanced current. Our interpretation of the mechanism of enhancement is based on evidence that the affinity of cations to PEG causes a higher anion transference number in PEG compared to aqueous solutions, which generates a voltage-dependent ion concentration distribution in the vicinity of the nanopore orifice with a concentration enhancement at negative biases and depletion at positive biases. The model reveals that the electrical response of the glass nanopore is sensitive to the position of the PEG interface.
As a proof of concept, multimodal analysis of a nanoparticle sample was demonstrated by coupling the polymer electrolyte nanopore sensor with nanoimpact electrochemistry. This combination of techniques could deliver the multiparametric analysis of nanoparticle systems yielding (electro)chemical reactivity data provided by nanoimpact electrochemistry in addition to information on size, shape and surface charge provided by nanopore measurements. We hope that this approach will lead to new insights in structure–function relationships of functional nanoparticles.
Materials and method
Chemicals and materials
All reagents used in the translocation experiments were prepared using ultra-pure water (18.2 MΩ cm) from a Millipore system and further filtered through a 0.22 μm syringe. KCl, Triton-X, EDTA, and PEG reagents were purchased from Sigma-Aldrich. Ag and Pt spherical nanoparticles (citrate capped, 30 nm radius) were purchased from the nanoXact range from nanoComposix and were used as received. Silver wire (0.25 mm diameter) used in the nanopore experiments was obtained from Alfa Aesar.Electrolyte conductivity measurement
All electrolyte conductivity was measured with the Traceable™ Conductivity Meter Pen (11714226, Fisher Scientific).Standard nanoparticle characterization
The stability of the gold nanoparticles diluted in the KCl translocation buffer was probed by UV-vis measurements using a NanoDrop ND-1000 spectrophotometer (Thermo Scientific). The size distribution and the ζ-potential of the standard nanoparticles in pure water and 20 mM KCl solution was determined by Zetasizer NanoZS (Malvern Instruments Ltd) and are shown in Fig. S14 and 15.† All the standard nanosphere samples were used as received.Nanopore fabrication and characterization
The nanopores were fabricated starting from 1.0 mm × 0.5 mm quartz capillaries (QF120-90-10; Sutter Instrument, UK) with the SU-P2000 laser puller (World Precision Instruments, UK), using a two-line program: (1) HEAT, 750; FILAMENT, 4, VELOCITY, 30; DELAY, 145, PULL, 80; (2) HEAT, 600, FILAMENT, 3; VELOCITY, 40; DELAY, 135; PULL, 150. The pulling parameters are instrument specific and lead to a glass nanopore with a diameter of ≈60 nm. Adjustments of the HEAT and PULL parameters were made to fabricate other pore sizes specified in this study. The pulled glass nanopores were characterized by measuring their pore resistance in 0.1 M KCl and the pore dimensions were confirmed using scanning electron microscopy (SEM) using a Nova NanoSEM at an accelerating voltage of 3–5 kV.Polymer electrolyte preparation
The KCl electrolyte was first dissolved with 18.2 MΩ ddH2O to a final concentration of 1 M, the solution was then filtered through a 0.22 μm syringe membrane filter (E4780-1223; Starlab UK). For example, to generate 10 mL of the 50% (w/v) PEG with 20 mM KCl, 0.2 mL of the 0.22 μm filtered 1 M salt solution, 4.8 mL of 0.22 μm filtered 18.2 MΩ cm ddH2O and 5 g of PEG 35 kDa (ultrapure grade, Sigma-Aldrich) were mixed inside a tube. The tube was then left inside a 70 °C incubator for 2 hours and kept at 37 °C overnight. The tubes were then left on a bench for 4 hours to reach room temperature prior to use. The polymer electrolyte was then stored at room temperature.Nanopore translocation measurements
A Ag/AgCl wire (0.25 mm diameter, GoodFellow UK) was inserted in the glass nanopore barrel and acted as the working electrode. The counter/reference electrode consisted of a second Ag/AgCl wire electrode directly placed in the bath or, where stated in the caption, a Ag/AgCl electrode in a 20 mM KCl filled capillary separated by a glass frit. In some experiments, a Ag/AgCl frit filled with 20 mM KCl was used. The nanoparticles were driven from the external bath into the nanopipette by applying a positive potential to the working electrode placed inside the glass nanopore with respect to the reference electrode in the bath. The ion current was recorded either with a MultiClamp 700B patch-clamp amplifier (Molecular Devices) in voltage-clamp mode at a 100 kHz sampling rate with a 20 kHz low-pass filter using the pClamp10 software (Molecular Devices) or using the Nanopore reader (Elements srl) 100 kHz sampling rate with a 20 kHz low-pass filter.Nanoimpact measurements
Nanoimpact electrochemistry experiments were performed using a 2-electrode configuration using a Pt microelectrode (10 μm in diameter) as the working electrode and a Ag/AgCl frit filled with 20 mM KCl as the reference/counter electrode. Data were acquired with the nanopore reader (Elements srl) with a 100 kHz sampling rate and a 20 kHz low-pass filter.Numerical simulations
A numerical model was developed which included equations describing the electrical potential and ion concentrations distribution inside and around the glass nanopore filled with polymer electrolyte. The pore geometry was approximated as a truncated cone. The simulations were implemented using the commercial finite element software COMSOL Multiphysics (version 6.0 & Chemical Reaction Engineering module) to solve the coupled Poisson and Nernst–Planck equations (see ESI Section S1.1†). The simulations are based on our model of a glass nanopore immersed in a polymer electrolyte14 and are described briefly below. Further details, including the determination of physical parameters, can be found in Section S1.1 of the ESI.†Boundary conditions, which are listed in the ESI†, were chosen to reflect the experimental system, and include an applied potential at the internal electrode vs. an external electrode at ground, surface charge on, and no ion transport through, the glass walls, and bulk solution concentrations. Ion transport depends on the phase (PEG + KCl or KCl) with diffusion coefficients chosen to match the experimentally measured solution conductivities. In KCl, the diffusion coefficients of the K+ and Cl− are approximately equal17 (DK+![[thin space (1/6-em)]](https://www.rsc.org/images/entities/char_2009.gif) :
:![[thin space (1/6-em)]](https://www.rsc.org/images/entities/char_2009.gif) DCl− = 0.49
DCl− = 0.49![[thin space (1/6-em)]](https://www.rsc.org/images/entities/char_2009.gif) :
:![[thin space (1/6-em)]](https://www.rsc.org/images/entities/char_2009.gif) 0.51) while in the PEG Cl− is more mobile14 with the ratio DK+
0.51) while in the PEG Cl− is more mobile14 with the ratio DK+![[thin space (1/6-em)]](https://www.rsc.org/images/entities/char_2009.gif) :
:![[thin space (1/6-em)]](https://www.rsc.org/images/entities/char_2009.gif) DCl− = 0.45
DCl− = 0.45![[thin space (1/6-em)]](https://www.rsc.org/images/entities/char_2009.gif) :
:![[thin space (1/6-em)]](https://www.rsc.org/images/entities/char_2009.gif) 0.55 (see ESI† for details). For simplicity, we took the interface between the PEG + KCl and KCl to have zero width, i.e., mixing of the solutions was neglected, with the interface determined to reside inside the pipette by ∼8 μm (see ESI Section S3† for details).
0.55 (see ESI† for details). For simplicity, we took the interface between the PEG + KCl and KCl to have zero width, i.e., mixing of the solutions was neglected, with the interface determined to reside inside the pipette by ∼8 μm (see ESI Section S3† for details).
Data availability
The data that support the findings of this study are openly available from the University of Leeds data repository at https://doi.org/10.5518/1599.Conflicts of interest
The authors declare no competing interests.Acknowledgements
We thank Dr Alexander Kulak for the help provided with SEM imaging of the glass nanopores. S. C., K. T., P. A. acknowledge funding from the European Union’s Horizon 2020 research and innovation 7 program under the Marie Skłodowska-Curie MSCA-ITN grant agreement no. 812398, through the single-entity nanoelectrochemistry, SENTINEL, project. P. A. acknowledges funding from the European Research Council (ERC) under the project DYNAMIN, grant agreement no. 788968. P. A. , C. C. and C. W. acknowledge funding from the Engineering and Physical Sciences Research Council UK (EPSRC) Healthcare Technologies under the grant EP/W004933/1, and S. C. and C. W. acknowledge funding from the Medical Research Council (MRC) UK under the grant MR/No. 029976/1. Numerical simulations made use of resources available at the Arkansas High Performance Computing Center supported in part by National Science Foundation grants #0722625, #0959124, #0963249, #0918970 and the Arkansas Science and Technology Authority. The work in the Edwards lab was supported by the Arkansas Biosciences Institute.References
- N. Joudeh and D. Linke, Nanoparticle classification, physicochemical properties, characterization, and applications: a comprehensive review for biologists, J. Nanobiotechnol., 2022, 20(1), 262 CrossRef.
- W. J. Stark, P. R. Stoessel, W. Wohlleben and A. Hafner, Industrial applications of nanoparticles, Chem. Soc. Rev., 2015, 44, 5793–5805 RSC.
- M. M. Modena, B. Rühle, T. P. Burg and S. Wuttke, Nanoparticle Characterization: What to Measure?, Adv. Mater., 2019, 31(32), 1901556 CrossRef.
- S. Gimondi, H. Ferreira, R. L. Reis and N. M. Neves, Microfluidic Devices: A Tool for Nanoparticle Synthesis and Performance Evaluation, ACS Nano, 2023, 17, 14205–14228 CrossRef CAS.
- X. Xu, D. Valavanis, P. Ciocci, S. Confederat, F. Marcuccio, J.-F. Lemineur, P. Actis, F. Kanoufi and P. R. Unwin, The New Era of High-Throughput Nanoelectrochemistry, Anal. Chem., 2023, 95, 319–356 CrossRef CAS PubMed.
- E. Tomaszewska, K. Soliwoda, K. Kadziola, B. Tkacz-Szczesna, G. Celichowski, M. Cichomski, W. Szmaja and J. Grobelny, Detection Limits of DLS and UV-vis Spectroscopy in Characterization of Polydisperse Nanoparticles Colloids, J. Nanomater., 2013, 2013, 1–10 Search PubMed.
- V. Filipe, A. Hawe and W. Jiskoot, Critical Evaluation of Nanoparticle Tracking Analysis (NTA) by NanoSight for the Measurement of Nanoparticles and Protein Aggregates, Pharm. Res., 2010, 27, 796–810 CrossRef CAS.
- L. Xue, H. Yamazaki, R. Ren, M. Wanunu, A. P. Ivanov and J. B. Edel, Solid-state nanopore sensors, Nat. Rev. Mater., 2020, 5, 931–951 CrossRef CAS.
- S. R. German, L. Luo, H. S. White and T. L. Mega, Controlling Nanoparticle Dynamics in Conical Nanopores, J. Phys. Chem., 2012, 117, 703–711 Search PubMed.
- C. Chau, F. Marcuccio, D. Soulias, M. A. Edwards, A. Tuplin, S. E. Radford, E. Hewitt and P. Actis, Probing RNA Conformations Using a Polymer–Electrolyte Solid-State Nanopore, ACS Nano, 2022, 16, 20075–20085 CrossRef CAS.
- C. C. Chau, S. E. Radford, E. W. Hewitt and P. Actis, Macromolecular Crowding Enhances the Detection of DNA and Proteins by a Solid-State Nanopore, Nano Lett., 2020, 20, 5553–5561 CrossRef CAS PubMed.
- S. Confederat, I. Sandei, G. Mohanan, C. Walti and P. Actis, Nanopore fingerprinting of supramolecular DNA nanostructures, Biophys. J., 2022, 121, 4882–4891 CrossRef CAS PubMed.
- S. Confederat, S. Lee, D. Vang, D. Soulias, F. Marcuccio, T. I. Peace, M. A. Edwards, P. Strobbia, D. Samanta, C. Wälti and P. Actis, Next-Generation Nanopore Sensors Based on Conductive Pulse Sensing for Enhanced Detection of Nanoparticles, Small, 2023, 20(4), 2305186 CrossRef PubMed.
- F. Marcuccio, D. Soulias, C. C. C. Chau, S. E. Radford, E. Hewitt, P. Actis and M. A. Edwards, Mechanistic Study of the Conductance and Enhanced Single-Molecule Detection in a Polymer–Electrolyte Nanopore, ACS Nanosci. Au, 2023, 3, 172–181 CrossRef CAS PubMed.
- M. Azimzadeh Sani and K. Tschulik, Unveiling colloidal nanoparticle properties and interactions at a single entity level, Curr. Opin. Electrochem., 2023, 37, 101195 CrossRef CAS.
- C. Wei, A. J. Bard and S. W. Feldberg, Current Rectification at Quartz Nanopipet Electrodes, Anal. Chem., 1997, 69, 4627–4633 CrossRef CAS.
- CRC Handbook of Chemistry and Physics, ed. W. M. Haynes, Boca Raton, 2016 Search PubMed.
- W.-J. Lan, M. A. Edwards, L. Luo, R. T. Perera, X. Wu, C. R. Martin and H. S. White, Voltage-Rectified Current and Fluid Flow in Conical Nanopores, Acc. Chem. Res., 2016, 49, 2605–2613 CrossRef CAS PubMed.
- R. R. de Oliveira, C. Avila, R. Bourne, F. Muller and A. de Juan, Data fusion strategies to combine sensor and multivariate model outputs for multivariate statistical process control, Anal. Bioanal. Chem., 2020, 412, 2151–2163 CrossRef CAS PubMed.
- V. Shkirskiy and F. Kanoufi, Key requirements for advancing machine learning approaches in single entity electrochemistry, Curr. Opin. Electrochem., 2024, 46, 101526 CrossRef CAS.
- H. Chen, E. Kätelhön and R. G. Compton, Machine learning in fundamental electrochemistry: Recent advances and future opportunities, Curr. Opin. Electrochem., 2023, 38, 101214 CrossRef.
- Z. Zhao, A. Naha, N. Kostopoulos and A. Sekretareva, Advanced Algorithm for Step Detection in Single-Entity Electrochemistry: A Comparative Study of Wavelet Transforms and Convolutional Neural Networks, Faraday Discuss., 2024 10.1039/d4fd00130c.
- P. Pandey, N. Bhattarai, L. Su, X. Wang, F. Leng, B. Gerstman, P. P. Chapagain and J. He, Detecting Individual Proteins and Their Surface Charge Variations in Solution by the Potentiometric Nanoimpact Method, ACS Sens., 2022, 7, 555–563 CrossRef CAS PubMed.
- P. Pandey, A. Sesena-Rubfiaro, S. Khatri and J. He, Development of multifunctional nanopipettes for controlled intracellular delivery and single-entity detection, Faraday Discuss., 2022, 233, 315–335 RSC.
- R. Ren, Y. Zhang, B. P. Nadappuram, B. Akpinar, D. Klenerman, A. P. Ivanov, J. B. Edel and Y. Korchev, Nanopore extended field-effect transistor for selective single-molecule biosensing, Nat. Commun., 2017, 8(1), 586 CrossRef PubMed.
- M. A. Edwards, S. R. German, J. E. Dick, A. J. Bard and H. S. White, High-Speed Multipass Coulter Counter with Ultrahigh Resolution, ACS Nano, 2015, 9, 12274–12282 CrossRef CAS PubMed.
- T. Kawaguchi, M. Tsutsui, S. Murayama, I. W. Leong, K. Yokota, Y. Komoto and M. Taniguchi, Enhanced Nanoparticle Sensing in a Highly Viscous Nanopore, Small Methods, 2024, 8, 2301523 CrossRef CAS.
- S. Liang, A. B. Kinghorn, M. Voliotis, J. K. Prague, J. D. Veldhuis, K. Tsaneva-Atanasova, C. A. McArdle, R. H. W. Li, A. E. G. Cass, W. S. Dhillo and J. A. Tanner, Measuring luteinising hormone pulsatility with a robotic aptamer-enabled electrochemical reader, Nat. Commun., 2019, 10(1), 852 CrossRef.
- C. C. Chau, C. M. Maffeo, A. Aksimentiev, S. E. Radford, E. W. Hewitt and P. Actis, Single molecule delivery into living cells, Nat. Commun., 2024, 15(1), 4403 CrossRef CAS.
Footnotes |
| † Electronic supplementary information (ESI) available. See DOI: https://doi.org/10.1039/d4fd00143e |
| ‡ These authors contributed equally to this work. |
| This journal is © The Royal Society of Chemistry 2025 |

