 Open Access Article
Creative Commons Attribution 3.0 Unported Licence
PFAS self-assembly and adsorption dynamics on graphene: molecular insights into chemical and environmental influences†
Bradley G. Lamb and
Boran Ma
 *
*
School of Polymer Science and Engineering, University of Southern Mississippi, 118 College Drive, Hattiesburg, MS 39406, USA. E-mail: boran.ma@usm.edu
First published on 4th April 2025
Abstract
Per- and polyfluoroalkyl substances (PFAS) are a class of chemicals known for their persistence in the environment due to their amphiphilic nature and the strength of carbon–fluorine bonds. While these properties lead to various industrial and commercial applications including firefighting foams and non-stick coatings, these same characteristics also result in significant environmental and health concerns. This study employs atomistic molecular dynamics (MD) simulations to achieve molecular level insights into PFAS self-assembly and adsorption dynamics, to inform PFAS water remediation. MD simulations of PFAS with different headgroup chemistries and chain lengths on a graphene sorbent surface under varied pH conditions were performed. These simulation results elucidated the impacts of headgroup, chain length, and pH on PFAS adsorption behavior. At neutral pH, PFAS headgroups are fully deprotonated, causing electrostatic repulsions that lead to micelle-like aggregate formation in solution, hindering adsorption. Conversely, at acidic pH, these repulsions are diminished due to protonated headgroups, resulting in higher adsorption percentage with large, stacked aggregates that fully adsorb onto the sorbent. Additionally, chain length notably influenced aggregation, with longer chains forming larger aggregates and achieving more stable adsorption compared to shorter chains. Furthermore, perfluoro-sulfonic acids (PFSAs) displayed stronger adsorption and greater aggregate order than perfluoro-carboxylic acids (PFCAs) in general. These findings underscore the complex interplay between PFAS structure and the dynamics of their adsorption behaviors, as well as the potential of pH as a tuning parameter to enhance PFAS adsorption stability and thereby improve PFAS removal efficiency.
1 Introduction
Per- and polyfluoroalkyl substances (PFAS) are a diverse family of chemicals characterized by a hydrophobic fluoroalkyl chain and a commonly ionic hydrophilic headgroup. More than 1400 types of PFAS exist and are widely used across industries, with applications ranging from non-stick cookware and water-repellent textiles to firefighting foams and corrosion-resistant coatings.1,2 The presence of a fully (per-) or partially (poly-) fluorinated alkyl chain is the key to the exceptional thermal and chemical resistances of PFAS, as the carbon–fluorine bond is the strongest single bond in organic chemistry.3 Both density functional theory calculations and experimental data have shown that the strength of the CH3–F bond (115 kcal mol−1) surpasses that of any other single bond,4,5 enabling PFAS to withstand much harsher conditions than their hydrocarbon counterparts.In addition to their remarkable stability, certain PFAS, such as perfluorooctanoic acid (PFOA) and perfluorooctanesulfonic acid (PFOS), possess polar headgroups, rendering them amphiphilic. This amphiphilicity, combined with the strength of the carbon–fluorine bond, prevents PFAS from degrading under natural environmental conditions6 and makes PFAS persistent contaminants in both the environment and living organisms. The pathways through which PFAS can enter the human body include dermal contact, inhalation, and most commonly, ingestion of contaminated food or drinking water.7,8
The contamination and widespread presence of PFAS, along with their links to numerous health issues such as liver damage, cancer, and decreased immune response to vaccines underscore the pressing need for effective remediation.9 Testing as recent as November 2023 has revealed contamination at 839 drinking water sites across the United States.10 In response, regulatory actions have accelerated, including the introduction of a national drinking water standard in 2024 and a $9 billion USD infrastructure law to combat PFAS contamination.11 Alongside these regulatory measures, research and remediation efforts are also rapidly expanding, reflecting an increased commitment to mitigating the impacts of PFAS on health and the environment.12
1.1 Remediation
Given the complexity of PFAS contamination, no single remediation strategy can combat the issue. Effective remediation will require a multistep “treatment train” approach.13 Adsorption, especially using granular activated carbon (GAC), is a key stage in the process, collecting concentrated PFAS for further treatment. GAC effectively adsorbs long-chain PFAS through hydrophobic interactions with the fluoroalkyl chain, although its efficiency decreases for short-chain PFAS.14 Despite the widespread use of GAC, critical gaps remain in our understanding of PFAS adsorption mechanisms at the nanoscale, particularly on graphene-like substrates. Addressing these unknowns could lead to the development of more effective carbon-based sorbents, especially for short-chain PFAS.1.2 Molecular dynamics
Molecular dynamics (MD) simulations have been a powerful tool for researchers across various fields to better understand processes at the nanoscale since the 1950s.15 They can provide molecular level insights in material systems, complementary to experimental techniques. More specifically, in PFAS-relevant research, surfactants have been studied extensively by MD simulations, investigating both self-assembly behavior and adsorption mechanisms in different environments.16,17 Additionally, MD simulations have been used in PFAS studies explicitly, particularly evaluating self-assembly behavior and adsorption in various environments. Dong et al. used MD simulations to validate observations made in experiments in which the structure of PFOA aggregates in solution could be altered by varying solution conditions with the introduction of a model additive such as ethanol at various weight percents.18 A transition between co-solvent and co-surfactant behaviors was observed, where the co-solvent regime allows the ethanol molecules to penetrate the PFOA aggregate. This disrupts the formation of micelle-like aggregates which could be used to drive adsorption. Recently, Choudhary et al. investigated the structure and dynamics of PFAS at the water–air interface with MD simulations.19 Their work highlights the influence of the PFAS chemical structure on the assembly and orientation of PFAS at the water–air interface. Furthermore, an excellent study by Loganathan and Wilson utilized MD simulations to investigate the adsorption, interfacial structure, and dynamics of PFAS within the mesopores of kaolinite clay.20 Their work highlighted the significance of the hydroxyl layer of kaolinite and the headgroup chemistry on the adsorption process and transport potential of these materials through demonstrating the high degree of coordination between the sulfonate headgroups and the hydroxyl layer of kaolinite relative to carboxylate headgroups. Furthermore, they demonstrated the importance of the length of the hydrophobic fluoroalkyl chain, as longer-chain PFAS form large, aggregated clusters at the hydroxyl layer, whereas the shorter-chain PFAS form much smaller aggregates, existing primarily as monomers. Wilson and coworkers have also studied the effects of PFAS on thyroid synthesis in humans, as well as on estrogen receptors in rainbow trout with MD simulations. These works elucidate the negative health impacts PFAS have on both humans and marine life.21,22A recent study by Barbosa and Turner evaluated commonly used forcefields with over a dozen PFAS species in the aqueous phase, identifying the GROMOS 54A7 forcefield paired with the SPC/E water model as the most consistent with experimental results.23 Their work also categorized PFAS into hydrophobic and hydrophilic groups based on solvation-free energy calculations, providing a framework to understand their behavior in water. Furthermore, they elucidated PFAS interactions with graphene through potential of mean force measurements, revealing critical thermodynamic insights. Additionally, Bresnahan et al. provided valuable insights into how the functionalization of graphene flakes influences both the energy and ordering of PFAS about those functional groups with the use of MD simulations.24 They revealed a clustering mechanism of graphene oxide flakes resulting in pseudo-pore structures, driving interactions with PFOA and PFOS. Whereas pristine and fluorinated graphene flakes had the strongest interactions with the PFAS, highlighting the potential for the design of graphene flakes to leverage interactions between the flakes and PFAS to drive adsorption. These findings bolster confidence in future MD-based PFAS studies by validating forcefields against experimental benchmarks and offering fundamental data on the aqueous-phase properties of PFAS and their interactions with carbon-based sorbents such as graphene. These works provide a foundational understanding of the behavior of PFAS in water and how specific chemical and solution conditions influence the interactions of these materials with each other and their surrounding environments.
In this work, the interactions between PFAS in aqueous solution and carbon-based sorbents as well as the dynamics of PFAS adsorption are investigated using MD simulations. Systems with relatively high PFAS concentrations were modeled to understand how aggregation in solution affects PFAS adsorption, to better understand the adsorption stage of the PFAS “treatment train” that deals with concentrated PFAS solutions.13 Adsorption behavior of PFAS with different fluoroalkyl chain lengths and headgroup chemistries was evaluated. Various pH conditions were explored as potential means to improve PFAS adsorption efficiency. To our knowledge, this is the first comprehensive computational study examining how these chemical and solution factors affect the adsorption and aggregation of PFAS on carbon-based sorbents. Furthermore, our study highlights the dynamics of the adsorption process of PFAS, elucidating the causes of reduced adsorption for short-chain PFAS and perfluoro-carboxylic acids (PFCAs) relative to perfluoro-sulfonic acids (PFSAs).
2 Methods
The MD simulations in this study consist of a graphene sheet, water, PFAS, and Na+ ions in systems at neutral pH. Each simulation cell had dimensions of approximately 59 Å and 63 Å in the x and y directions, with a total height of 90 Å along the z-direction. Additionally, the simulation cells were periodic in the x and y directions but fixed in the z direction. The graphene sheet used in this study measured approximately 57 Å by 62 Å, bonded to itself across periodic boundaries to avoid any edge effects. The PFAS molecules with different chain lengths and headgroup chemistries are listed in Table 1.The graphene sheet was represented by an uncharged Lennard-Jones model,25 water was represented by the SPC/E model,26 and PFAS were represented by the GROMOS 54A7 forcefield with an optimized topology generated from the Automated Topology Builder.27 The forcefields selected for this study were based on a rigorous evaluation by Barbosa and Turner, which demonstrated that the Gromos 54A7 forcefield, used in conjunction with the SPC/E water model, provided the most experimentally accurate results for over 19 different PFAS.23 A combination of short-range Lennard-Jones interactions (eqn (1)) and long-range electrostatic interactions (eqn (2)) were used in the simulations.
 | (1) |
 | (2) |
The system was treated as semi-periodic in the z direction to satisfy the equations for the long-range electrostatic interactions. To achieve this, the KSpace slab parameter was employed to simulate additional cells above and below the original cell. Therefore, a 15 Å gap was left at the top and bottom of the cell to prevent self-interactions in the out-of-plane direction due to long-range KSpace interactions, resulting in an effective length of 60 Å in the z-direction for particles to exist within. The initial configuration of the water and PFAS molecules was generated using Moltemplate.28 MD simulations were performed using the Large-scale Atomic/Molecular Massively Parallel Simulator software (LAMMPS), with a timestep of 1 fs, under the NVT ensemble.29 To randomize the configuration, purely repulsive Lennard-Jones parameters were applied at 350 K for 2.5 ns. The cell was then resized to its final dimensions, to achieve a water density of 1 g cm−3, and was equilibrated for an additional 2.5 ns. Validation of the simulation protocol is discussed in the ESI in Fig. S7.†
Next, the graphene sheet was inserted beneath the water layer, fixed in place, and the system underwent further equilibration for 2.5 ns. The temperature was gradually lowered from 350 K to 300 K over a period of 5 ns. Once the system reached 300 K, the Lennard-Jones interaction cutoff was extended to 9 Å to incorporate attractive forces, and electrostatic interactions were introduced. After an additional 5 ns of equilibration with these updated interaction parameters, the production run was carried out for 100 ns.
PFAS molecules were initially restricted within 10–50 Å in the simulation cell by a Lennard-Jones potential, following eqn (1) (σ = 10 Å), to prevent PFAS from interacting with the sorbent surface and the water–air interface. At the beginning of the 100 ns production, PFAS were unconstrained to interact with the graphene sheet, but remained constrained to not interact with the water surface to prevent aggregation at the top of the simulation cell. Fig. 1 shows the pre-equilibrated system prior to PFAS-graphene interactions with repulsive walls highlighted.
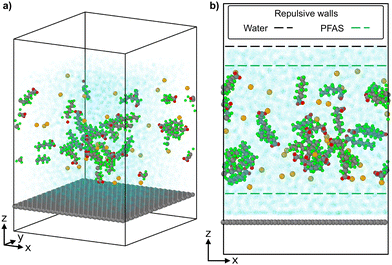 | ||
| Fig. 1 A representative (a) isotropic snapshot of the pre-equilibrated simulations and (b) front view with repulsive walls highlighted. | ||
Post-processing of the simulation trajectory was performed with in-house Python scripts utilizing the MDAnalysis package, and visualization was performed in OVITO.30–32 To understand how headgroup chemistry, chain length, and pH affect the structure and dynamics of PFAS aggregation and adsorption on graphene, the four PFAS shown in Table 1 were tested at neutral and acidic pHs. Previous in situ studies have shown that pH plays an important role in enhancing PFAS adsorption, although the underlying causes were only speculated.33 While there remains some debate on the pKa values of PFAS, a recent article by Patel et al. reported experimentally determined values of perfluoro-carboxylic acids (PFCAs) ranging from 7 to 10 carbon atoms both in bulk and at the water–air interface at various concentrations.34 For PFOA, pKa values ranged from 2.5 to 3.5 and decreased with increasing concentration. Furthermore, pKa was shown to decrease as the fluoroalkyl chain length decreases. As for perfluoro-sulfonic acids (PFSAs), there is a lack of experimentally reported pKa values, with only a theoretically calculated value of −3.27 for PFOS.35 Given the uncertainty surrounding the pKa values of PFAS, pH conditions are described here as neutral and acidic, with all PFAS being deprotonated in neutral pH conditions and all PFAS being protonated in acidic pH conditions. Forcefield parameters for the PFAS at both acidic and neutral conditions are discussed in Tables S1–S8.†
PFOA and PFBA were first modelled at a more dilute concentration of 45 mM (6 PFAS molecules per simulation cell) at neutral pH. Although this concentration is still several orders of magnitude larger than those seen in experimental studies, this system reflects a local concentration near the sorbent surface, as opposed to a bulk solution concentration.36 Furthermore, these concentrations are reflective of those used in similar MD studies of PFAS.20,37 These simulations were used to validate the simulation protocol in comparison with experimental studies. The concentration of PFAS was then increased to 215 mM (30 PFAS molecules per simulation cell). This was done to simulate a more concentrated solution, reflective of an environment at a sorbent surface in the above mentioned “treatment train”, to reveal the adsorption mechanism, assembly, and stability of adsorbed PFAS, providing molecular level insights into enhancing PFAS adsorption efficiency.38
3 Results and discussion
3.1 Microstructural characterization of adsorbed PFAS
 | (3) |
 | (4) |
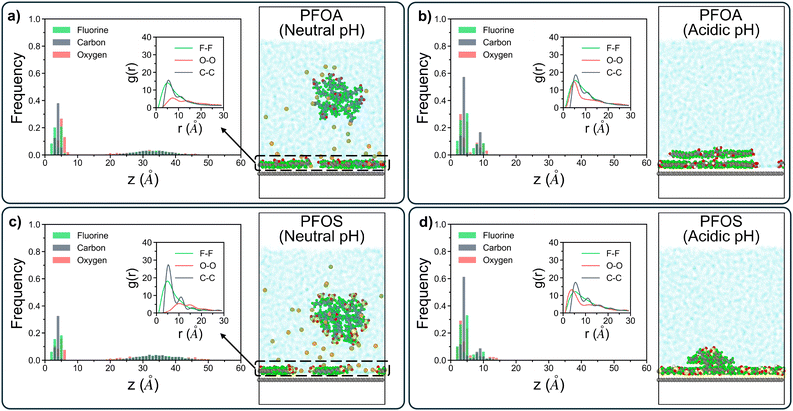
The linear density profiles, g(r) plots, and corresponding snapshots are shown in Fig. 2. At neutral pH, both PFOA and PFOS form an adsorbed monolayer, reflected by the sharp first peak around 4 Å in the linear density profiles, as well as a primary aggregate in solution, which corresponds to the broader peak at approximately 35 Å (Fig. 2a and c). The g(r) plots for the adsorbed layers of both PFOA and PFOS at neutral pH exhibit well-aligned peaks. Specifically, the C–C peaks at 6 Å and 12 Å indicate similar local ordering of the aggregates, characterized by closely-packed parallel rows with lateral ordering, driven by the hydrophobicity of the fluoroalkyl tails (Fig. S3†). Additionally, PFOS displays peaks with higher intensity and maintains local ordering within the C–C interactions at much larger scales compared to PFOA, highlighting the stronger preference of PFOS to form closely-packed and more ordered structures on the sorbent surface. However, the O–O peak for PFOS at neutral pH is shifted to a slightly larger r, attributed to the tail–head conformation that the adsorbed PFOS molecules adopt, as opposed to the tail–tail clustering of the adsorbed PFOA (Fig. S4†).
At acidic pH, both PFOA and PFOS fully adsorb onto the sorbent surface, forming dual and quasi-dual layers, respectively, with no detectable aggregates in solution at longer timescales. This multilayer adsorption is confirmed by the presence of two distinct peaks in the linear density profiles for PFOA and PFOS (Fig. 2b and d). Under highly acidic conditions, PFAS headgroups become protonated, and the resulting headgroup neutrality facilitates close packing of the fluoroalkyl chains, driving the formation of multilayered adsorbed structures. In contrast, at neutral pH, deprotonated PFAS are hindered by headgroup repulsion, leading to the formation of micelle-like aggregates in solution, with hydrophilic shells that remain semi-stable in water. Additionally, the second peak in the linear density plot for PFOS (Fig. 2d) is more dispersed than that for PFOA (Fig. 2b), likely due to some PFOS molecules adopting a tilted orientation within the layer. This behavior may arise from the increased hydrophilicity of the sulfonate headgroup compared to the carboxyl headgroup, as the tilted orientation maximizes the energetically favorable interactions at the headgroup–water interface. Similar to the neutral pH systems, the g(r) plots for acidic systems show good agreement regarding the F–F and O–O peaks. However, PFOS exhibits more pronounced C–C peaks than PFOA, extending up to 28 Å for PFOS and only 22 Å for PFOA. This observation further reinforces the tendency of PFOS to form larger, more ordered aggregates compared to PFOA, regardless of pH conditions.
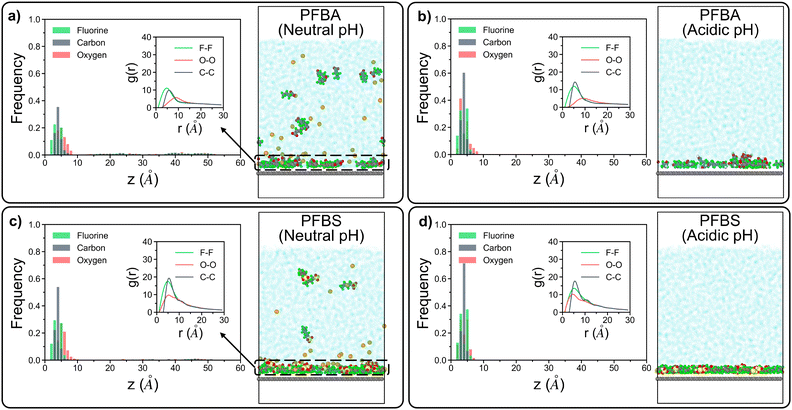
The linear density profiles of short-chain PFAS (Fig. 3) reveal that PFBA and PFBS at neutral pH form a monolayer on the sorbent surface. However, the remaining PFAS molecules in solution are significantly more dispersed compared to their long-chain counterparts, as shown by the broader distribution of data between 15 Å and 50 Å in Fig. 3a and c. The shorter hydrophobic fluoroalkyl chains are not sufficient to drive the formation of semi-stable aggregates in solution, a characteristic feature observed in longer-chain PFAS. This also results in stronger correlation between longer-chain PFAS headgroups and sodium ions in solution than that between shorter-chain PFAS headgroups and sodium ions, where shorter-chain PFAS are more dispersed while the longer-chain PFAS form ordered aggregates that the sodium ions orient around (details in Fig. S5†). Moreover, the g(r) plots for the adsorbed PFBA and PFBS highlight a stronger C–C peak for PFBS compared to PFBA. This finding aligns with trends seen in long-chain PFAS, where PFSAs exhibit a greater propensity to form larger, more structured aggregates than PFCAs. Nonetheless, shorter-chain PFAS are generally less likely to aggregate on the sorbent surface, consistent with their increased mobility and reduced hydrophobic interactions relative to their longer-chain counterparts. As a result, for the g(r) plots for sodium ions and headgroups of adsorbed PFAS, shorter-chain PFAS with less ordered aggregation demonstrate stronger peaks than longer-chain PFAS (details in Fig. S6†). Under acidic pH conditions, protonated PFBA and PFBS were all adsorbed onto the sorbent surface, forming loosely-packed monolayers with no evidence of multi-layered structures (Fig. 3b and d). The initial carbon peak for both PFBA and PFBS were shifted to higher z-values, extending beyond 5 Å, contrasting with the compact multilayer structures formed by longer-chain PFAS. This shift reflects the inability of short-chain PFAS to form densely-packed adsorbed layers.
Similar to their behavior under neutral pH, PFBA and PFBS did not sustain solution-state aggregates over longer timescales in acidic conditions. The g(r) plot for PFBA shows local ordering peaks of C–C interactions up to 12 Å, while PFBS displays local ordering up to 18 Å. Although both of these ranges are smaller than those of longer-chain PFAS, the more extended local ordering of PFBS reaffirms that PFSAs are generally more likely to form larger, more ordered structures than PFCAs, regardless of pH or chain length.
 | (5) |
 | (6) |
To further characterize aggregate morphology, asphericity, which quantifies the deviation of an aggregate from a spherical shape, was also calculated. These metrics (Rg, Df, and asphericity) were evaluated for aggregates adsorbed to the sorbent as well as in solution. The values were averaged across the 100 ns production run, with calculations performed at 0.125 ns intervals, and plotted against the number of atoms in the aggregates (Fig. S1 and S2†). For clarity, figures presented here include only data from adsorbed aggregates, however, plots with both adsorbed and solution-state aggregate data can be found in the ESI.†
Fig. 4 presents the Rg and Df data for aggregates adsorbed to the sorbent surface. For longer-chain PFAS under neutral pH conditions, deprotonated PFOA and PFOS formed the largest aggregates, as shown in Fig. 4a. These aggregates primarily adopted row-like head-to-head or head-to-tail structures on the sorbent surface, as depicted in Fig. S3.† In contrast, at acidic pH, protonated PFOA and PFOS formed more condensed, multilayered structures due to the absence of headgroup repulsions, resulting in smaller Rg values.
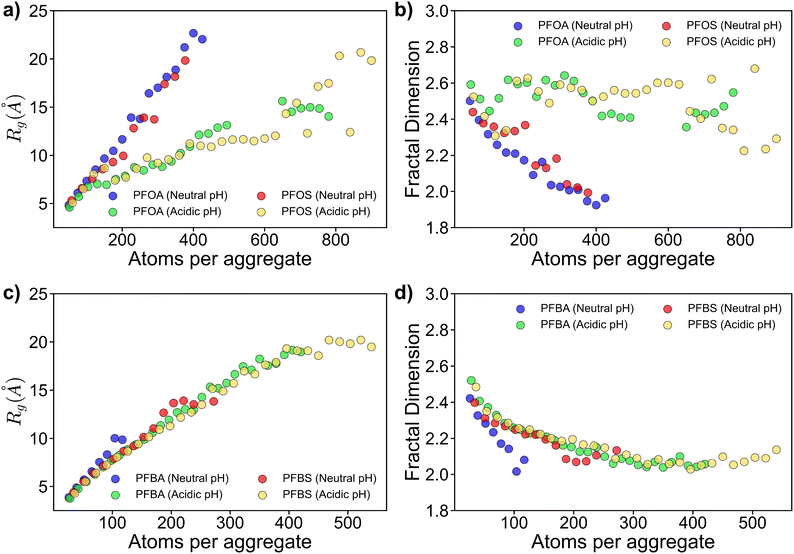 | ||
| Fig. 4 Radius of gyration and fractal dimension plots for (a, b) long-chain PFAS, and (c, d) short-chain PFAS. Only adsorbed PFAS were considered in the Rg and Df results presented. | ||
The Df data in Fig. 4b further supports these findings. Adsorbed aggregates exhibit lower Df, approaching approximately 2.0 for larger aggregates, consistent with their simpler, monolayer structure.40 Conversely, at acidic pH, PFOA and PFOS form more complex, multilayered cluster-like aggregates, with Df around 2.5. The lack of headgroup repulsions allows PFOA and PFOS to pack more densely, maximizing hydrophobic interactions between their fluouroalkyl chains.
Similar trends were observed for shorter-chain PFAS (Fig. 4c and d), however, with key distinctions arising from their shorter fluoroalkyl chains. At neutral pH, deprotonated PFBA and PFBS formed smaller aggregates, comprising fewer than 150 and 300 atoms, respectively. Notably, PFBA were more dispersed across the sorbent surface, whereas PFBS formed mini-clustered aggregates (Fig. S4†).
Under acidic pH conditions, PFBA and PFBS exhibited similar Rg and Df trends to those at neutral pH (Fig. 4c and d). However, the lack of headgroup repulsions, resulting from the acidic environment, promoted assembly into row-like structures at the sorbent surface for both PFBA and PFBS, despite the lack of long-range ordering observed for neutral pH systems (Fig. S4†).
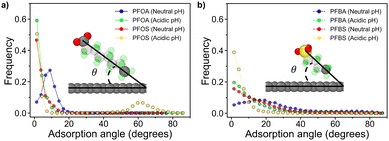 | ||
| Fig. 5 Adsorption angle plots and representative PFAS vectorization graphics for (a) long chain PFAS and (b) short chain PFAS. | ||
Fig. 5a illustrates the adsorption angles for longer-chain PFAS, where the majority of molecules adopt a flat orientation, with adsorption angles below 20°. PFOA and PFOS at neutral pH display slightly larger peak angles compared to their acidic pH counterparts. This difference arises from the deprotonation of headgroups at neutral pH, which increases hydrophilicity and reduces favorable interactions with the sorbent surface. Interestingly, despite the sulfonate headgroup in PFOS being more hydrophilic than the carboxyl headgroup in PFOA, PFOA exhibited a larger adsorption angle. This difference can be attributed to the varying degrees of restriction imposed by dihedral angles and backbone interactions in the two PFAS molecules. The unique dihedral constraints from PFOA and PFOS are shown in Fig. 6a and b, along with the energy associated with transitioning between dihedral states as a function of dihedral angle, as calculated from eqn (7), where E is the energy associated with the dihedral angle, K is the force constant, d is a phase factor, n is the periodicity of the dihedral angle, and ϕ is the dihedral angle.
E = K[1 + d![[thin space (1/6-em)]](https://www.rsc.org/images/entities/char_2009.gif) cos(nϕ)] cos(nϕ)]
| (7) |
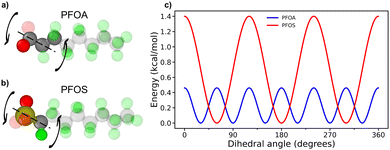 | ||
| Fig. 6 Dihedral constraints on PFAS headgroups for (a) PFOA and (b) PFOS. (c) Energy plot for associated PFAS head group dihedral rotations. | ||
PFOS faces a significant energy barrier for rotation between different dihedral states, resulting in more restricted rotation of the PFOS headgroup compared to PFOA. Conversely, PFOA, with its lower energy barriers, can more freely fluctuate between a wider range of rotational states (Fig. 6c). As a result, the PFOS headgroup is more constrained to the orientation of the fluoroalkyl chain, leading to lower adsorption angles for PFSAs. This phenomenon is more subtle in the acidic pH cases, where protonation of the headgroups reduces repulsion with the sorbent surface. A notable peak at 62° for PFOS at acidic pH is associated with the quasi-dual layered structures shown in Fig. 2d, where adsorbed PFOS molecules orient at an angle on top of the monolayer of adsorbed PFOS.
Fig. 5b shows that the shorter-chain PFAS, PFBA and PFBS, exhibited generally larger adsorption angles, likely due to their shorter fluoroalkyl chains and therefore greater molecular mobility compared to longer-chain PFAS. These elevated angles suggest decreased adsorption stability. At neutral pH, deprotonated PFBA exhibited slightly larger adsorption angles than other shorter-chain PFAS, likely due to weaker dihedral constraints on its headgroup, resulting in a more pronounced angle. Furthermore, the shorter-chain PFAS at acidic pH displayed smaller adsorption angles than those at neutral pH. This reduction in angle is attributed to decreased repulsion between the protonated headgroups and the hydrophobic sorbent surface. The smaller adsorption angles of the protonated PFAS indicate that acidic pH conditions can be leveraged to enhance the stability and efficiency of PFAS adsorption.
3.2 Dynamics of PFAS adsorption
 | (8) |
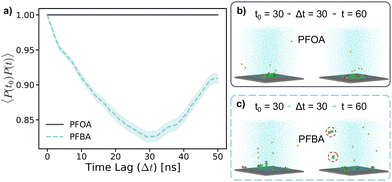
These behaviors are further highlighted in Fig. 7b and c, where simulation snapshots at a 30 ns time lag for PFOA and PFBA, respectively, are shown. PFOA forms a clustered aggregate on the sorbent surface, which remains stable over the 50 ns time lag (Fig. 7b). In contrast, adsorbed PFBA are scattered across the sorbent surface with no aggregation observed (Fig. 7c). Additionally, after the time lag of 30 ns, two of the PFBA molecules had desorbed from the sorbent surface, as indicated by the circles in Fig. 7c. These results explain previous in situ experimental observations, where typical carbon-based sorbents exhibit significant decreases in adsorption as the PFAS chain length decreases.14,42–44 As demonstrated in the 45 mM simulations, the high mobility of the shorter-chain PFBA leads to a less stable adsorption state, resulting in desorption, a phenomenon not observed for the longer-chain PFOA. During the adsorption stage of the previously mentioned “treatment train”, PFAS concentrations at the sorbent surface are higher than that in typical contaminated aqueous solutions. Therefore, to better understand PFAS aggregation and adsorption behaviors, simulations at high PFAS concentrations (215 mM) were carried out, also exploring varying pH conditions as a potential strategy to enhance PFAS adsorption.
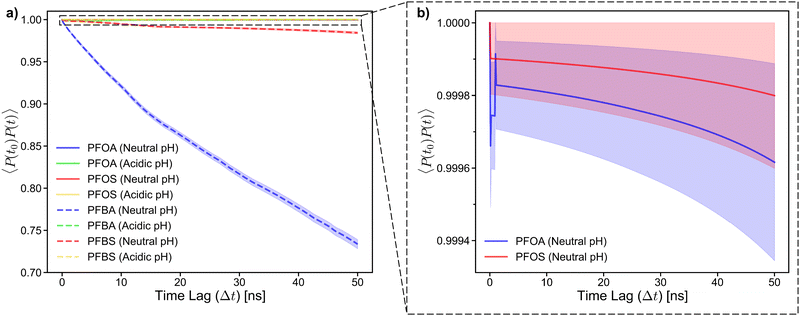
This behavior can be further explained by the adsorption angle analysis. The dihedral constraint forces the PFSAs to a lower adsorption angle, which reduces the likelihood of desorption by maintaining strong contact between fluoroalkyl chain and the sorbent surface. In contrast, the higher adsorption angles of PFCAs result in less contact between the PFCA molecules and the sorbent surface, leading to a less stable adsorption state. Additionally, when examining the autocorrelation plot near 1.0, the longer-chain PFAS at neutral pH exhibit a steady decline. This is due to the tendency of PFAS molecules at neutral pH desorbing and packing into the aggregate in solution without re-adsorbing within the timescale of this study. Additionally, PFOA shows a steeper decline in autocorrelation than PFOS, further supporting the earlier observations that PFSAs tend to have a more stable adsorption state than PFCAs (Fig. 8b).
The average percentage of adsorbed PFAS molecules and the number of desorption events over the final 40 ns, as well as residence time of PFAS that desorbed in the 40 ns timeframe are summarized in Table 2. PFAS molecules were classified as adsorbed or desorbed based on the criteria discussed in section 3.1. Residence time was tracked for individual molecules and averaged over different molecules where applicable. Remarkably, the protonated forms of all PFAS studied (acidic pH) achieved 100% adsorption, while the deprotonated forms only reached 56% and 66% for longer- and shorter-chain PFCAs, and 43% and 86% for longer- and shorter-chain PFSAs, respectively. This indicates that pH plays a critical role in PFAS adsorption, consistent with previous in situ experimental observations.33,45 The decrease in adsorption with increasing pH is likely due to electrostatic repulsion between the deprotonated PFAS headgroups, which creates a less favorable environment for these molecules to densely pack on the sorbent surface. Additionally, the more hydrophilic deprotonated headgroups promote the formation of semi-stable, micelle-like aggregates in solution, with hydrophilic shells that further inhibit adsorption onto the hydrophobic sorbent surface.
| Neutral pH | Acidic pH | |||||||
|---|---|---|---|---|---|---|---|---|
| PFOA | PFBA | PFOS | PFBS | PFOA | PFBA | PFOS | PFBS | |
| a Values related to PFAS that desorbed within the final 40 ns, not considering PFAS that remained adsorbed. | ||||||||
| Adsorption (%) | 56 | 66 | 43 | 86 | 100 | 100 | 100 | 100 |
| Desorption events | 0 | 11 | 0 | 1 | 0 | 0 | 0 | 0 |
| Residence timea (ns) | N/A | 57.67 | N/A | 75.75 | N/A | N/A | N/A | N/A |
Interestingly, there were no desorption events for longer-chain PFAS at both neutral and acidic pH, indicating the high stability of their adsorption due to strong interactions between the hydrophobic fluoroalkyl chains and the sorbent surface. In contrast, desorption events are observed to increase for the shorter-chain PFAS at neutral pH, resulting from the weaker hydrophobic interactions due to their shorter fluoroalkyl chains. However, at acidic pH, shorter-chain PFAS are stably adsorbed, further emphasizing the critical role pH plays in enhancing PFAS adsorption. Additionally, the higher number of desorption events for PFCAs compared to PFSAs, in addition to the longer residence time for PFBS relative to PFBA suggests lower adsorption stability for PFCAs, which offers a molecular level explanation for the lower adsorption efficiency for PFCAs observed in in situ studies.14
4 Conclusions
This study investigates the self-assembly behavior and adsorption dynamics of PFAS molecules with varying headgroup chemistries and chain lengths on a graphene sorbent under different pH conditions. Initial simulations of PFOA and PFBA at a low concentration (45 mM) and neutral pH elucidate results observed from in situ studies that report longer-chain PFAS exhibit greater adsorption than shorter-chain PFAS. This behavior arises from the higher adsorption stability of longer-chain PFAS, which is linked to their lower adsorption angle, as well as lower desorption rates revealed by the autocorrelation function of adsorption studied here.The results from the simulations at a concentration of 215 mM highlight the importance of headgroup chemistry, chain length, and pH. The critical role of pH on both PFAS assembly and adsorption dynamics is clearly demonstrated. At neutral pH, PFAS headgroups are fully deprotonated, leading to intermolecular electrostatic repulsions between the headgroups. These repulsions significantly affect PFAS assembly, causing longer-chain PFAS molecules to aggregate into micelle-like aggregates with hydrophilic shells, which interact unfavorably with the hydrophobic graphene sorbent and hinder adsorption. Furthermore, when adsorbed, the deprotonated headgroups of PFAS repel the sorbent surface, resulting in less stable adsorption, as indicated by higher adsorption angles and an increased number of desorption events. In contrast, at acidic pH, PFAS molecules become protonated, neutralizing the headgroup charges. Without the electrostatic repulsions, both longer- and shorter-chain PFAS form larger, well-ordered aggregates that are stably adsorbed on sorbent surface.
The fluoroalkyl chain length also played a crucial role in these behaviors. Longer-chain PFAS tended to form large aggregates in solution and row-like or clustered aggregates adsorbed to the sorbent surface at neutral and acidic pH, respectively. In contrast, shorter-chain PFAS only formed aggregates adsorbed on sorbent surface at acidic pH; at neutral pH, they remained dispersed in solution, with much smaller clusters forming on the surface. Additionally, the adsorption angles of shorter-chain PFAS were generally larger than those of longer-chain PFAS, indicating greater stability of the adsorbed longer-chain PFAS. This increased stability is further reflected by the smaller number of desorption events observed for longer-chain PFAS.
Although PFSAs and PFCAs exhibited similar behaviors both in solution and on the sorbent surface, PFSAs tended to form larger, more ordered aggregates. Furthermore, PFSAs generally demonstrated higher adsorption efficiency compared to PFCAs, indicated by lower adsorption angles, fewer desorption events, longer residence time, and a higher adsorption percentage. The only exception to this trend was observed for PFOS and PFOA at neutral pH, where the adsorption percentages were slightly lower. This deviation is likely due to the formation of solution-state aggregates, in which the PFOS aggregate contained more molecules than the PFOA aggregate.
Building on the promising results from the simulations conducted in this work, which revealed how PFAS headgroup chemistry, chain length, and pH influence PFAS self-assembly and adsorption dynamics, future research could further explore the vast diversity of PFAS structures and interactions between different types of PFAS within the same system. This could include examining additional features such as branching, varying degrees of fluorination, and alternative headgroup chemistries. Additionally, the properties of sorbent materials themselves—such as surface functionalization, roughness, and structural characteristics—could be investigated in future studies to design more efficient PFAS adsorption materials. Overall, this work highlights the critical role of PFAS chemical properties and solution conditions in shaping PFAS adsorption and aggregation behavior, offering valuable insights for optimizing the PFAS adsorption process within the “treatment train” framework.
Author contributions
B. G. L.: data curation, analysis, writing; B. M.: conceptualization, analysis, writing, supervision.Data availability
The topology files used in the MD simulations are available via https://zenodo.org/records/15040382. The data analysis scripts of this article are available in the interactive Google Colab notebook at https://colab.research.google.com/drive/1pngSdFGb0ES6pk5sChxIU56MnZ-6LID1?usp=sharing.Conflicts of interest
There are no conflicts to declare.Acknowledgements
The authors acknowledge HPC at The University of Southern Mississippi supported by the National Science Foundation under the Major Research Instrumentation (MRI) program via Grant # ACI 1626217. B. M. thanks the Director of the School of Polymer Science and Engineering, the Dean of the College of Arts and Sciences, and the Vice President for Research, all at the University of Southern Mississippi, for their support with generous start-up funds.References
- Z. Abunada, M. Y. D. Alazaiza and M. J. K. Bashir, Water, 2020, 12, 3590 CrossRef CAS.
- K. Prevedouros, I. T. Cousins, R. C. Buck and S. H. Korzeniowski, Environ. Sci. Technol., 2006, 40, 32–44 CrossRef CAS PubMed.
- D. O'Hagan, Chem. Soc. Rev., 2008, 37, 308–319 RSC.
- G. T. de Jong and F. M. Bickelhaupt, J. Chem. Theory Comput., 2007, 3, 514–529 CrossRef CAS PubMed.
- S. J. Blanksby and G. B. Ellison, Acc. Chem. Res., 2003, 36, 255–263 CrossRef CAS PubMed.
- Z. Wang, I. T. Cousins, M. Scheringer and K. Hungerbuehler, Environ. Int., 2015, 75, 172–179 CrossRef CAS PubMed.
- M. A. Kaiser, B. J. Dawson, C. A. Barton and M. A. Botelho, Ann. Occup. Hyg., 2010, 54, 915–922 CAS.
- G. B. Post, P. D. Cohn and K. R. Cooper, Environ. Res., 2012, 116, 93–117 CrossRef CAS PubMed.
- E. Panieri, K. Baralic, D. Djukic-Cosic, A. Buha Djordjevic and L. Saso, Toxics, 2022, 10, 44 CrossRef CAS PubMed.
- EWG, Interactive Map: PFAS Contamination Crisis: New Data Show 7457 Sites in 50 States, https://www.ewg.org/interactive-maps/pfas_contamination/.
- T. W. House, FACT SHEET: Biden-Harris Administration Takes New Action to Protect Communities from PFAS Pollution, 2023, https://www.whitehouse.gov/briefing-room/statements-releases/2023/03/14/fact-sheet-biden-harris-administration-takes-new-action-to-protect-communities-from-pfas-pollution/ Search PubMed.
- B. Ma, Acc. Mater. Res., 2024, 5, 772–774 CrossRef CAS.
- D. Lu, S. Sha, J. Luo, Z. Huang and X. Zhang Jackie, J. Hazard. Mater., 2020, 386, 121963 CrossRef CAS PubMed.
- X. Xiao, B. A. Ulrich, B. Chen and C. P. Higgins, Environ. Sci. Technol., 2017, 51, 6342–6351 CrossRef CAS PubMed.
- B. J. Alder and T. E. Wainwright, J. Chem. Phys., 1957, 27, 1208–1209 CrossRef CAS.
- S. Faramarzi, B. Bonnett, C. A. Scaggs, A. Hoffmaster, D. Grodi, E. Harvey and B. Mertz, Langmuir, 2017, 33, 9934–9943 CrossRef CAS PubMed.
- X. Lyu, X. You, M. He, W. Zhang, H. Wei, L. Li and Q. He, Fuel, 2018, 211, 529–534 CrossRef CAS.
- D. Dong, S. Kancharla, J. Hooper, M. Tsianou, D. Bedrov and P. Alexandridis, Phys. Chem. Chem. Phys., 2021, 23, 10029–10039 RSC.
- A. Choudhary, A. Tsunduru, M. Tsianou, P. Alexandridis and D. Bedrov, J. Colloid Interface Sci., 2025, 679, 1207–1218 CrossRef CAS PubMed.
- N. Loganathan and A. K. Wilson, Environ. Sci. Technol., 2022, 56, 8043–8052 CrossRef CAS PubMed.
- S. K. Bali, K. Hall, R. I. Massoud, N. M. S. Almeida and A. K. Wilson, Environ. Sci. Technol., 2024, 58, 15960–15970 CrossRef CAS PubMed.
- S. K. Bali, R. Martin, N. M. S. Almeida, C. Saunders and A. K. Wilson, ACS Omega, 2024, 9, 39554–39563 CAS.
- G. D. Barbosa and C. H. Turner, J. Mol. Liq., 2023, 389, 122826 CrossRef CAS.
- C. G. Bresnahan, T. C. Schutt and M. K. Shukla, Chemosphere, 2023, 345, 140462 CrossRef CAS PubMed.
- S. Dasetty, J. K. Barrows and S. Sarupria, Soft Matter, 2019, 15, 2359–2372 RSC.
- H. J. C. Berendsen, J. R. Grigera and T. P. Straatsma, J. Phys. Chem., 1987, 91, 6269–6271 CrossRef CAS.
- A. K. Malde, L. Zuo, M. Breeze, M. Stroet, D. Poger, P. C. Nair, C. Oostenbrink and A. E. Mark, J. Chem. Theory Comput., 2011, 7, 4026–4037 CrossRef CAS PubMed.
- A. I. Jewett, D. Stelter, J. Lambert, S. M. Saladi, O. M. Roscioni, M. Ricci, L. Autin, M. Maritan, S. M. Bashusqeh, T. Keyes, R. T. Dame, J.-E. Shea, G. J. Jensen and D. S. Goodsell, J. Mol. Biol., 2021, 433, 166841 CrossRef CAS PubMed.
- A. P. Thompson, H. M. Aktulga, R. Berger, D. S. Bolintineanu, W. M. Brown, P. S. Crozier, P. J. in 't Veld, A. Kohlmeyer, S. G. Moore, T. D. Nguyen, R. Shan, M. J. Stevens, J. Tranchida, C. Trott and S. J. Plimpton, Comput. Phys. Commun., 2022, 271, 108171 CrossRef CAS.
- N. Michaud-Agrawal, E. J. Denning, T. B. Woolf and O. Beckstein, J. Comput. Chem., 2011, 32, 2319–2327 CrossRef CAS PubMed.
- R. J. Gowers, M. Linke, J. Barnoud, T. J. E. Reddy, M. N. Melo, S. L. Seyler, J. Domański, D. L. Dotson, S. Buchoux, I. M. Kenney and O. Beckstein, scipy, 2016.
- A. Stukowski, Modell. Simul. Mater. Sci. Eng., 2010, 18, 015012 Search PubMed.
- F. Wang and K. Shih, Water Res., 2011, 45, 2925–2930 CrossRef CAS PubMed.
- R. Patel, L. E. Saab, P. J. Brahana, K. T. Valsaraj and B. Bharti, Langmuir, 2024, 40, 3651–3658 CAS.
- C. Xu, H. Chen and F. Jiang, Colloids Surf., A, 2015, 479, 60–67 CrossRef CAS.
- B. Cantoni, A. Turolla, J. Wellmitz, A. S. Ruhl and M. Antonelli, Sci. Total Environ., 2021, 795, 148821 CrossRef CAS PubMed.
- J. A. R. Willemsen and I. C. Bourg, J. Colloid Interface Sci., 2021, 585, 337–346 CrossRef CAS PubMed.
- O. US EPA, Reducing PFAS in Drinking Water with Treatment Technologies, 2018, https://www.epa.gov/sciencematters/reducing-pfas-drinking-water-treatment-technologies Search PubMed.
- G. Pranami, M. H. Lamm and R. D. Vigil, Phys. Rev. E: Stat., Nonlinear, Soft Matter Phys., 2010, 82, 051402 CrossRef PubMed.
- Y. Pang, Y. Wang, Z. Wang, Y. Zhang, L. Liu, S. Kong, F. Liu, Z. Shi and W. Li, J. Geophys. Res.: Atmos., 2022, 127, e2021JD036055 CrossRef CAS.
- K. B. Tan, M. Vakili, B. A. Horri, P. E. Poh, A. Z. Abdullah and B. Salamatinia, Sep. Purif. Technol., 2015, 150, 229–242 CrossRef CAS.
- V. Ochoa-Herrera and R. Sierra-Alvarez, Chemosphere, 2008, 72, 1588–1593 CrossRef CAS PubMed.
- C. J. Liu, D. Werner and C. Bellona, Environ. Sci.: Water Res. Technol., 2019, 5, 1844–1853 RSC.
- T. D. Appleman, E. R. V. Dickenson, C. Bellona and C. P. Higgins, J. Hazard. Mater., 2013, 260, 740–746 CrossRef CAS PubMed.
- Q. Yu, R. Zhang, S. Deng, J. Huang and G. Yu, Water Res., 2009, 43, 1150–1158 CrossRef CAS PubMed.
Footnote |
| † Electronic supplementary information (ESI) available. See DOI: https://doi.org/10.1039/d4nr04995k |
| This journal is © The Royal Society of Chemistry 2025 |


